
Remember me


This study initially started with eight SLC35A2-CDG patient derived fibroblast cell lines. SLC35A2 is located on the X chromosome. Random XCI in females can result in a mixed population of WT- and mutant-expressing cells. Somatic mosaicism has also been reported in males [1]. Fibroblasts expressing mutant SLC35A2 alleles tend to grow slower, potentially leading to a positive selection of the WT-expressing cells when cultured over prolonged periods [1].
Three male patient (P) cell lines (P1, P3, P4) expressed only the SLC35A2 mutant allele. One female cell line (P2) had ~ 60% cells expressing the mutant allele, which remained stable throughout the study. The remaining four cell lines had mainly WT expression and were not further analyzed. Each of the four selected cell lines had a different pathogenic missense variant (Table 1), not affecting protein expression (Fig. S1).
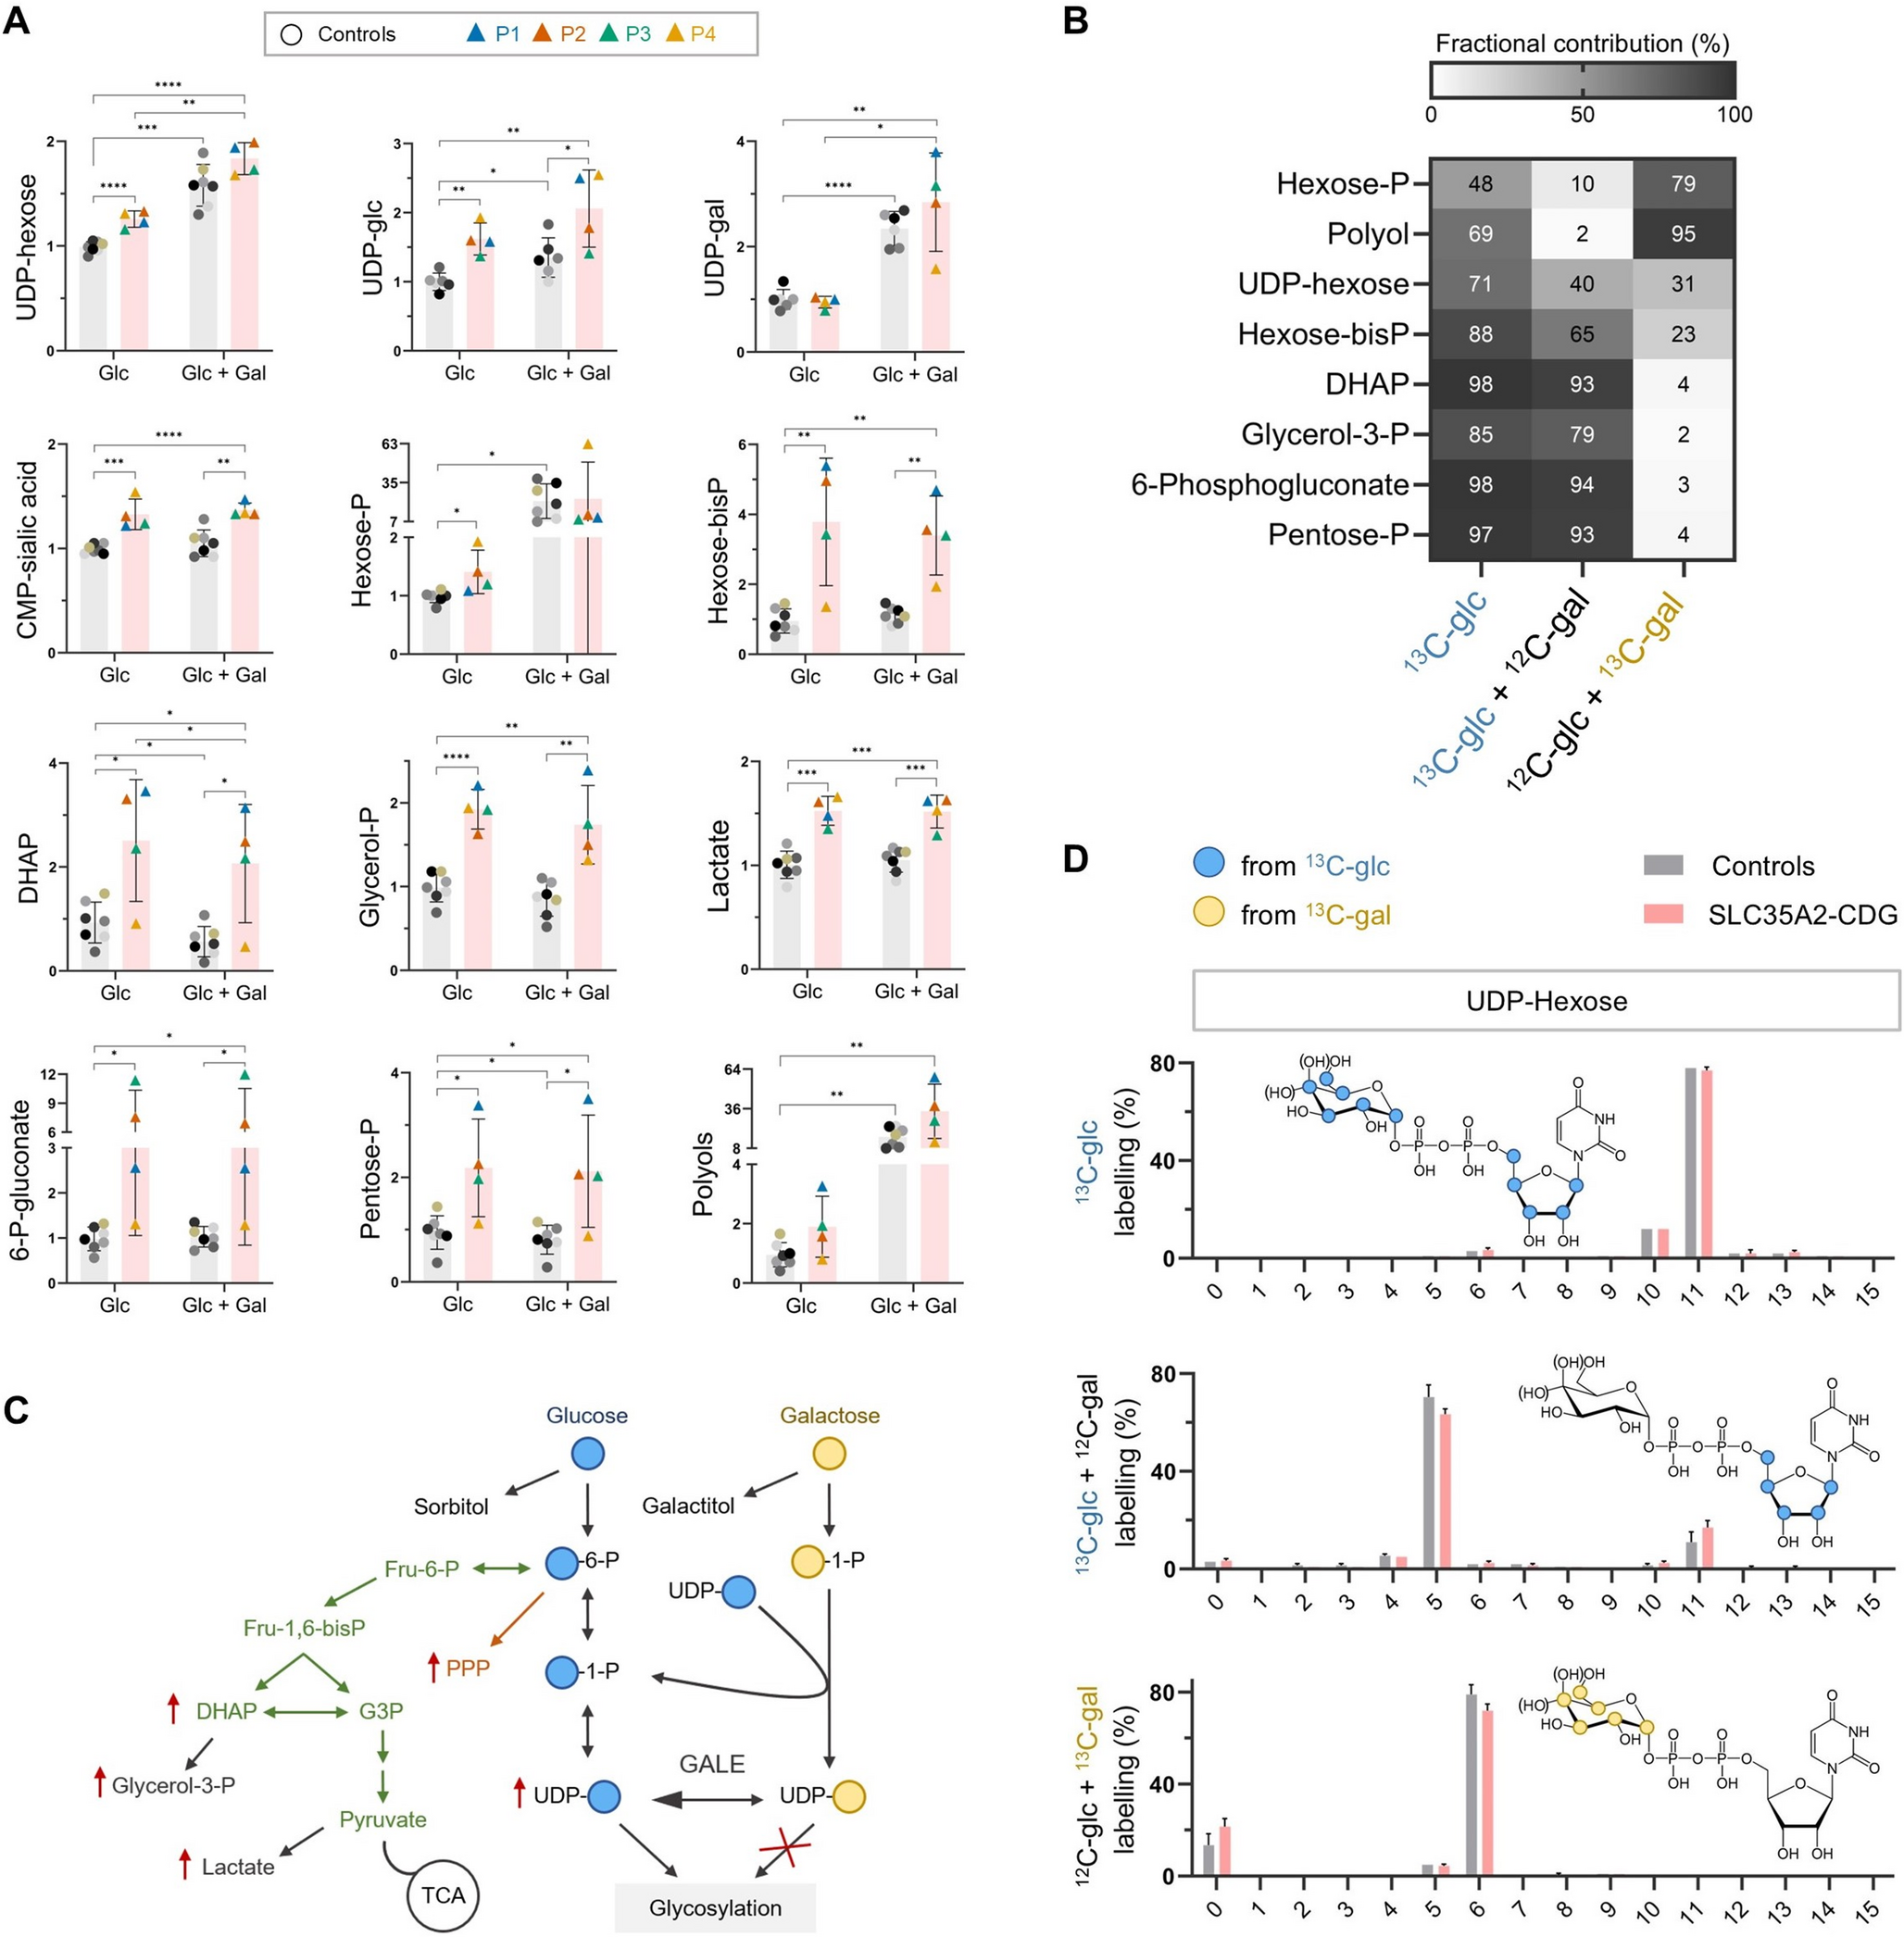
Table 1 Genetic characteristics of the SLC35A2-CDG patient fibroblast cell lines used in the studyGalactose supplementation increases UDP-gal in SLC35A2-CDG fibroblastsSLC35A2-CDG fibroblasts showed significantly higher relative abundance of UDP-hexoses (UDP-glucose (glc) + UDP-galactose (gal)) compared to controls (Fig. 1A). The UDP-glucose-6-dehydrogenase (UGDH) assay (Supplementary material) revealed that while UDP-gal was unchanged, UDP-glc was higher in SLC35A2-CDG fibroblasts (Fig. 1A). This points to UDP-hexose-4-epimerase (GALE) enzyme converting the UDP-gal pool—that cannot be efficiently transported into the ER and Golgi —into UDP-glc (Fig. 1C). Since this conversion partially covers the cellular needs for UDP-glc, glucose itself could be redirected to other metabolic pathways, resulting in higher relative abundances of several metabolites of the pentose phosphate pathway (PPP), glycolysis and its byproducts in SLC35A2-CDG fibroblasts (Fig. 1A). CMP-sialic acid levels were also higher in SLC35A2-CDG, presumably due to the decrease of galactosylated glycans that sialic acid can bind to.
To study the underlying biochemical mechanisms of galactose therapy in SLC35A2-CDG, medium was supplemented with galactose. Relative abundances of most glycolysis and PPP metabolites did not change upon galactose treatment (Fig. 1A). However, both UDP-hexoses increased compared to the untreated condition, especially UDP-gal, whose levels increased ~ 2- to 4-fold (p = 0.046) (Fig. 1A). Polyols— mostly galactitol, as observed in the tracer analysis with 13C-gal (Fig. 1B)—also increased in both patient-derived and control fibroblasts (Fig. 1A).
To follow the metabolic fate of galactose we performed tracer metabolomic analyses using 13C-glc and 13C-gal. In untreated conditions, fractional contribution of 13C-glc to the different metabolites is high (Fig. 1B). After treatment, 13C-gal is mainly metabolized to hexose phosphates (mostly gal-1-P, and also glc-1-P and glc-6-P), hexose bisphosphates (glc-1,6-bisP and fructose-1,6-bisP), UDP-hexoses (UDP-gal and UDP-glc) and polyols (galactitol). Consequently, fractional contribution of 13C-glc considerably decreases for these compounds (Fig. 1B). The low contribution of 13C-gal to metabolites of PPP and glycolysis supports the hypothesis that when UDP-glc pool is high, more glucose is redirected to these pathways, and only a small fraction (~ 3%) derives from galactose (Fig. 1B).
Fig. 1
Study of the central carbon metabolism and nucleotide sugars in SLC35A2-CDG fibroblasts by LC-MS. (A) Relative abundances of central carbon metabolites and nucleotide sugars in control (C1-C7; technical n = 3–6) and SLC35A2-CDG fibroblasts (P1-P4; technical n = 3–12) cultured in glucose (glc)-only medium or with galactose (gal) supplementation (Glc + Gal). Abundances are relative to controls on glucose. (B) Fractional contribution of 13C-glc and 13C-gal to central carbon metabolites and UDP-hexose in SLC35A2-CDG fibroblasts (P2, P3) cultured with or without galactose. (C) Schematic representation of the metabolic rewiring in SLC35A2-CDG. (D) Isotopologue profiling in UDP-hexose in control (C1, C2) and SLC35A2-CDG fibroblasts (P2, P3) cultured with 13C-glc or 13C-gal. X axis represents the number of carbons derived from the labeled nutrient. Blue and yellow circles show the sugars deriving predominantly from 13C-glc or 13C-gal in each condition. Hydroxyl groups in parentheses represent alternative positions, where one corresponds to UDP-glc and the other to UDP-gal. Data are represented as the mean ± SD. *p ≤ 0.05; **p ≤ 0.01; ***p ≤ 0.001; ****p ≤ 0.0001. DHAP: Dihydroxyacetone phosphate, G3P: Glyceraldehyde 3-phosphate, PPP: Pentose phosphate pathway, TCA: Tricarboxylic acid cycle
Analysis of the isotopologue profiles in untreated conditions, showed that both the ribose (5 C) and hexose (6 C) moieties (combined 11 C) in UDP-hexose mainly derived from glucose (Fig. 1D, top). When the medium is supplemented with galactose, 13C-glc mostly contributes to the ribose moiety (Fig. 1D, middle), while hexoses mainly derive from 13C-gal (Fig. 1D, bottom). This is similar to the effect of galactose supplementation in PGM1-CDG [19].
In normal conditions, GALE maintains the equilibrium between UDP-glc and UDP-gal at an approximate ratio of 3:1 [23], which is what we observed in untreated control fibroblasts. This ratio was 5:1 for SLC35A2-CDG fibroblasts. However, after galactose treatment, UDP-glc: UDP-gal ratios decreased to ~ 4:3 in controls and ~ 2:1 in SLC35A2-CDG (data not shown). Altogether, we can conclude that in untreated conditions, UDP-gal is converted to UDP-glc and does not accumulate in SLC35A2-CDG fibroblasts. After galactose supplementation, the high UDP-gal concentration saturates GALE, leading to an increase in the UDP-gal pool.
There are no clear N- and O-glycosylation deficiencies in SLC35A2-CDG fibroblastsSince SLC35A2-CDG typically affects N- and O-linked glycosylation, we first studied both of these pathways. Western blot of the protein LAMP2 (Supplementary material), which contains 16 N-glycans, did not show clear differences between controls and patients, indicating the presence of equally glycosylated forms of the protein in all samples (Fig. S2). Similarly, cellular N-glycome analysis by matrix-assisted laser desorption/ionization time-of-flight (MALDI-TOF) MS (Supplementary material) showed comparative spectra with galactosylated and sialylated N-glycans in similar proportions (Fig. S3). Hence, there is no clear N-glycosylation deficiency in the patient cells.
We studied mucin type O-glycosylation by performing the benzyl (Bn)-GalNAc (N-Acetylgalactosamine) assay (Supplementary material). Bn-GalNAc is an artificial O-glycosylation acceptor that can be taken up, glycosylated in a similar manner to that of O-glycoproteins, secreted by the cells in culture, and subsequentially analyzed by MALDI-TOF [24]. SLC35A2-CDG fibroblasts showed Bn-O-glycans, demonstrating that this pathway is not impaired (Fig. S4). However, the ratios of simplest (monogalactosylated) to most complex (digalactosylated) O-glycans were slightly increased in SLC35A2-CDG fibroblasts, suggesting a minimal O-glycosylation deficiency.
Glycosphingolipid deficiency in SLC35A2-CDG improves with galactose supplementationNeutral glycosphingolipidsNext, given that protein glycosylation seems preserved, we proceeded to investigate if the GSL synthesis pathway is affected in SLC35A2-CDG fibroblasts. We first studied neutral GSLs of the globo-series. Glucosylceramide (GlcCer) is synthesized in the cytosolic leaflet of the cis-Golgi after the transfer of glucose from UDP-glc to a ceramide residue (Fig. 2B). Of note, since galactosylceramide synthase is not expressed in fibroblasts, the hexosylceramide (HexCer) pool corresponds to GlcCer only [25]. GlcCer is then translocated into the Golgi lumen, where it is converted into lactosylceramide (LacCer) and Gb3 after the addition of one or two galactose residues, respectively. Subsequently, Gb4 is formed after addition of GalNAc to Gb3 (Fig. 2B). SLC35A2 is thus needed to provide the substrates for the synthesis of LacCer, Gb3 and Gb4.
GlcCer was significantly elevated in SLC35A2-CDG fibroblasts (3- to 9-fold, p = 0.0037) compared to controls (Fig. 2A and S5). LacCer was also elevated to a lesser degree. In contrast, Gb3 and Gb4 were significantly lower in patient fibroblasts (Fig. 2A and S5). Thus, GSL synthesis is altered in SLC35A2-CDG, especially decreasing GSLs containing two galactose residues.
Next, we studied the effect of galactose supplementation on lipid glycosylation in SLC35A2-CDG. While it did not alter GlcCer levels in controls, treatment with galactose decreased GlcCer in all patient cell lines (p = 0.053) (Fig. 2A and S5). Consequently, we observed an increase in both Gb3 and Gb4, the levels of which even normalized for some patients (Fig. 2A and S5).
Tracer metabolomics confirmed that the supplemented galactose was incorporated into all newly synthesized GSLs (Fig. 2C). Isotopologue profiling showed that in untreated conditions the glucose, galactose and GalNAc residues that compose Gb3 and Gb4 are derived from glucose (Gb3: 3 × 6 C = 18 C; Gb4: 18 C + 8 C = 26 C) (Fig. 2D). The + 2 C labeling pattern comes from the ceramide moiety (2 C coming from serine or acyl-coA). However, when supplemented with galactose, cells use it preferentially over glucose to form both UDP-gal and UDP-glc (Fig. 2B). This translates into 13C-gal labeling of either two (12 C) or three (18 C) hexoses and 13C-glc labeling mainly in the ceramide moiety and GalNAc in Gb4 (UDP-GalNAc can only be synthesized from glucose) (Fig. 2D). This is unequivocal evidence that galactose supplementation increases UDP-gal transport into the Golgi and incorporates into neutral GSLs in SLC35A2-CDG fibroblasts.
Fig. 2
Study of neutral glycosphingolipids (GSLs) in SLC35A2-CDG fibroblasts by LC-MS. (A) Relative abundances of neutral GSLs in control (C1-C5; technical n = 3–9) and SLC35A2-CDG fibroblasts (P1-P4; technical n = 3–9) cultured in glucose (glc)-only medium or with galactose (gal) supplementation (Glc + Gal). Abundances are relative to controls on glucose. Graphs show the average of the most abundant GSL species (d18:1/16:0, d18:1/22:0, d18:1/24:0 and d18:1/24:1). Individual graphs for each species can be found in Fig. S5. (B) Schematic representation of neutral GSL synthesis. (C) Fractional contribution of 13C-glc and 13C-gal to neutral GSLs in SLC35A2-CDG fibroblasts (P2, P3) cultured with or without galactose. (D) Isotopologue profiling in Gb3 and Gb4 in control (C1, C2) and SLC35A2-CDG fibroblasts (P1-P3) cultured with 13C-glc or 13C-gal. X axis represents the number of carbons derived from the labeled nutrient. Blue and yellow circles show the carbons in the sugars deriving predominantly from 13C-glc or 13C-gal in each condition. Data are represented as the mean ± SD. *p ≤ 0.05; **p ≤ 0.01; ***p ≤ 0.001; ****p ≤ 0.0001. GlcCer: Glucosylceramide, LacCer: Lactosylceramide
GangliosidesGangliosides are sialylated GSLs that are essential for the normal function of the All patient derived fibroblasts showed a significant accumulation of GlcCer. Sialylation of LacCer leads to the synthesis of GM3 and subsequent addition of GalNAc, sialic acid and galactose residues leads to the formation of more complex gangliosides (Fig. 3C).
No differences were observed in relative abundances of GM3 and GM2 between controls and SLC35A2-CDG fibroblasts (Fig. 3A and S6), or in their disialylated derivatives GD3 and GD2 (Fig. S6B). Since the synthesis of these gangliosides from LacCer—which showed higher relative abundance in patient cells (Fig. 2A)—does not require the SLC35A2-mediated transport of additional galactose residues, it was expected that their relative abundances would not be negatively affected in patient cells. On the contrary, relative abundances of complex gangliosides GM1 (in some cell lines), and especially, GD1a and GD1b were significantly lower in SLC35A2-CDG fibroblasts compared to controls (Fig. 3A and S6). Of note, since they have the same mass and are not chromatographically separated, GD1a and GD1b are measured together in the MS (referred to as GD1a/b). When ganglioside levels were evaluated relative to their non-galactosylated precursor, GlcCer, the resulting ratios were significantly lower in SLC35A2-CDG fibroblasts compared to controls, mainly due to the elevated GlcCer levels in patients (Fig. 3B and S7). This precursor-product imbalance was particularly pronounced for GD1a/b, with ratios more than 6-fold lower (p = 0.0025). Notably, galactose supplementation improved this imbalance for most gangliosides, as a consequence of enhanced galactosylation (Fig. 3B and S7).
Additionally, we measured the expression of several glycosyltransferases involved in GSL synthesis. Overall, no statistically significant differences in relative gene expression were observed between both groups (Fig. S8).
Fig. 3
Ganglioside analysis in SLC35A2-CDG fibroblasts by LC-MS. (A) Ganglioside relative abundances in control (C1-C8; technical n = 1–3) and SLC35A2-CDG fibroblasts (P1-P4; technical n = 3) cultured in glucose (glc)-only medium or with galactose (gal) supplementation (Glc + Gal). Abundances are relative to controls on glucose. Graphs show the average of the most abundant species (d18:1/16:0, d18:1/22:0, d18:1/24:0 and d18:1/24:1). Individual graphs for each species can be found in Fig. S6. (B) Ganglioside/GlcCer ratios of control (C1-C8; technical n = 1–3) and SLC35A2-CDG fibroblasts (P1-P4; technical n = 3) with or without galactose. Ratios were calculated with the raw MS data normalized to the internal standard and protein content per sample. Graphs showing individual points for each experiment, as well as the ratios of the rest of glycosphingolipids, can be found in Fig. S7. (C) Schematic representation of ganglioside synthesis. (D) Fractional contribution of 13C-glc and 13C-gal to different gangliosides in SLC35A2-CDG fibroblasts cultured with or without galactose. (E) Isotopologue profiling in GD1a/b in control and SLC35A2-CDG fibroblasts cultured with or without galactose and treated with 13C-glc or 13C-gal. X axis represents the number of carbons derived from the labeled nutrient. Blue and yellow circles show the carbons in the sugars deriving predominantly from 13C-glc or 13C-gal in each condition. In untreated conditions, sugars composing GD1a/b derive from glucose (3 × 6 C + 2 × 11 C + 8 C = 48 C). Galactose treatment results in 13C-gal labeling of two (12 C) or three (18 C) hexoses and 13C-glc labeling in the ceramide moiety, GalNAc and sialic acid. Data are represented as the mean ± SD. *p ≤ 0.05; **p ≤ 0.01; ***p ≤ 0.001; ****p ≤ 0.0001. GlcCer: Glucosylceramide
CHO-Lec8 cells carry inactivating mutations in SLC35A2, resulting in strongly decreased UDP-gal transport and gal-deficient glycoconjugates [26]. This translates into severe N- and O-glycosylation deficiencies [27]. Importantly, even though SLC35A2 is not active, some residual galactosylation is observed [28]. CHO-Lec8 cells also showed GlcCer accumulation (like fibroblasts, they do not express GalCer synthase) (Fig. 4) [29]. However, contrary to SLC35A2-CDG fibroblasts, CHO-Lec8 showed considerably lower LacCer and GM3 levels compared to WT CHO cells (Fig. 4). CHO cells do not synthesize more complex gangliosides [29].
Fig. 4
Glycosphingolipid (GSL) analysis in CHO and CHO-Lec8 cells. Relative abundances of GlcCer, LacCer and GM3 in CHO and CHO-Lec8 cells (technical n = 3) cultured in glucose (glc)-only medium, with galactose (gal) supplementation (Glc + Gal) or with galactose and epalrestat (Glc + Gal + Epal). Abundances are relative to CHO cells on glucose. Graphs show the average of the most abundant GSL species (d18:1/16:0, d18:1/22:0, d18:1/24:0 and d18:1/24:1). Data are represented as the mean ± SD. *p ≤ 0.05; **p ≤ 0.01; ***p ≤ 0.001; ****p ≤ 0.0001. GlcCer: Glucosylceramide, LacCer: Lactosylceramide
Effect of galactose supplementation on GM3, GM2 and GM1 seemed to be cell line-dependent. After treatment, relative abundances decreased in those cell lines that had higher levels in untreated conditions, but increased in those that presented deficiency prior to treatment (Fig. 3A and S6). In the case of GD1a/b, relative abundances significantly increased after galactose supplementation in all patient cell lines (Fig. 3A and S6). GSL/GlcCer ratios also increased in patient fibroblasts in treated compared to untreated conditions (Fig. 3B and S7), due to a decrease in GlcCer and accompanying increase in galactosylated GSLs. Tracer metabolomics analyses confirmed the incorporation of the administered 13C-gal into the different gangliosides (Fig. 3D). Analysis of GD1a/b isotopologue profiles revealed a similar pattern to those of Gb3 and Gb4 (Fig. 3E). Altogether, these results show that galactose supplementation helps to restore GSL homeostasis and improves ganglioside deficiency in SLC35A2-CDG fibroblasts via the direct incorporation of the galactose provided.
Even in CHO-Lec8 cells, galactose supplementation increased the relative abundances of LacCer and GM3 (although not significantly due to the low sample size) (Fig. 4), proving that treatment with galactose improves UDP-gal transport even when residual galactosylation is very low.
Combination therapies are not more effective than galactose treatment aloneGiven that galactose supplementation improves UDP-gal transport into the Golgi, we wanted to test whether combination therapies could be even more effective. Epalrestat is an oral drug that has been recently tested for the treatment of PMM2-CDG [20, 30]. As an aldose reductase inhibitor, it inhibits galactitol synthesis and directs all galactose into UDP-gal. On the other hand, manganese is an important cofactor for many glycosyltransferases, including β−1,3-N-acetylgalactosaminyltransferase, which catalyzes Gb4 synthesis from Gb3 [31].
None of the tested combination regimens consistently outperformed galactose alone across all patient samples (Fig. 5). In fact, the effectiveness of the combination therapies appeared to be dependent on the cell line. In CHO-Lec8 cells, supplemental addition of epalrestat to the medium had no effect on the relative abundances of LacCer and GM3 compared to galactose alone (Fig. 4). Hence, these results do not conclusively point at any combination therapy as more effective than galactose alone.
Fig. 5
Glycosphingolipid (GSL) analysis in SLC35A2-CDG fibroblasts after different treatments. Relative abundances of GlcCer, Gb3 and Gb4 in control (C1-C4, technical n = 3) and SLC35A2-CDG patient (P1-P4, technical n = 3) fibroblasts cultured in glucose (glc)-only medium, with galactose (gal) supplementation (Glc + Gal) or with combination therapies of galactose with epalrestat (Epal.), manganese (MnCl2), or both. Abundances are relative to controls on glucose. Graphs show the average of the most abundant GSL species (d18:1/16:0, d18:1/22:0, d18:1/24:0 and d18:1/24:1). Data are represented as the mean ± SD. *p ≤ 0.05; **p ≤ 0.01; ***p ≤ 0.001. GlcCer: Glucosylceramide
Glycosphingolipids are potential biomarkers for SLC35A2-CDGWe next investigated whether the altered GSL profiles observed in SLC35A2-CDG fibroblasts are also present in serum. We compared 11 SLC35A2-CDG patient serum samples (Table 2) and 13 age-matched controls (SLC35A2-CDG: 2 ± 3.31y; controls: 0.8 ± 5.09y (median ± SD (years))). GM3 and HexCer were the only GSLs above the serum detection limit for all the main species—(d18:1/16:0), (d18:1/22:0), (d18:1/24:0), and (d18:1/24:1)—in both hydroxylated and non-hydroxylated forms (the latter being less abundant). It is worth mentioning that hydroxylated GSLs were also present in fibroblasts, but many species were below the MS detection limit.
Table 2 Genetic characteristics of the individuals with SLC35A2-CDG whose serum was analyzedAnalysis of non-hydroxylated GM3, showed no differences between groups (Fig. S9). However, relative abundances of hydroxylated GM3 species were lower in the untreated patient group compared to controls (Fig. S9). Hydroxylated GM3/HexCer ratios were also significantly lower in SLC35A2-CDG serum samples (Fig. 6). Additionally, samples from two SLC35A2-CDG patients who had been treated orally with galactose (1 g/kg/day) or galactose + uridine (100 mg/kg/day) were analyzed (Table 2), and a trend towards increased GM3/HexCer ratios was observed for all species.
Fig. 6
Serum analysis in SLC35A2-CDG by LC-MS. GM3/HexCer ratios of untreated (PT) and treated with galactose (TR) SLC35A2-CDG patients compared to age-matched controls (CTRL). Treated samples are color coded (red or orange) to correlate them to the corresponding untreated sample. The orange square is the sample of the same patient represented with the orange circle after combination therapy of galactose and uridine. Ratios were calculated with the raw MS data normalized to the internal standard. Quantitative analysis of both HexCer and GM3 species can be found in Table S3. Data are represented as the mean ± SD. *p ≤ 0.05; **p ≤ 0.01; ***p ≤ 0.001. HexCer: Hexosylceramide
To further corroborate these findings, we performed a multivariate statistical analysis on all detected GSLs in the untreated serum samples (Supplementary material). In particular, the OPLS-DA model revealed good separation between the control and SLC35A2-CDG groups, with good predictability of group classification (Fig. S10). The corresponding loadings analysis highlighted that the main differentiating features contributing to the group separation were the hydroxylated GM3 species, thereby confirming their relevance as potential serum biomarkers for SLC35A2-CDG.
Comments (0)