Experimental animals
The Piezo1f/f mice (6–8 weeks old, female) with a C57BL/6 J genetic background were obtained from Shanghai Model Organisms Center, Inc., while the Cdh5-CreERT2 mice (6–8 weeks old, male) with a C57BL/6 J genetic background were purchased from Cyagen Biosciences Inc. Mice were housed in standard cages at the Model Animal Research Department of Xinhua Hospital, affiliated with Shanghai Jiao Tong University School of Medicine, under controlled environmental conditions: room temperature (22–25 °C), relative humidity (50–60%), a 12 h light/dark cycle, and ad libitum access to food and water. To induce conditional deletion of the Piezo1 gene in endothelial cells, Piezo1f/f mice were crossed with Cdh5-creERT2 mice to generate endothelial cell-specific Peizo1 knockout. Tamoxifen was dissolved in corn oil at 20 mg/mL, and mice were intraperitoneally injected with 75 mg/kg of tamoxifen for 5 consecutive days. The tamoxifen-treated Cdh5 Piezo1 knockout mice were referred to as Piezo1ECKO mice, and the littermates treated with tamoxifen but lacking the Cdh5-creERT2 were used as controls. For experiments, mice were males aged 6–8 weeks. Genotyping was performed by PCR analysis of genomic DNA extracted from tail tissue. Specific primers used for identification are as follows: Piezo1 floxed (forward: 5’-CCTTGCCCTTGTACCTGTGC-3’, reverse: 5’-CCTGGCTGGAAAATGGAAGAT-3’); Cdh5-CreERT2 (forward: 5’ GTCCTGATGGTGCCTATCCTCTTTC-3’, reverse: 5’-AATCGCGAACATCTTCAGGTTCTG-3’).
RNA extraction and quantitative reverse transcription PCR (RT-qPCR)
Total RNA was isolated from cells using TRIzol reagent (Takara, Japan). RNA purity and concentration were assessed Nanodrop spectrophotometrically, followed by cDNA synthesis using PrimeScript™ RT reagent Kit (Takara, Japan). RT-qPCR was conducted on a Q3 real-time thermal cycler with SYBR Green Master Mix (Yeason, China). The relative transcript levels of target genes were quantified via the 2−ΔΔCt method, with β-actin serving as the endogenous reference for normalization. Primer sequences for target genes are provided in Table S1.
Transient middle cerebral artery occlusion (tMCAO) model
The I/R model was established following previously described methods [27]. Mice were anesthetized with 5% isoflurane, and anesthesia was maintained at 2% during the surgery. Body temperature was kept at 37 °C ± 0.5 °C using a heating pad. A midline incision was made to expose the left external carotid artery, and a silicone-coated suture was inserted into the right internal carotid artery and advanced to the left middle cerebral artery to induce 60 min of ischemia. Mice in the Sham group underwent the same procedure, except no silicone-coated suture was inserted to occlude the artery.
Assessment of infarct volume
The brain was rapidly removed and placed in ice-cold PBS for sectioning. Coronal brain sections, 1 mm thick, were prepared and incubated in a 2% TTC (Biosharp, China) at 37 °C in the dark for 15 min. The infarct area was measured using Image J software.
Evans blue administration and quantification
Evans blue extravasation was utilized to BBB integrity. 4% Evans blue solution (2 mL/kg) was injected via the tail vein, and after 1 h, the brains were homogenized in 1 mL of 50% trichloroacetic acid. The samples were incubated at 4 °C for 24 h, followed by centrifugation at 14000 g for 30 min. The resulting supernatant was then collected and mixed with absolute ethanol in a 1:3 ratio. and the absorbance was measured using a spectrophotometer at 620 nm [28].
Brain water content measurement
The fresh ischemic brain tissue was initially weighed to determine the wet weight. The tissue was then placed in a 60 °C oven for continuous drying for 72 h to obtain the dry weight. Finally, the brain water content was calculated using the following formula: (wet weight—dry weight)/wet weight × 100%.
Neurological deficit evaluation
The Zea-Longa score was performed to evaluate the neurological deficits in tMCAO mice[29]. The scoring system consists of a 5-point scale, with higher scores indicating more severe neurological deficits. The evaluation was conducted by a researcher blinded to the experimental groups before tMCAO and at 1, 2, 3, 5, and 7 days after tMCAO.
Corner turning test
Corner turning tests were performed using a 30-degree angle formed by two cardboard pieces (30 × 20 × 1 cm) to assess sensorimotor abnormalities. Mice were placed between the two boards, with their heads facing the corner. The animals naturally progressed forward until reaching the intersection of the panels, at which point they were forced to turn either left or right. An inter-trial interval of 30 s was implemented between trials to minimize habituation and prevent the development of adverse conditioned responses to the testing apparatus.
Laser speckle contrast imaging (LSCI)
Cerebral cortical blood flow was measured using a laser Speckle Contrast Imaging System (moorFLPI-2, Moor Instruments Inc., Wilmington) at three distinct time points: 5 min prior to tMCAO, during tMCAO, and 24 h after tMCAO. Results were expressed as the perfusion ratio between the ischemic and contralateral non-ischemic cortical regions.
Hematoxylin–eosin (H&E) staining
The tissue morphological evaluation was performed using H&E staining for histological analysis. Following 24 h of reperfusion after tMCAO, mice were euthanized and transcardially perfused with saline until the effluent from the right atrium was clear of blood. Brain tissue was then extracted and fixed in 2% formaldehyde solution for 2 days. The 3 µm brain sections were deparaffinized in xylene, rehydrated in an ethanol gradient (100% to 70%), and stained with H&E according to standard protocols. Following H&E staining, three randomly selected microscopic fields in cortex on each of three consecutive sections were analyzed for each brain by a blinded investigator.
Cell culture and OGD/R model in vitro BBB model
bEnd.3 were cultured in DMEM supplemented with 10% fetal bovine serum, 100 U/ml penicillin, and 100 U/ml streptomycin, and cultured at 37 °C in a 5% CO2 and 95% air incubator. The bEnd.3 cells grown to 100% confluence were digested using EDTA-trypsin, and then seeded onto microporous membrane to construct the in vitro BBB model. To establish the OGD/R model, bEnd.3 cells were cultured in glucose-free DMEM and placed in a specialized incubator with 94% N2, 5% CO2, and 1% O2 at 37 °C. After 6 h, the bEnd.3 cells were transferred from the hypoxic chamber to a regular incubator, and the medium was replaced with standard culture medium for reperfusion injury.
Detection of intracellular ROS, mitochondrial superoxide levels and mitochondrial membrane potential
To assess ROS levels in murine brain tissues and bEnd.3 cells, the DCFH-DA method was employed (Elabscience, Cat# E-BC-K138-F, China). The DCF fluorescence was quantified using a fluorescence microplate reader (BioTek, USA) with an excitation wavelength of 500 nm and an emission wavelength of 525 nm. The levels of ROS in bEnd.3 cells and mitochondria ROS were measured using the Reactive Oxygen Species Assay Kit (Beyotime, Cat# S0033S, China) and the Mitochondrial Superoxide Assay Kit (Beyotime, Cat# S0061S, China), respectively. Cellular imaging was performed using a fluorescence microscope.
Mitochondrial JC-1 monomers or aggregates were measured using fluorescence microscopy. When the mitochondrial membrane potential is high, JC-1 forms aggregates that emit red fluorescence. In contrast, at lower membrane potentials, JC-1 exists as monomers, emitting green fluorescence (Beyotime, Cat#C2005, China). The changes in the red-to-green fluorescence ratio provide an assessment of the mitochondrial membrane potential status.
Intracellular calcium level
We employed the Fluo-4 calcium ion detection kit (Beyotime, Cat# S1061S, China), with Fluo-4 being a highly sensitive fluorescent probe that specifically binds to intracellular free calcium ions. Fluo-4 staining solution was prepared according to the manufacturer's instructions and incubated at 37 °C for 30 min in the dark. After three washes with HBSS, the staining was observed under a fluorescence microscope.
Western blot analysis
Proteins were extracted from the brain cortex tissue and bEnd.3 cells following a standard procedure[30]. The primary antibodies utilized in this study included β-actin (ABclonal, Cat#AC026, China), Lamin B1 (proteintech, Cat#12987–1-AP, China), Piezo1 (proteintech, Cat#15939–1-AP, China), ZO-1(proteintech, Cat#21773–1-AP, China), Occludin (Abcam, Cat#ab216327, China), p-CaMKII (Abcam, Cat#ab124880, UK), CaMKII (Abcam, Cat#AB52476, UK),NQO-1 (HUABIO, Cat#ER1802-85, China),HO-1 (HUABIO, Cat#ER1802-73, China), and Nrf2 (proteintech, Cat#16396–1-AP, China). The following secondary antibodies were used: HRP-conjugated Goat anti-Rabbit IgG (H + L) (ABclonal, Cat#AS014, China) and HRP-conjugated Goat anti-Mouse IgG (H + L) (ABclonal, Cat#AS003, China).
Immunofluorescence (IF) staining
The IF staining was carried out as we previously reported [31]. After anesthetizing the mice, brains were perfused and fixed in 4% paraformaldehyde at 4 °C for 24 h. The brain tissue was then immersed in 30% sucrose solution for dehydration. Coronal brain sections were cut at 5 μm thickness using a frozen microtome. After washing with PBS three times, primary antibodies against Piezo1 (Proteintech, Cat#15939–1-AP, China), CD31 (R&D, Cat#AF3628, USA), Iba-1 (Abcam, Cat#ab289874, UK), GFAP (Abcam, Cat#ab302644, UK), ZO-1 (Proteintech, Cat#21773–1-AP, China), and Occludin (Abcam, Cat#ab216327, China) were applied overnight at 4 °C. Following three PBS washes, corresponding secondary antibodies were added and incubated at room teperature for 1 h in the dark. Finally, sections were mounted with DAPI (Beyotime, Cat#P0131, China) and imaged using a fluorescence microscope. Three randomly selected microscopic fields in cortex on each of three consecutive sections were analyzed for each brain by a blinded investigator.
Oxidative stress‑level assays
Brain tissue from the ischemic penumbra and bEnd.3 cells were collected, and protein concentrations were determined using the BCA Protein Assay Kit (Beyotime, Cat# P0012, China). The samples were then used for oxidative stress‑level analysis, including measurements of malondialdehyde (MDA) (Elabscience, Cat#E-BC-F007, China), glutathione peroxidase (GSH-Px) (Elabscience, Cat#E-BC-K096-M, China), glutathione (GSH) (Elabscience, Cat#E-BC-K030-M, China), and superoxide dismutase (SOD) (Elabscience, Cat#E-BC-K019-M, China), following the manufacturer’s instructions.
Inflammatory cytokine-level assays
The protein concentrations of bEnd.3 cells and the ischemic penumbra region of mouse cerebral cortex were determined using a BCA protein assay kit (Beyotime, Cat# P0012, China). The levels of inflammatory cytokines, including tumor necrosis factor Alpha (TNF-α) (Elabscience, Cat# E-EL-M3063, China), interleukin-6 (IL-6) (Elabscience, Cat# E-EL-M0044, China), interleukin-10 (IL-10) (Elabscience, Cat# E-EL-M0046, China), and interleukin-1β (IL-1β) (Elabscience, Cat# E-EL-M0037, China), were quantified by ELISA following the manufacturer’s protocol. Absorbance at 450 nm was measured using a microplate reader.
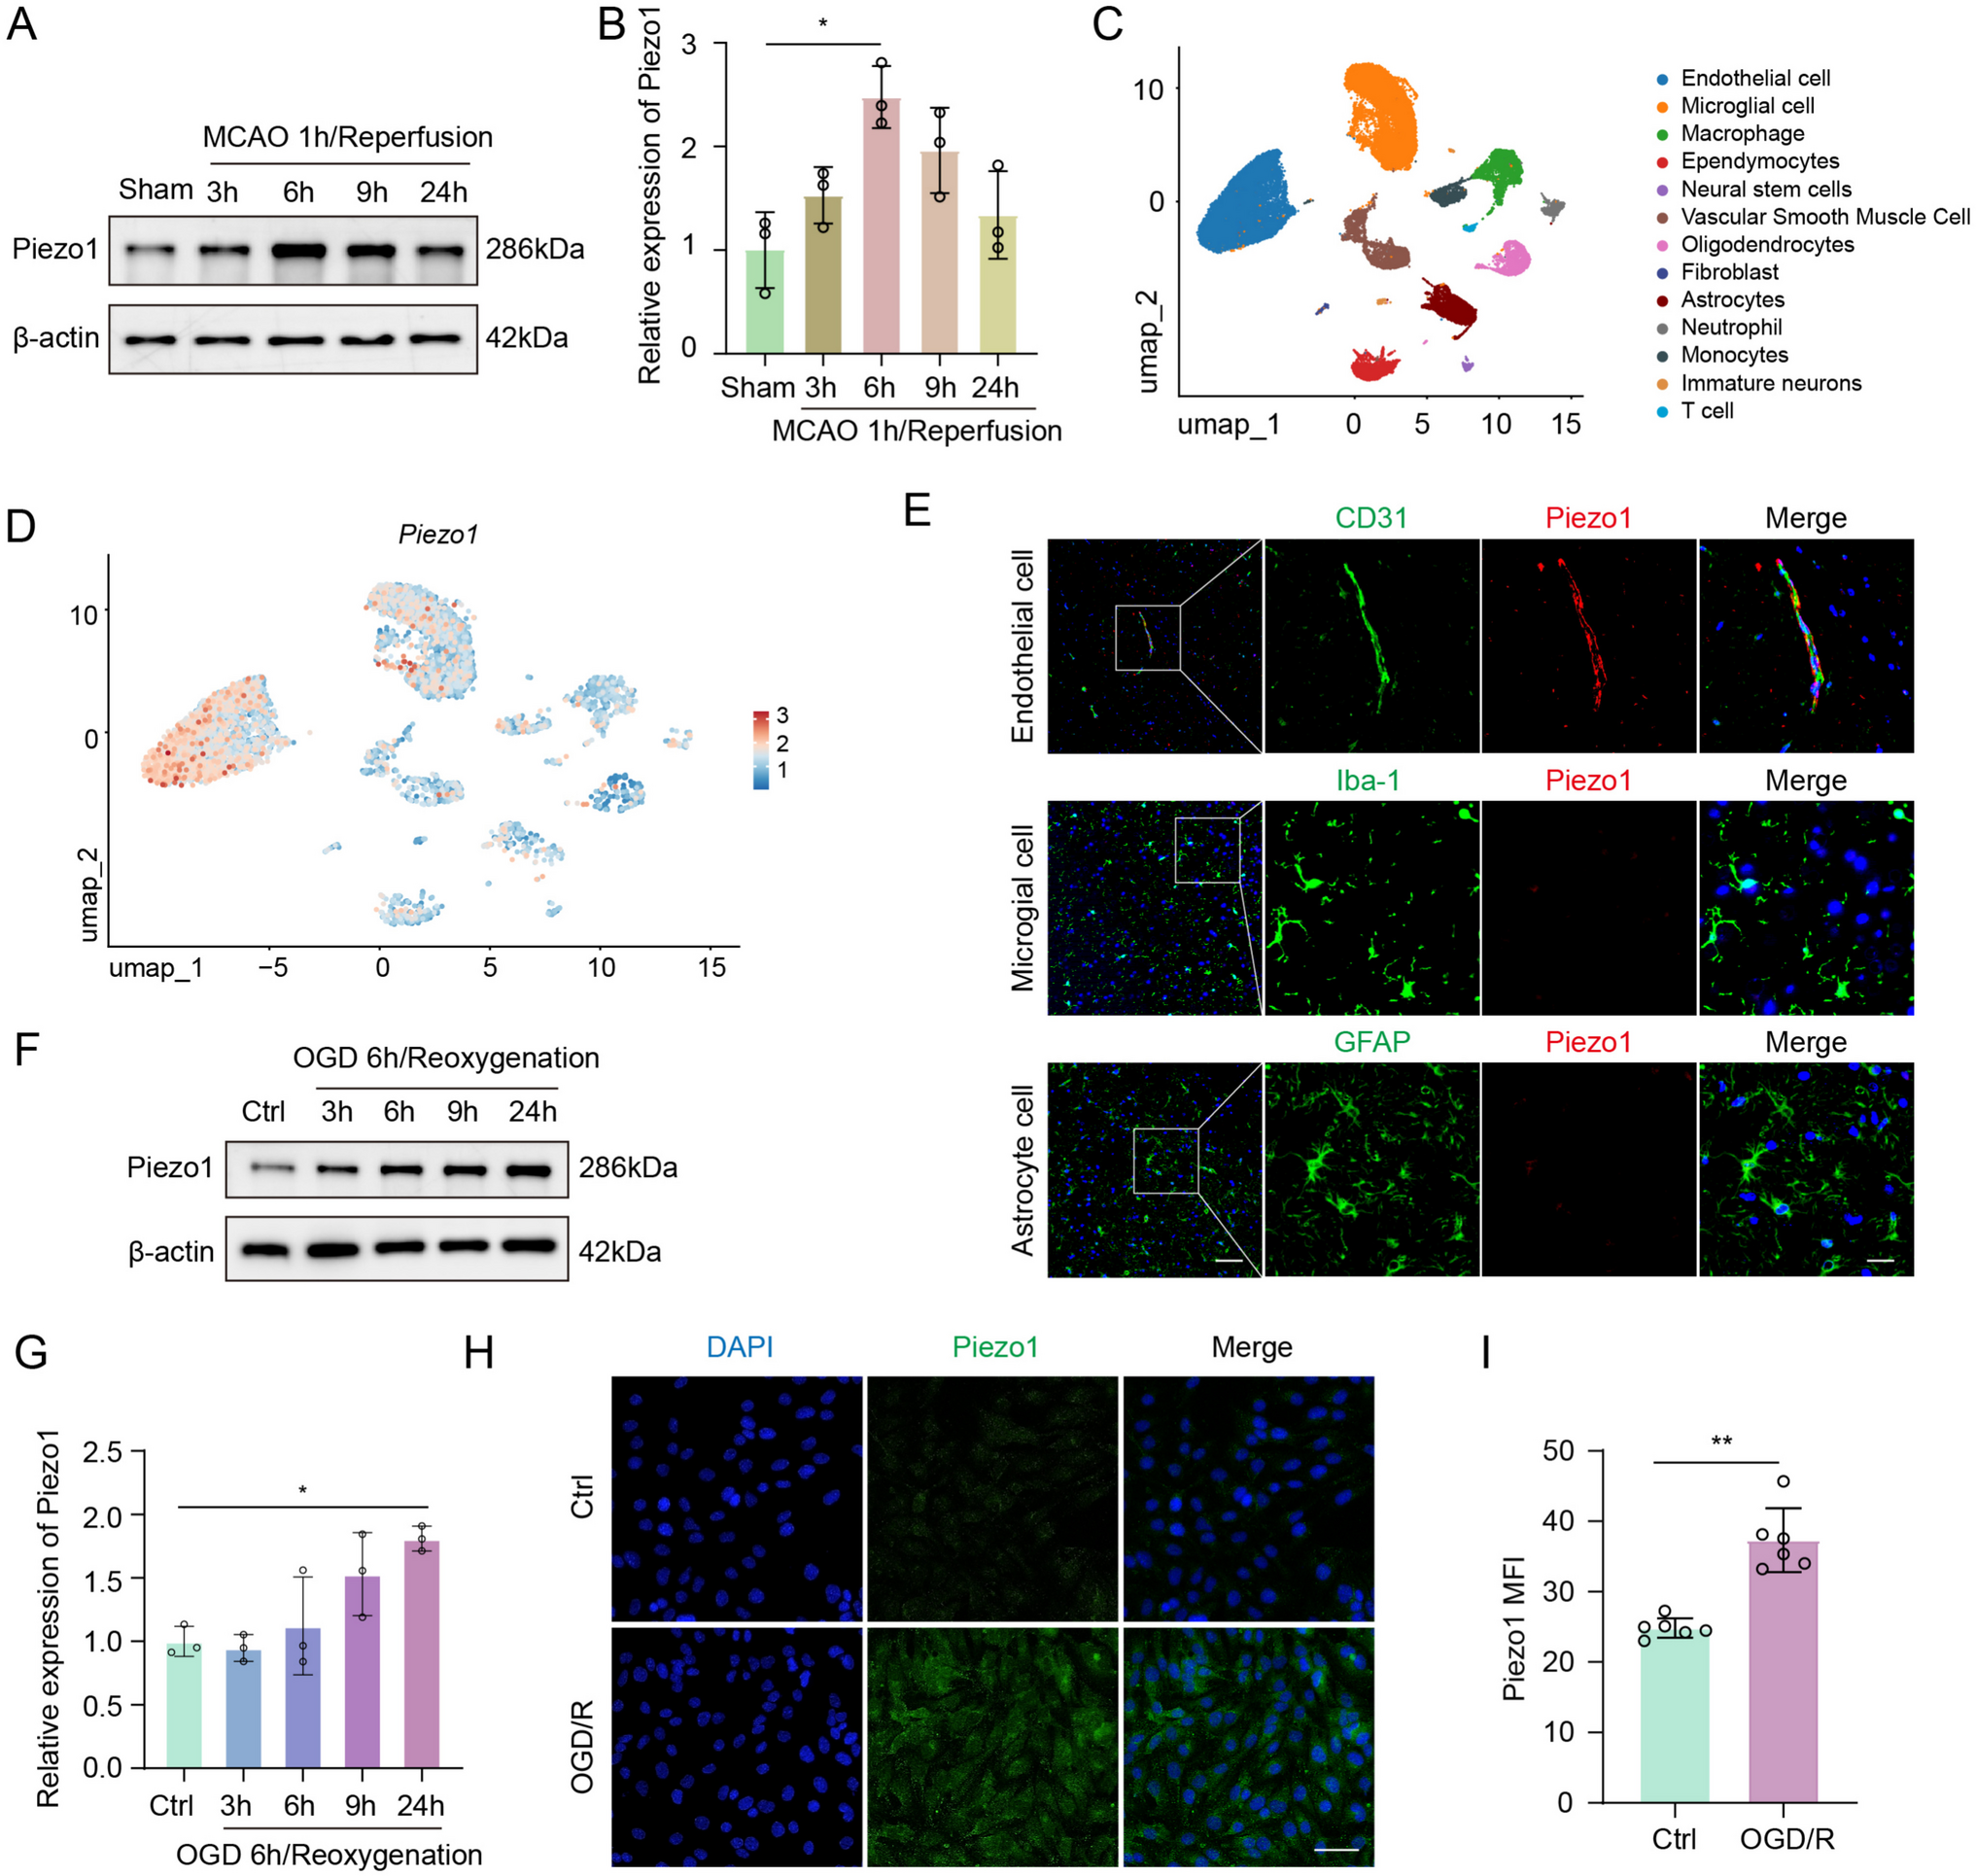
The single-cell RNA sequencing (scRNA-seq) data processing and analysis of mouse brain tissues post-tMCAO
scRNA-seq data analyzed in this study, which represent mouse brain tissues at 24 h post-MCAO, were obtained from publicly available datasets in the GEO database (accession numbers: GSM5319990, GSM5319991, GSM5319992, and GSM7841723) [32, 33]. The combined datasets initially included a total of 41843 cells. Rigorous quality control was performed to filter the cells, selecting those with 200–6000 unique genes expressed, fewer than 30,000 total RNA counts, less than 10% mitochondrial gene expression, and hemoglobin gene expression below 1%. Following quality control, 39921 cells were retained for further analysis. Subsequent data processing and analysis were conducted using Seurat (v5.0.3) [34]. To mitigate batch effects, the Harmony algorithm was integrated into the analysis pipeline [35]. Initial cell clustering was performed using Uniform Manifold Approximation and Projection (UMAP) with dimensions set from 1 to 18 and a resolution of 0.1. Finally, we evaluated the differential expression of Piezo1 across distinct cell clusters within the single-cell dataset.
Statistical analysis
All statistical analyses and data visualization were performed using GraphPad Prism software (version 8.0). Continuous variables are presented as mean ± standard deviation (SD). Data normality was assessed using the Shapiro–Wilk test, and homogeneity of variance was evaluated using Levene's test. Statistical methods for group comparisons were selected based on data distribution characteristics. When data met both normality and homogeneity of variance assumptions, independent samples t-test was used for two-group comparisons, and one-way ANOVA followed by Tukey's HSD post hoc test was applied for multiple group comparisons. When data met normality but not homogeneity of variance assumptions, Welch's t-test was used for two-group comparisons, and one-way ANOVA followed by Games-Howell post hoc test was applied for multiple group comparisons. When data did not meet normality assumptions, the Mann–Whitney U test was used for two-group comparisons, and the Kruskal–Wallis test followed by Dunn's multiple comparisons test was applied for multiple group comparisons. For survival analysis, Kaplan–Meier curves were generated and compared using the log-rank test. A two-tailed p < 0.05 was considered statistically significant in all analyses.


Comments (0)