
Remember me
The behavioral tests were performed during ketamine administration (Fig. 1A). The OFT typical path diagrams are shown in Fig. 1B. As the number of days increased, the total distance and the number of times crossed the central zone of mice in ketamine group decreased, while the latency to reach the central zone decreased (Fig. 1C, E, F). On 7th day, both total distance and number of times crossed the central zone of mice in ketamine group and DRD1 antagonist group increased significantly compared to the saline group and the latency to reach the central zone decreased significantly (Fig. 1D, G and H). The total distance in the DRD1 antagonist group decreased significantly compared to that in saline group as they barely entered the central zone (Fig. 1D-F). Also, mice in DRD1 antagonist + KET group had significant differences in total distance and number of times crossed the central zone compared to mice in the ketamine group (Fig. 1D, E and H). In contrast, the total distance in the DRD1 antagonist + KET group decreased significantly (Fig. 1C and D).
Fig. 1
Repeated ketamine exposure induces anxiety-like and depression-like behaviors, as well as cognitive impairment. A. Experimental timeline illustrating the schedule of drug administration (daily i.p. injection of NC, Ketamine, SKF38393, SCH23390, SKF38393 + Ketamine or SCH23390 + Ketamine for 7 days) and behavioral tests. B. Representative movement tracings in the open field test on day 7. C. Total distance traveled (cm) in the open field test over seven consecutive days. D. Comparison of the total distance traveled (cm) in the open field test on day 7. E. The number of central zone crossings in the open field test over seven consecutive days. F. Latency of the first entrance to the central zone in the open field test over seven consecutive days. G. Comparison of the latency of mice’s first entrance to the central zone in the open field test on day 7. (The mice in the SCH23390 group did not reach the central area; thus, statistical analysis of latency measures for this group was precluded.). H. Comparison of the number of crossing the central area in the open field test on day 7. I. Representative search paths in the Barnes maze test on day 7. J. Comparison of the escape latency in the Barnes maze test on day 7. K. Escape latency in the Barnes maze test over seven consecutive days. L. Comparison of the immobility duration in the forced swim test on day 7. Data were presented as mean ± SD (n = 6 mice/group) (*p < 0.05; **p < 0.01; ***p < 0.001). Detailed statistical results were provided in Supplementary Table 2
Collectively, we found that both ketamine and DRD1 antagonists produced behaviors of increased excitability and more voluntary activity in mice, whereas DRD1 antagonists lowered excitability. DRD1 antagonists and ketamine also exerted a synergistic effect on anxiety-like behavior of mice, and DRD1 antagonists decreased the effects of ketamine.
The typical path diagrams of Barnes maze test for all six groups are shown in Fig. 1I. All six groups of mice show a decrease in time to find the target hole over 7 days (Fig. 1K). After 7 days of treatment, escape latency of mice was much higher in ketamine group and DRD1 antagonist group than in saline group (Fig. 1J) than in DRD1 antagonist group and saline group (Fig. 1J), and no significant differences were observed between DRD1 antagonist group and saline group (Fig. 1J). After 7 days combined treatment with the ketamine group, escape latency of mice in DRD1 agonist + KET group was significantly lower than after 7 days of combined treatment (Fig. 1J), and escape latency differences were not significant in DRD1 antagonist + KET group (Fig. 1J).
Clearly, both ketamine and DRD1 antagonists can impair memory and cognitive function in mice, while DRD1 agonists exhibit therapeutic effects against the memory and cognitive deficits induced by ketamine.
In forced swimming test, mice of the ketamine group and DRD1 antagonist group had higher durations of immobility in water than mice of the saline group (Fig. 1L), no difference in duration of immobility in water between DRD1 antagonist group and saline group occurred. After 7 days combined drug administration, DRD1 antagonist + KET group had significantly longer duration than the ketamine group, and DRD1 antagonist + KET group had no difference in duration (Fig. 1L).
The results of forced swimming test demonstrate that 7-day consecutive administration of either ketamine or DRD1 antagonists induced significant depressive-like behaviors in mice. Furthermore, DRD1 antagonists and ketamine exhibited a synergistic effect in promoting depressive-like behaviors, while DRD1 agonists show no significant impact on the depressive state of mice in the ketamine group.
RNA-seq revealed PI3K-AKT signaling pathway and apoptosis in transcriptome levelAs genetic factors involved in mental disorders, anxiety, depression and SZ, we studied the transcriptomes of SZ patients and ketamine-treated mice for covariance genes (Tao et al. 2024). RNA-seq of peripheral blood of SZ patients showed that apoptosis was important process and PI3K-AKT and mTOR are dominant processes (Fig. 2A-B).
Fig. 2
Transcriptome profiles by RNA-seq. A. Volcano plots of differentially expressed genes in peripheral blood of SZ patients. B. KEGG pathway enrichment analysis of differentially expressed genes in peripheral blood of SZ patients. C. Volcano plots of differentially expressed genes in the mice PFC across three comparison groups (NC vs KET, KET vs SKF, and KET vs SCH + KET groups). D. KEGG enrichment bubble chart of differentially expressed genes in the mice PFC across three comparison groups (NC vs KET, KET vs SKF, and KET vs SCH + KET groups). E. KEGG enrichment network of PFC differentially expressed genes in NC vs. KET groups
Furthermore, we identified DEGs using mice PFC tissues through pairwise comparisons among the following four groups: saline group (NC), ketamine group (KET), DRD1 agonist group (SKF), and DRD1 antagonist + ketamine group (SCH + KET). The number of DEGs was statistically analyzed and visualized using volcano plots to display their expression levels (Fig. 2C). KEGG pathway analysis was performed to annotate and classify the DEGs. Enrichment analysis of DEGs from three comparative groups revealed significant alterations in the PI3K-Akt signaling pathway across all comparisons (Fig. 2D). Notably, in the comparison of saline group and ketamine group, the PI3K-Akt signaling pathway ranked among the top five in the KEGG enrichment analysis of the DEGs (Fig. 2E).
Collectively, RNA-seq revealed the involvement of PI3K-AKT signaling pathway and apoptosis in SZ and ketamine-induced mice model.
Ketamine facilitates the apoptosis of HT22 cells by downregulating Akt and Gsk-3β phosphorylation and upregulating Bax and cleaved-caspase-3 protein expression via DRD1The effects of ketamine on cell apoptosis are further investigated in vitro. HT22 cells were incubated with ketamine for 24 h at concentrations of 0 M, 10 M, 20 M, 50 M, 100 M, 200 M, 500 M and 1000 M and flow cytometry for cell apoptosis. Concentrations-dependent cell apoptosis was observed, 100 M and 200 M cells exhibited a significant number of cells with significant apoptosis at concentrations of 100 M and more than 30% apoptotic cells at concentrations of 200 M, dose–response up to 1000 M (Fig. 3A, B and D). We used the 200 M concentration of ketamine for subsequent experiments.
Fig. 3
Apoptosis analysis in HT22 cell after drug treatment. A. Apoptosis detection following 0–1000 μM gradient ketamine treatment for 24 h by flow cytometry. B. Analysis of fluorescence intensity distributions after 200 μM ketamine by flow cytometry. C. Apoptosis assay after different drug treatments by flow cytometry. D. Apoptosis assay after ketamine and other drug treatments by TUNEL staining. E. Statistical results of apoptosis in HT22 cells treated with 0–1000 μM gradient concentrations of ketamine. F. Statistical results of apoptosis in HT22 cells treated with different drugs. G. Statistical results of TUNEL staining in HT22 cells after different drug treatments. Data were presented as mean ± SD (n = 8 mice/group) (*p < 0.05; **p < 0.01; ***p < 0.001). Detailed statistical results were provided in Supplementary Table 2
Moreover, whether DRD1 was involved in the apoptosis induced by ketamine was evaluated by flow cytometry and TUNEL staining in HT22 cells following 24-h drug treatments. Compared with saline-treated control, both ketamine and DRD1 agonist treatments significantly increased HT22 cell apoptosis, while DRD1 antagonist and apoptosis inhibitor treatments showed no significant effects. Moreover, combined DRD1 agonist plus ketamine treatment further enhanced apoptosis, whereas DRD1 antagonist plus ketamine or apoptosis inhibitor plus ketamine co-treatments partially reduced the pro-apoptotic effects observed with ketamine alone (Fig. 3C-D, F, and G). The results demonstrated that DRD1 agonist potentiated ketamine-induced apoptosis, while both the DRD1 antagonist and apoptosis inhibitor exhibited a partial protective effect on the cell apoptosis induced by ketamine. Clearly, DRD1 was involved in the ketamine-induced apoptosis.
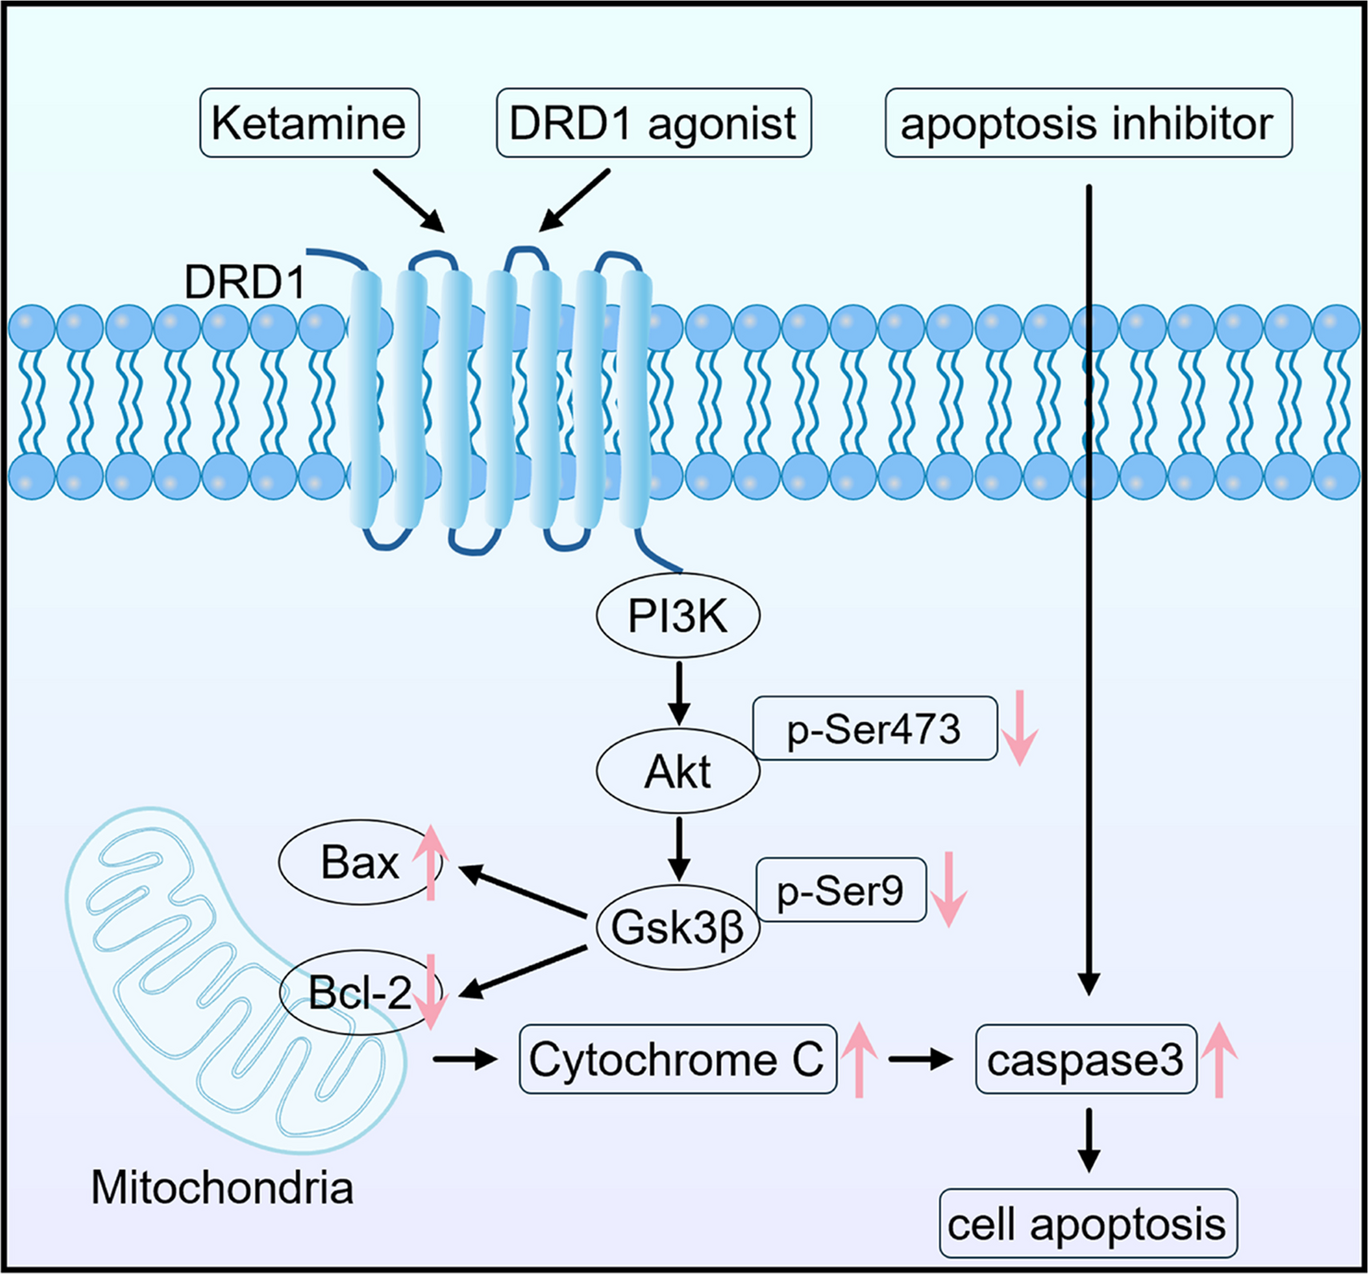
Additionally, western blot analysis was performed to detect the expression levels of proteins associated with the apoptosis pathway in HT22 cells (Fig. S1). The results demonstrated that, compared with the control group, both the ketamine and DRD1 agonist groups showed decreased levels of P-Akt, P-Gsk-3β, and Bcl-2, along with increased Bax and cleaved-caspase-3 expression. When compared with the ketamine group, the DRD1 agonist + ketamine group exhibited a further decrease in the levels of P-Akt, P-Gsk-3β, and Bcl-2, along with an increase in the levels of Bax and Cleaved-caspase-3. In contrast, in the DRD1 antagonist + ketamine group and the apoptosis inhibitor + ketamine group, the expression of P-Akt, P-Gsk-3β, and Bcl-2 were elevated, while the levels of Bax and Cleaved-caspas-3 were reduced. The results showed that both ketamine and DRD1 agonists downregulated Akt and Gsk-3β phosphorylation while upregulating pro-apoptotic protein expression, with synergistic promotion of apoptosis. Conversely, DRD1 antagonists and apoptosis inhibitors partially attenuated the ketamine-induced reductions in Akt/Gsk-3β phosphorylation and activation apoptotic signaling.
Collectively, Ketamine facilitates the apoptosis of HT22 cells in a dose-dependent manner via DRD1 by downregulating Akt and Gsk-3β phosphorylation and upregulating Bax and cleaved-caspase-3 protein expression.
Ketamine promoted neuronal apoptosis in both the PFC and hippocampus of mice, while DRD1 antagonist partially attenuated ketamine-induced apoptosisBased on the results of RNA-seq and in vitro, the expression levels of PI3K-Akt and other apoptosis-related pathway proteins were measured on day 8 post- administration in four groups (NC, KET, SKF383393, and SCH23390 + KET).
Western blot assay demonstrated that in both the PFC and hippocampus, ketamine-treated and DRD1 agonist-treated mice showed similar alterations in apoptosis-related proteins compared to saline group, characterized by decreased P-Akt, P-Gsk-3β, and Bcl-2 levels along with increased Bax and cleaved-caspase-3 expression. In contrast, DRD1 antagonist + ketamine group reversed these changes, exhibiting increased P-Akt, P-Gsk-3β, and Bcl-2 with decreased Bax and cleaved-caspase-3 levels compared to the ketamine group (Fig. 4A-B and E-F). The results demonstrated that both ketamine and DRD1 agonists promoted apoptotic signaling in the mouse PFC and hippocampus, while DRD1 antagonism ameliorated ketamine-induced increases apoptosis.
Fig. 4
Relative protein expression and immunofluorescence staining in the mice PFC and hippocampus. after drug administration. A. Representative western blot images of P-Akt, Akt, P-Gsk-3β, Gsk-3β, Bcl-2, Bax, Pro-caspas-3, and Cleaved-caspas-3 proteins in the PFC. B. Quantitative analysis of P-Akt, Akt, P-Gsk-3β, Gsk-3β, Bcl-2, Bax, Pro-caspas-3, and Cleaved-caspas-3 protein expression levels in the PFC. C. Immunofluorescence co-staining of NeuN and P-Akt in the PFC. D. Quantitative analysis of neuronal P-Akt expression levels in the PFC. E. Representative western blot images of P-Akt, Akt, P-Gsk-3β, Gsk-3β, Bcl-2, Bax, Pro-caspas-3, and Cleaved-caspas-3proteins in the hippocampus. F. Quantitative analysis of P-Akt, Akt, P-Gsk-3β, Gsk-3β, Bcl-2, Bax, Pro-caspas-3, and Cleaved-caspas-3protein expression levels in the hippocampus. G. Immunofluorescence co-staining of NeuN and P-Akt in the hippocampus. H. Quantitative analysis of neuronal P-Akt expression levels in the hippocampus. Data were presented as mean ± SD (n = 4 mice/group) (*p < 0.05; **p < 0.01; ***p < 0.001). Detailed statistical results were provided in Supplementary Table 2
Furthermore, the distributions of P-Akt, P-Gsk3β, and Bax in neuron, astrocyte, and microglia were detected using the cell makers (NeuN, GFAP, and Iba1) in mice. The immunofluorescence staining found that the majority of P-Akt and P-Gsk3β were colocalized with the neuronal marker NeuN (Fig. 4C, G, Fig. S2A, and Fig. S2B). Meanwhile, a portion of the Bax was co-localized with NeuN (Fig. S3A and Fig. S3B). Compared with saline group, ketamine group and DRD1 agonist group mice exhibited reduced colocalization of P-Akt and P-Gsk3β with NeuN (Fig. 4C-D, G-H, Fig. S2A-2B, and Fig. S2C-2D), along with increased neuronal Bax expression (Fig. S3A-3B and Fig. S3C-3D) in the PFC and hippocampus, respectively. For DRD1 antagonist + ketamine group, DRD1 antagonist reversed these changes induced by ketamine, exhibiting increased P-Akt and P-Gsk-3β level and decreased Bax level compared to KET group (Fig. 4C-D, G-H, Fig. S2A-2B, Fig. S2C-2D, Fig. S3A-3B, and Fig. S3C-3D). The above results demonstrated that ketamine and DRD1 agonists induced neuronal apoptosis in both the PFC and hippocampus of mice, while DRD1 antagonists partially attenuated ketamine-induced apoptotic.
Immunofluorescence co-staining of astrocyte marker GFAP and apoptosis-pathway signal molecule Bax in the PFC among four groups revealed minimal astrocytic presence, with no observable colocalization between Bax and GFAP (Fig. S4A). These findings indicated ketamine treatment does not enhance apoptotic signaling of astrocyte in the PFC of mice. In the hippocampal regions, Bax demonstrated significant colocalization with astrocyte marker GFAP, with ketamine group and DRD1 agonist group exhibiting increased Bax+-GFAP+ colocalization compared to saline group (Fig. S4B). The DRD1 antagonist + ketamine group exhibited the reduced Bax+-GFAP+ colocalization compared to ketamine group (Fig. S4C). However, the minimal colocalization was observed between GFAP and either P-Akt or P-Gsk-3β (Fig. S5A and Fig. S5B). These results indicated that both ketamine and DRD1 agonists promote astrocytes apoptosis in the hippocampus, while DRD1 antagonism attenuates ketamine's pro-apoptotic effect.
Additionally, immunofluorescence co-staining of Iba1 with P-Akt and Bax in hippocampus showed that while ketamine treatments altered overall apoptotic signaling in the hippocampus, these changes were not observed in Iba1+ microglial populations (Fig. S5C and Fig. S5D).
Targeted knockout of neuronal DRD1 receptors exacerbated ketamine-induced anxiety, cognitive impairment, and depressive-like behaviorsIn open field experiments, total distance and number of times crossing central area are compared between WT-NC and cKO-NC mice. Neuronal DRD1 knockout reduces total distance of mice, but the number of times crossing central area is not significantly different (Fig. 5A, B, E). On 7th day, when comparing WT-KET and cKO-KET mice knockout of DRD1 receptor increases total distance and number of times crossing central area mice after ketamine (Fig. 5C-D), the number of times crossing central area and number of times crossing central area of mice are significantly different after ketamine. The results show that cKO-KET mice hyperactivity and possibly anxiolytic or impulsive behavior. Neuronal DRD1 knockout decreases excitability in the untreated condition, while ketamine induces anxiety-like behavior under ketamine stimulation.
Fig. 5
Behavioral results, western blot results and immunofluorescence co-staining in Emx1-cre±; DRD1.flox/flox mice. A. Representative movement tracings in the open field test on day 7. B. Total distance traveled (cm) in the open field test over seven consecutive days. C. Comparison of the total distance traveled (cm) in the open field test on day 7. D. Comparison of the number crossing the central area in the open field test on day 7. E. The number of central zone crossings in the open field test over seven consecutive days. F. Representative search paths in the Barnes maze test on day 7. G. Comparison of the escape latency in the Barnes maze test on day 7. H. Comparison of the immobility duration in the forced swim test on day 7. I. Representative western blot images of P-Akt, Akt, P-Gsk-3β, Gsk-3β, Bcl-2, Bax, Pro-caspas-3, and Cleaved-caspas-3 proteins in the PFC. J. Quantitative analysis of P-Akt, Akt, P-Gsk-3β, Gsk-3β, Bcl-2, Bax, Pro-caspas-3, and Cleaved-caspas-3 protein expression levels in the PFC. K. Immunofluorescence co-staining of NeuN and P-Akt in the PFC. L. Quantitative analysis of the fluorescence co-localization of NeuN and P-Akt in the PFC. M. Western blot results of P-Akt, Akt, P-Gsk-3β, Gsk-3β, Bcl-2, Bax, Pro-caspas-3, and Cleaved-caspas-3 proteins in the hippocampus. N. Immunofluorescence co-staining of NeuN and P-Akt in the hippocampus. O. Quantitative analysis of the fluorescence co-localization results of NeuN and P-Akt in the hippocampus. P. Quantitative analysis of P-Akt, Akt, P-Gsk-3β, Gsk-3β, Bcl-2, Bax, Pro-caspas-3, and Cleaved-caspas-3 protein expression levels in the hippocampus. Data were presented as mean ± SD (n = 4 mice/group) (*p < 0.05; **p < 0.01; ***p < 0.001). Detailed statistical results were provided in Supplementary Table 2
In the Barnes maze test, no significant difference in escape latency was observed between WT-NC and cKO-NC groups. However, cKO-KET group exhibited significantly increased escape latency compared to WT-KET group (Fig. 5F-G). The results demonstrated that neuronal DRD1 knockout did not impact the cognitive and memory capabilities, but significantly exacerbated ketamine-induced cognitive impairment induced by ketamine.
In the forced swimming test, there was no significant difference of immobility time between the cKO-NC group and WT-NC group, while the cKO-KET group exhibited significantly immobility than the WT-KET group (Fig. 5H). The results demonstrated that neuronal DRD1 knockout significantly exacerbated ketamine-induced depressive behavior.
Collectively, neuronal DRD1 deletion exacerbates mental and cognitive fluctuations in mice during resting state and ketamine treatment. It suggests that DRD1 acts as a stabilizer and moderates the stimulatory effects of ketamine.
Neuronal DRD1 knockout exacerbated ketamine-induced neuronal apoptosisWestern blot analysis of apoptosis-related proteins in the PFC and hippocampus of mice among the four groups revealed no significant differences in total Akt, Gsk3β, or pro-caspase3 expression across groups (Fig. 5I-J, M and P). When compared with the WT-NC group, the expression levels of proteins associated with the apoptotic pathway in the cKO-NC group did not exhibit significant alterations. Compared to WT-NC group, WT-KET mice showed decreased P-Akt, P-Gsk3β, and Bcl-2 expression with increased Bax and cleaved-caspase3 levels. The cKO-KET group exhibited significant decreasing in P-Akt, P-Gsk3β, and Bcl-2 and increasing in Bax and cleaved-caspase3 relative to WT-KET mice (Fig. 5I-J, M and P). However, the difference in P-Akt expression between WT-KET and cKO-KET groups has a P-value of 0.050. This may be the statistical fluctuations due to small sample size (Cao et al. 2024). The results demonstrated that neuronal DRD1 knockout did not significantly alter apoptosis-related protein expression in the PFC and hippocampal without ketamine exposure. On the contrary, it amplified the induction of apoptotic signals by ketamine in both PFC and hippocampal regions of mice.
Immunofluorescence staining was performed to investigate ketamine's effects on neuronal apoptosis in the four transgenic mouse models. The results showed that compared to WT-NC group, WT-KET group exhibited decreased P-Akt and P-Gsk3β along with increased Bax in the PFC and hippocampus. No significant differences in the levels of P-Akt, P-Gsk3β, or Bax in neurons were observed between the WT-NC and cKO-NC groups (Fig. 4K-L, N-O, and Fig. S6-S7). Notably, cKO-KET mice demonstrated further reductions in neuronal P-Akt and P-Gsk3β, as well as greater Bax increases, relative to WT-KET mice. The results demonstrated that neuronal DRD1 knockout did not significantly affect apoptotic signaling in either PFC or hippocampal neurons of mice without ketamine exposure, but enhanced the effect of ketamine-induced neuronal apoptosis.
Immunofluorescence co-staining of GFAP and P-Akt in the hippocampus of four transgenic mouse groups revealed that alterations in the apoptotic signaling molecule P-Akt did not colocalize with the astrocytic marker GFAP (Fig. S8A). Additionally, the P-Akt signaling did not colocalize with microglial marker Iba1 in the hippocampus (Fig. S8B).
Comments (0)