Experimental animals and human OA samplesAnimals
Male C57BL/6 mice (8 weeks, 20–22 g, SPF) were purchased from the Southern Medical University Animal Center (Guangzhou, China) and maintained at 22 ± 2 °C, 55 ± 10% humidity and a 12-h light/dark cycle. OA was induced by destabilization of the medial meniscus (DMM) at 8 weeks of age. For primary chondrocyte isolation, 3-day-old neonatal pups were euthanized by decapitation. All procedures were approved by the Institutional Animal Care and Use Committee of Southern Medical University (approval no. SMU-L2018158).
Transgenic mice
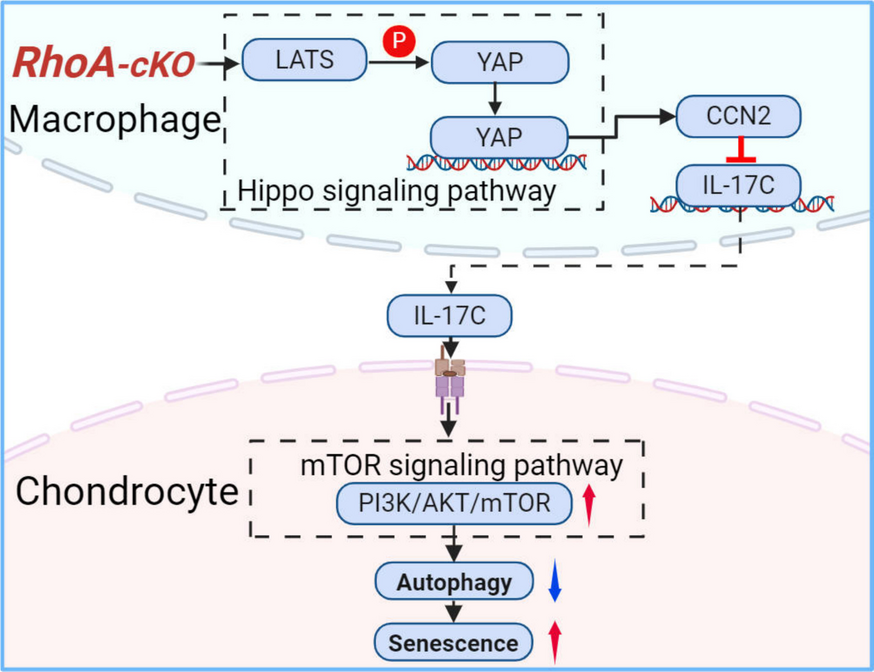
Lyz2-Cre mice (Sangon Biotech, Suzhou, China) were backcrossed to C57BL/6 for ≥ 6 generations and then crossed with RhoAflox/flox mice to produce macrophage-specific (Lyz2-Cre; RhoAflox/flox) RhoA knockouts. Cre-negative RhoAflox/flox littermates served as controls. Genotyping was performed following the protocols described in our previous publication (Xu et al. 2021).
Human tissues
Synovial samples were obtained from patients with end-stage OA (KL grade 1–4; mean age 67 ± 5) undergoing total knee replacement and from trauma-amputation controls (mean age 35 ± 10) at the Ganzhou Hospital–Nanfang Hospital. The study protocol was approved by the Institutional Review Board (approval no. TY-ZKY2024-141–01), and written informed consent was obtained from all participants.
Primary cell and OA cartilage culture
Primary chondrocytes were isolated from 3-day-old C57BL/6 pups by enzymatic digestion (0.2% type II Collagenase, 2 h, 37 °C) and cultured in DMEM/F-12 with 10% FBS and 1% penicillin–streptomycin; cells were used at passage ≤ 2. Bone marrow–derived macrophages (BMDMs) were generated by flushing femora and tibiae from 8-week-old mice and culturing in DMEM containing 10% FBS and 20 ng/mL recombinant murine M-CSF (PeproTech, 315–02) for 7 days; purity was > 95% (Zou et al. 2021).
Human OA cartilage was obtained from total-knee-replacement patients within 2 h of surgery, minced into 1 cm2 explants and cultured in DMEM/F-12 plus 10% FBS at 37 °C, 5% CO₂ (Xu et al. 2023). All human tissues were collected under approval TY-ZKY2024-141–01 with written informed consent.
Animal surgery and drug administration
OA was induced by destabilisation of the medial meniscus (DMM) in the right knee of 8-week-old male C57BL/6 mice. Under sterile conditions and continuous isoflurane anaesthesia (2% in O₂, 1 L/min), the medial meniscotibial ligament was transected under a dissecting microscope (× 10). Sham mice underwent identical arthrotomy without ligament transection (Xu et al. 2023). Post-operative analgesia (Carprofen 5 mg/kg s.c. every 12 h for 48 h) and prophylactic antibiotics (enrofloxacin 5 mg/kg s.c. once daily for 3 days) were administered.
Beginning 7 days after surgery, mice received weekly intra-articular injections (30-gauge needle via the patellar tendon, 9–11 a.m.) for 7 consecutive weeks: (1) DMM + CT04: CT04 (1 μg/μL, 10 μL (Zhang et al. 2012)) in 0.9% NaCl, pH 7.4. (2) DMM + CT04 + Anti-IL-17C: CT04 (2 μg/μL, 5 μL) plus Anti-IL-17C (20 mg/kg, 5 μL in 0.9% NaCl (Zhou et al. 2020b)). (3) DMM + vehicle (Control group): equal volume of sterile 0.9% NaCl. Stock solutions were sterile-filtered (0.22 μm), aliquoted, and stored at − 80 °C. Aliquots were thawed at 4 °C immediately before use, vortexed for 5 s, centrifuged 1 min at 4 °C, and kept on ice ≤ 2 h prior to injection.
Micro-computed tomography
The mouse knee tissues were preserved in a 4% paraformaldehyde solution for 72 h before undergoing micro-computed tomography (micro-CT) analysis, following established methodologies. The analysis assessed several parameters, including the osteophyte count, trabecular separation (Tb. Sp, mm), trabecular thickness (Tb.Th, mm), and trabecular number (Tb. N, 1/mm). These parameters were quantified using the accompanying software for the micro-CT system (ZKKS-MicroCT4.1, China).
Histological staining
Knee joints were fixed in 4% paraformaldehyde for 24 h at 4 °C, decalcified in 10% (w/v) EDTA (pH 7.4, 4 °C, 50 days), dehydrated through ascending ethanol (70%, 80%, 90%, 100%, each 30 min), embedded in paraffin and sectioned into 5 μm.
Safranin O-fast green (0.1% Safranin O, 5 min; 0.2% Fast Green, 5 min) and Toluidine blue (0.04%, 2 min) staining were performed. Cartilage degeneration was scored according to OARSI 2019 guidelines (0–6 scale) by two blinded observers. Synovitis was graded on H&E-stained Sects. (0–9 scale).
For immunohistochemistry, sections were deparaffinized, rehydrated, subjected to heat-mediated antigen retrieval (citrate buffer, pH 6.0, 95 °C, 20 min), incubated with 3% H₂O₂ (15 min) and blocked with goat serum (30 min). Primary antibodies (dilutions in Table S1) were incubated overnight at 4 °C, followed by HRP-conjugated secondary antibody at room temperature (RT, 1 h) and DAB (≤ 3 min). Sections were counterstained with haematoxylin, dehydrated and mounted.
For immunofluorescence, antigen retrieval and blocking (5% normal goat serum, 1 h) were performed as above. Primary antibodies were incubated overnight at 4 °C, followed by Alexa Fluor-conjugated secondary antibodies (488 or 568, 2 h, RT). Nuclei were stained with DAPI (1 μg/mL, 5 min). Images were captured using a Nikon A1 confocal microscope at identical settings. The list of antibodies used is provided in the Supplementary Materials Table 1.
RNA sequencing
Total RNA was extracted using Trizol Reagent (Invitrogen Life Technologies), with concentration, quality, and integrity assessed via a NanoDrop spectrophotometer (Thermo Scientific). Three micrograms of RNA were used for library preparation. mRNA was isolated from total RNA using poly-T oligo-attached magnetic beads, followed by fragmentation using divalent cations in an Illumina proprietary buffer at elevated temperature. First-strand cDNA was synthesized with random primers and Super-Script II, and second-strand synthesis was performed using DNA Polymerase I and RNase H. Exonuclease/polymerase activities converted remaining overhangs into blunt ends, and the enzymes were removed. Following adenylation of the 3′ ends, Illumina PE adapter oligonucleotides were ligated for hybridization preparation. To select cDNA fragments of 400–500 bp, the library was purified using the AMPure XP system (Beckman Coulter, Beverly, CA, USA). Adapter-ligated DNA fragments were enriched through 15 cycles of PCR using Illumina PCR Primer Cocktail. The products were purified (AMPure XP system) and quantified using the Agilent high-sensitivity DNA assay on a Bioanalyzer 2100 system (Agilent). The sequencing library was processed on the NovaSeq 6000 platform (Illumina) at Shanghai Personal Biotechnology Cp. Ltd. Transcriptome analysis followed the manufacturer's protocol.
Single-cell RNA sequencing data processing
The single-cell RNA sequencing dataset GSE133449 (Sun et al. 2020) (10.1136/annrheumdis-2019–215926) was processed using the Seurat R package. These data were originated from the patients with OA (n = 4). Initial quality control steps included filtering cells with high mitochondrial gene content (> 20%) and low gene count (< 200 genes per cell). Normalization and scaling of the data were performed, followed by the identification of highly variable genes across cells. A differential expression analysis was performed on macrophages cluster (MS4A7+) (Zhou et al. 2020a), and the result was visualized using Uniform Manifold Approximation and Projection (UMAP). MS4A7+ macrophages were colored according to its expression level of RhoA, allowing us to spatially observe the distribution of gene expression within the UMAP embedding.
Western blotting
After washing with PBS, tissues and cells were collected in RIPA lysis buffer (Cat#FD009, Fdbio Science, China) containing phosphatase and protease inhibitors, followed by protein extraction through lysis at RT for 30 min. Proteins were separated by SDS-PAGE and transferred to polyvinylidene fluoride membranes (Cat#IPVH0010, Millipore, USA) according to standard protocols. Membranes were blocked with 5% skim milk for 1 h at RT, then cut horizontally based on molecular weight, as labelled by Precision Plus Protein (10—250 kD, Cat#1610374S, Bio-Rad, USA). Membranes were incubated with primary antibody at 4 °C overnight. To detect phosphorylated proteins at the same site, membranes were stripped using Stripping buffer (Cat#ab282569, Abcam, UK), re-blocked with 5% skim milk for 1 h at RT, and incubated with primary antibody overnight at 4 °C. On the following day, horseradish peroxidase (HRP)-conjugated secondary antibodies were applied, and enhanced chemiluminescence was used to detect target protein expression levels. Information on the antibodies utilized is provided in Supplementary materials Table 1.
Statistical analyses
Statistical analysis was performed using SPSS 25.0 software. Comparisons were made using the t-test, one-way ANOVA, or two-way ANOVA, followed by Tukey's post hoc test. Data are presented as mean ± S.D. (n ≥ 3), with P < 0.05 considered statistically significant.

Comments (0)