Key resource table
Reagent or Resource
Source
Identifier
Antibodies
Rabbit anti-ACF1 (BAZ1A)
Abcam
Cat# ab187670
Mouse anti-Flag (Clone M2)
Sigma-Aldrich
Cat# F1804
Rabbit anti-Lactyllysine (Kla)
PTM Biolabs
Cat# PTM-1401
Mouse anti-NAA20
Santa Cruz
Cat# sc-3917
Rabbit anti-GCLM
Abcam
Cat# ab126704
Rabbit anti-GCLC
Abcam
Cat# ab190685
Rabbit anti-c-Myc
Cell Signaling Technology
Cat# 13,987
Rabbit anti-N-Myc
Cell Signaling Technology
Cat# 13,987
Rabbit anti-H3K27ac
Cell Signaling Technology
Cat# 8173
Rabbit anti-H3K4me3
Cell Signaling Technology
Cat# 9751
Mouse anti-GAPDH
Cell Signaling Technology
Cat# 97,166
Goat anti-Rabbit IgG (HRP-linked)
Cell Signaling Technology
Cat# 7074
Goat anti-Mouse IgG (HRP-linked)
Cell Signaling Technology
Cat# 7076
Alexa Fluor 488 secondary antibodies
Thermo Fisher Scientific
Cat # A-11008
Chemicals, peptides, and recombinant proteins
Cisplatin
Sigma-Aldrich
Cat#232,120
Sodium Lactate (Lactate)
Sigma-Aldrich
Cat#1,614,308
Sodium Oxamate (Oxamate)
Sigma-Aldrich
Cat# O2751
Rotenone
Sigma-Aldrich
Cat# 557,368
C11-BODIPY 581/591 (Lipid Peroxidation Sensor)
Thermo Fisher Scientific
Cat# D3861
DAPI (Nuclear Stain)
Thermo Fisher Scientific
Cat# 62,248
Protein A/G Magnetic Beads
Thermo Fisher Scientific/Bio-Rad
Cat# 88,802
Critical commercial assays
Cell Counting Kit-8 (CCK-8)
Dojindo
Cat# CK04
Annexin V-FITC Apoptosis Detection Kit
BD Biosciences
Cat# 556,547
Dual-Luciferase Reporter Assay System
Promega
Cat# E1910
High Capacity cDNA Reverse Transcription Kit
Applied Biosystems
Cat# 4,374,967
SYBR Green qPCR Master Mix
Applied Biosystems
Cat# A46113
ChIP-Grade Protein A/G Beads/Kit
Cell Signaling Technology
Cat# 9006
Cell lines
KELLY (Human Neuroblastoma)
ECACC
92,110,411
BE(2)C (Human Neuroblastoma)
ATCC
CRL-2268
HEK293T
ATCC
CRL-3216
Software and algorithms
R Project for Statistical Computing
https://www.r-project.org/
v4.0.0 or higher
GraphPad Prism
GraphPad Software
v8.0 or v9.0
ImageJ/Fiji
NIH
https://imagej.net/
Bowtie2 (ChIP-seq alignment)
Langmead and Salzberg, 2012
v2.3.5
MACS2 (Peak calling)
Zhang et al., 2008
v2.1.1
deepTools (Heatmaps/Profile plots)
Ramírez et al., 2016
v3.3.0
DiffBind (Differential binding)
Ross-Innes et al., 2012
R package
Cells
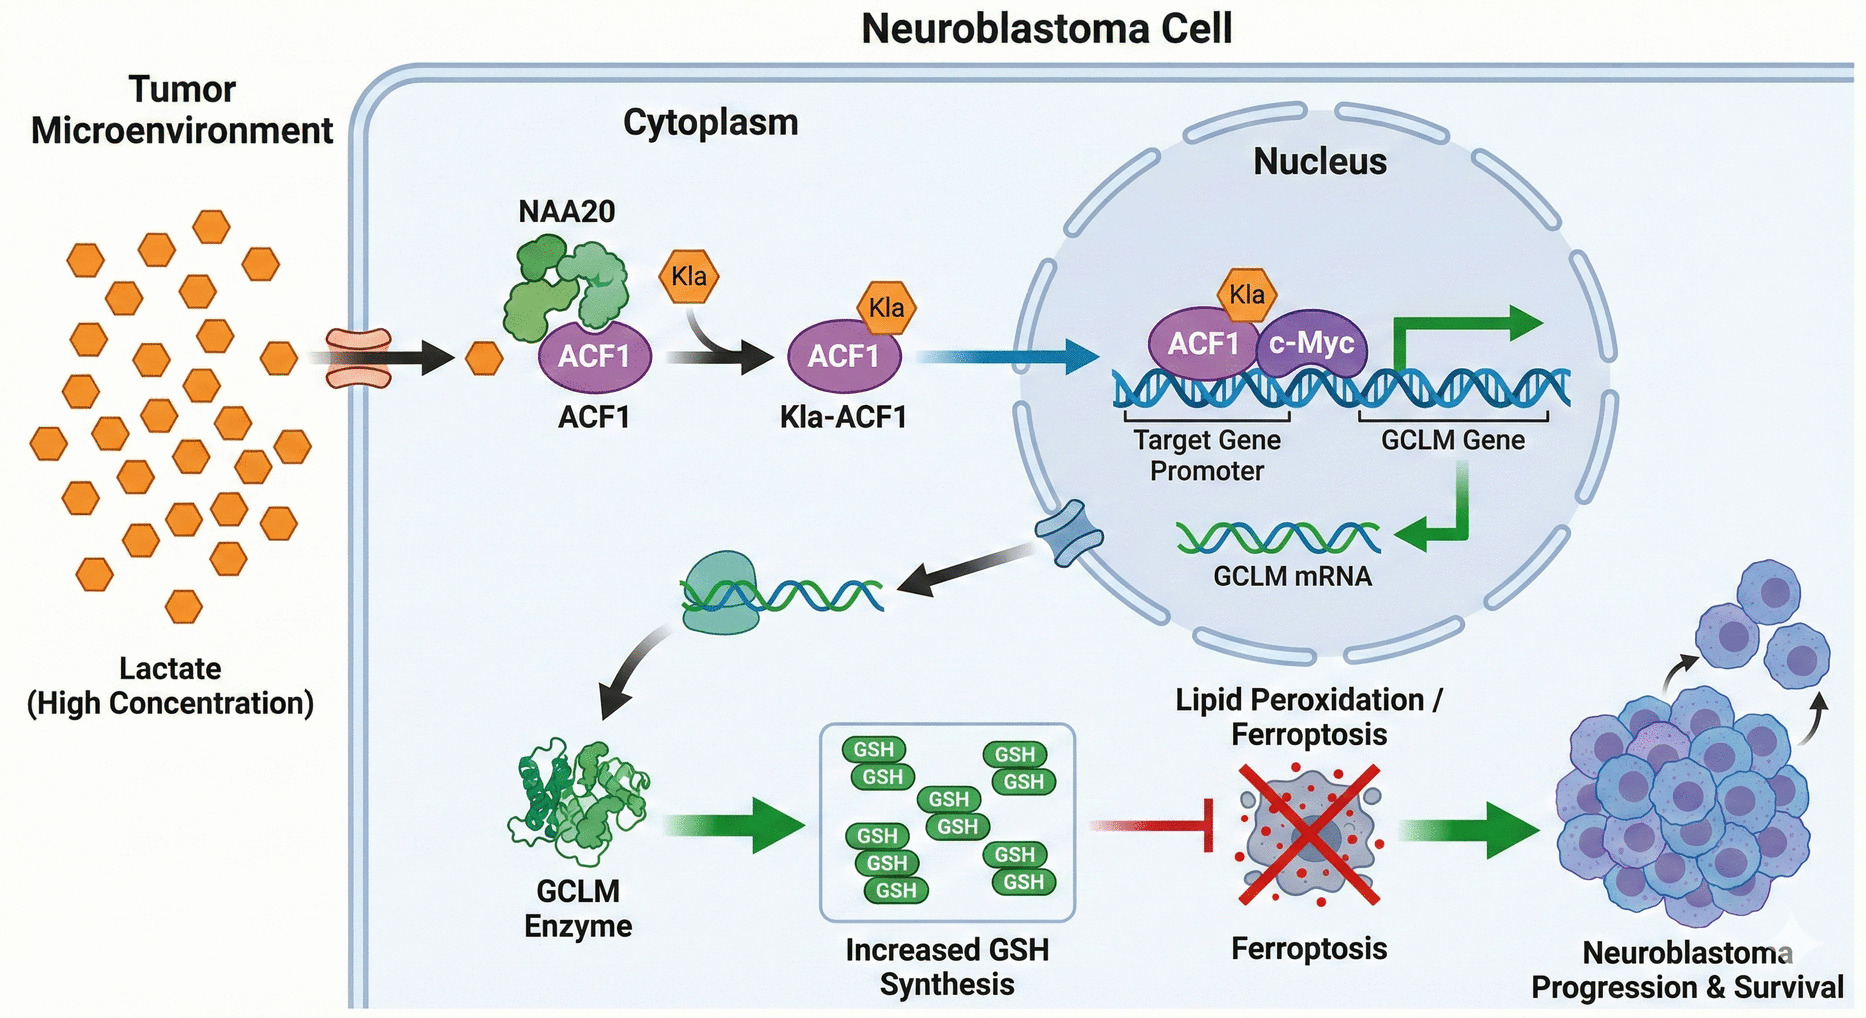
Human NBL cell lines KELLY (CL-1084) and SK-N-BE (2)C (BE2C; CL-0441), and the HEK-293 T cell line (CL-0005) were sourced from Procell Life Science (Wuhan, China). All cells were maintained in DMEM (high glucose) containing 10% FBS and 1% antibiotics, maintained in a humidified incubator at 37℃ with 5% CO2 to ensure normal growth and metabolism. Cells were kept in the exponential growth phase prior to experimentation to ensure stability and reliability of results. For gene knockdown, short hairpin RNAs (shRNAs) targeting ACF1 or NAA20 were administered to cancer cell lines using lentiviral vectors, with shGFP (Green fluorescent protein) applied as control. For gene overexpression, a GCLM overexpression vector (pCMV6-GCLM) was administered utilizing Lipofectamine 2000 (Thermo Fisher Scientific). After transfection, stable clones were selected using puromycin 72 h later.
The Flag-ACF1 expression vector was loaded into HEK293T cells. After 48 h, cells were collected for further analysis. ACF1 overexpression was verified by Western blot (WB) analysis and immunofluorescence staining using an anti-Flag antibody, ensuring successful cellular expression. To test the impact of lactate on ACF1 lactylation, cells were exposed to Oxamate, a lactate dehydrogenase inhibitor. Cells were cultured with 0.1 mM Oxamate for 24 h, and ACF1 lactylation was determined by WB using an anti-lactylated lysine antibody, alongside evaluation of ACF1 nuclear localization. To further explore the role of glycolysis in ACF1 lactylation, cells were exposed to Rotenone, an inhibitor of mitochondrial respiratory chain complex I, to promote glycolysis. Cells underwent exposure to varying concentrations of Rotenone (0, 1, 2 μM) for 24 h, followed by WB examination of ACF1 lactylation and nuclear localization. Additionally, a lactate assay kit was employed to evaluate cellular lactate levels, assessing changes in glycolysis.
Exome sequencing analysis
Tumor tissue, blood, and 3D-cultured organoid tissues from five NBL patients were subjected to exome sequencing. DNA was isolated from all samples and sequenced using the Illumina platform. DNA quality control was performed prior to sequencing to ensure integrity and purity met analysis requirements. Exome sequencing data were aligned with high quality using the Genome Analysis Toolkit. Samtools was used for data processing and filtering, followed by mutation detection with VarScan and Mutect2. To ensure high-confidence variant calling, mutations were filtered based on the following criteria: (1) a read depth > 50x, (2) a variant allele frequency (VAF) > 5% in tumor samples, and (3) a ‘PASS’ status assigned by the calling algorithm. Variants present in the matched blood controls were excluded to filter out germline polymorphisms. The ACF1 gene region was analyzed in depth to identify potential mutations or amplifications.
Bioinformatics analysis
Transcriptome profiling data and clinical annotations for neuroblastoma were obtained from the GEO database, specifically utilizing the Kocak cohort (GSE45547, n = 649) profiled on the Agilent-020382 platform and the SEQC cohort (GSE62564, n = 498) obtained via RNA-sequencing. Data preprocessing and quality control were performed in the R statistical environment (v4.x); for microarray data (GSE45547), background correction and quantile normalization were conducted using the limma package, while RNA-seq count data (GSE62564) were normalized using the DESeq2 package after filtering low-abundance genes (CPM < 1). Differential expression analysis of ACF1 (BAZ1A) across INSS stages and risk groups was performed using limma for microarray and DESeq2 for RNA-seq data, with significance defined as an adjusted p-value < 0.05 and |log2 Fold Change|> 1, and prognostic value was assessed via Kaplan–Meier survival analysis using the survival package.
RNA isolation and quantification
Cellular RNA was extracted employing the TruSeq RNA Sample Preparation Kit (Illumina) adhering to the producer’s guidelines. The RNA samples were then assessed for concentration and purity. Next, 500 ng of RNA was used for cDNA analysis utilizing the PrimeScript RT Reagent Kit (Takara, Japan). Quantitative polymerase chain reaction (qPCR) was conducted with SYBR Green Master Mix (Applied Biosystems, USA) on the ABI 7500 Real-Time PCR system. Relative gene expression was determined using the 2–ΔΔCt method, with GAPDH employed as the housekeeping gene.
RNA sequencing (RNA-seq) analysis
Total RNA was extracted from ACF1-knockdown and control KELLY cells as mentioned above, and libraries were constructed. Library quality was determined with an Agilent Bioanalyzer to ensure fragment size and concentration met high-throughput sequencing requirements. RNA samples were sequenced on the Illumina HiSeq platform, and raw data were stored in FASTQ format. Sequencing data were aligned using STAR software (v2.7) with the Ensembl-annotated genome as the reference. Aligned data were processed using samtools to ensure quality and accuracy, removing low-quality alignments. Differential expression analysis was performed using DESeq2, involving data normalization, filtering of low-expression genes, and calculation of gene expression levels and significant differences. Genes with an FDR-adjusted p-value < 0.05 were deemed significantly differentially expressed genes (DEGs). Gene Ontology (GO) and Kyoto Encyclopedia of Genes and Genomes (KEGG) were performed with the clusterProfiler package to elucidate ACF1-regulated cellular components, biological processes, molecular functions, and its potential role in NBL. Enrichment analysis results were visualized using ggplot2 in R.
Lipid peroxidation assays
To measure lipid peroxidation, the C11-BODIPY 581/591 probe (Thermo Fisher) was employed. Cells were seeded in six-well plates and exposed to the indicated experimental conditions. The cells were then loaded with 10 μM C11-BODIPY 581/591 diluted in fresh medium and incubated for 30 min at 37℃ in the absence of light. Post-incubation, the cells underwent three washes with PBS, were trypsinized to detach them, and were finally resuspended in PBS. The oxidized fraction of the probe was analyzed using flow cytometry (BD Biosciences) with excitation at 488 nm and emission detection in the FITC channel.
WB analysis
Cells or tissues were disrupted using RIPA buffer, and protein content was evaluated via the BCA assay. Uniform protein quantities (20–40 μg) were resolved by SDS-PAGE and then loaded to PVDF membrane (Millipore, USA). After blocking with 5% BSA, the membranes were probed at 4℃ with antibodies against ACF1, GCLM, NAA20, and GAPDH overnight. The next day, the membrane was incubated with an HRP-conjugated IgG for 1 h, and protein bands were developed utilizing an ECL detection reagent (Thermo Fisher). Chemiluminescent images were captured with a Tanon 5200 imaging system, and grayscale values were quantified using ImageJ software.
Immunohistochemistry (IHC)
To assess ACF1 expression in NBL, commercial TMA samples containing tumor and adjacent tissues from 82 patients were subjected to IHC analysis. Tissue samples were paraffin-embedded and sectioned. Sections underwent dewaxing and antigen retrieval to restore antibody binding capacity. After blocking, these sections were treated with an ACF1-specific primary antibody (Abcam) at 4℃ overnight. The following day, sections were exposed to an HRP-conjugated IgG for 1 h, followed by DAB (3,3'-diaminobenzidine) staining. Sections were counterstained with hematoxylin to visualize nuclear structure.
CCK-8 assays
KELLY and BE2C cells were plated in 96-well plates at 5,000 cells per well. After 24 h, CCK-8 reagent (Dojindo; 10 μL per well) was supplemented, followed by another 4-h incubation. Optical density was determined at 450 nm utilizing a microplate reader. Cell proliferation activity was evaluated by measuring changes in OD values.
EdU labeling assays
KELLY and BE2C cells were plated in 96-well plates. After 48 h of incubation, 10 μM EdU solution was supplemented, and incubation continued for an additional 1 h to pulse-label DNA-replicating cells. Staining was conducted with the Click-iT EdU assay kit (Invitrogen) adhering to the supplier’s protocols. Stained cells were analyzed under a fluorescence microscope (Olympus) and quantified with Image J.
Colony formation assay
KELLY and BE2C cells were plated in six-well plates at 500 cells per well to ensure sufficient cell numbers for independent colony formation. Cells were cultured under standard conditions for 2 weeks, with regular medium changes. Colonies were fixed for 0.1% crystal violet staining for 10 min, followed by gentle washing with water to remove unbound dye. Colonies were counted as a single colony under visual inspection.
Drug sensitivity assays
KELLY and BE2C cells were exposed to graded cisplatin concentrations (0, 0.01, 0.1, 1, 10, and 100 μM) or exposed to varying radiation doses (0, 1, 2, 5, and 10 Gy). After an incubation period of 48 h post-treatment, cell viability was determined with CCK-8 assays as detailed above. Similarly, for apoptosis analysis, cells were harvested 48 h after treatment with 10 μM cisplatin or 5 Gy radiation. Half maximal inhibitory concentration values of cisplatin or radiation were calculated by fitting a logistic regression curve.
Animal experiments
To validate the role of ACF1 in NBL, C57BL/6 mice (male, 6–8 weeks old) were used to establish a tumor model via subcutaneous or tail vein injection. Mouse NBL cells N2a (Procell; 1 × 10⁶ cells in 100 μL PBS) with stable artificial ACF1 knockdown were implanted into the right flank subcutaneously or via the tail vein. After 7 d, treatments were initiated, including radiation therapy (10 Gy) or cisplatin (5 mg/kg). Radiation therapy was administered weekly for three weeks using a small-animal radiation device. To prevent systemic toxicity, the radiation was delivered as localized irradiation targeting only the subcutaneous tumor on the right flank. A lead shield was employed to protect the rest of the mouse body from radiation exposure. Tumor and metastatic tissues were collected post-experiment for hematoxylin and eosin (HE) staining to analyze tumor growth, metastasis, and histological changes. Tumor volume and mouse survival were measured to evaluate survival outcomes, analyzed using the Kaplan–Meier method.
Immunofluorescence staining
To analyze ACF1 nuclear distribution in HEK293T cells, cells were seeded in 8-well slides and transfected with the Flag-ACF1 vector. After 48 h of culture to ensure ACF1 expression, cells were fixed, permeabilized, washed, and pre-blocked with 5% BSA. Cells were exposed to an anti-Flag antibody (1:500, Invitrogen) for 1 h, followed by a 30-min incubation with an Alexa Fluor 488-conjugated IgG (1:1000, Thermo Fisher) for 30 min. Nuclei were stained with DAPI, and fluorescent images were recorded using a fluorescence microscope. The proportion of nuclear-localized Flag-ACF1-positive cells was quantified using ImageJ.
Co-immunoprecipitation (Co-IP)
To detect physical interactions between NAA20 and ACF1, HEK293T cells were administered the Flag-ACF1 expression vector and washed. Cells were lysed in RIPA buffer, sonicated, and centrifuged to remove debris. The supernatant was treated with an anti-Flag antibody (1:500, Sigma) and Protein A/G magnetic beads (Santa Cruz) overnight to form immune complexes. After washing to remove non-specific binding, co-precipitated NAA20 protein was analyzed by WB using an anti-NAA20 antibody (1:1000, Abcam).
Chromatin immunoprecipitation-sequencing (ChIP-seq) and ChIP-qPCR
To investigate ACF1’s role at the chromatin level, ChIP-seq was performed. Chromatin was extracted from ACF1-low-expression cells and fragmented into 200–500 bp segments using nitrogen disruption. Chromatin was incubated with anti-H3K27ac, anti-H3K4me3, and anti-Myc antibodies (1:500, Abcam) to form immune complexes, which were precipitated using Protein A/G magnetic beads. Precipitated chromatin was washed, reverse-crosslinked, and purified utilizing the phenol/chloroform method. Purified DNA was sequenced on the Illumina platform. ChIP-seq data were analyzed using Homer software to identify binding sites in the GCLM promoter region and assess their regulation of epigenetic modifications. Raw sequencing reads underwent quality control filtering and were subsequently mapped to the human reference genome (hg19) with Bowtie2. Duplicate reads originating from PCR amplification were eliminated using Picard tools. Peak detection was then carried out employing MACS2 with a q-value cutoff of 0.05. For visualization, coverage tracks were created and scaled to RPKM using the bamCoverage tool from deepTools. Heatmaps and profile plots centered at the Transcription Start Sites (TSS) were generated using computeMatrix and plotHeatmap. DiffBind, an R-based package, was used for performing differential binding analysis, comparing normalized read counts within consensus peak sets between shGFP and shACF1 groups.
Furthermore, ChIP assays were employed to analyze the interaction between ACF1 and the GCLM promoter. Briefly, the procedure began with crosslinking of KELLY and BE2C cells using 1% formaldehyde at 22–25℃ for 10 min. After lysis of the cells, chromatin was mechanically sheared into fragments of 200–500 base pairs. Each ChIP reaction contained 10 μg of chromatin and 2–4 μg of the specific antibody, with anti-ACF1 (Abcam) used for immunoprecipitation and IgG as the isotype control for the negative control. After overnight incubation with Protein A/G magnetic beads, the chromatin was eluted, reverse-crosslinked, and the DNA was purified. The enrichment of GCLM promoter sequences was assessed by qPCR.
Luciferase reporter assays
To evaluate ACF1’s regulation of GCLM promoter transcriptional activity, a pGL4 luciferase reporter vector containing the GCLM promoter was co-transfected with the Flag-ACF1 expression vector into HEK293T cells. After 48 h, luciferase activity was determined utilizing the Luciferase Assay Reagent and analyzed via relative light units (RLU) to assess ACF1’s regulation of GCLM promoter activity. Results were analyzed using a luminometer.
Tandem affinity purification coupled with mass spectrometry (TAP-MS)
HEK293T cells administered the Flag-ACF1 vector were lysed, sonicated, and centrifuged to remove debris. The supernatant exposed to an anti-Flag antibody (1:500, Sigma) and Protein A/G magnetic beads (Santa Cruz) to form immune complexes. After multiple washes, reverse-crosslinking, and protein degradation, purified proteins were analyzed by liquid chromatography-tandem mass spectrometry employing a mass spectrometer (Orbitrap). Data were processed using MaxQuant or PEAKS software for protein identification and quantification of ACF1 and NAA20 interaction partners.
Immunocolocalization assays
To analyze the colocalization of NAA20 and ACF1, dual-label immunofluorescence staining was performed. KELLY or BE2C cells were plated on slides, fixed for 30 min, washed, and permeabilized. Cells were blocked with 5% BSA to reduce non-specific binding and incubated with anti-NAA20 (1:500, Abcam) and anti-ACF1 (1:500, Sigma) antibodies for 1 h. Secondary antibodies (1:1000, Thermo Fisher), were applied for 30 min. Following washing and DAPI staining, cells were observed under the fluorescence microscope, and colocalization was analyzed.
Statistical analysis
Experimental results are exhibited as the mean ± SD. Unless otherwise specified, experiments were repeated at least six times. Statistical analysis was carried out using GraphPad Prism 9.0 (GraphPad Software). Comparisons between groups were performed using an unpaired two-tailed Student’s t-test or, where appropriate, one-way or two-way ANOVA with Tukey’s post-hoc tests. A p-value less than 0.05 was deemed statistically significant.

Comments (0)