Data sources and bioinformatics analysis
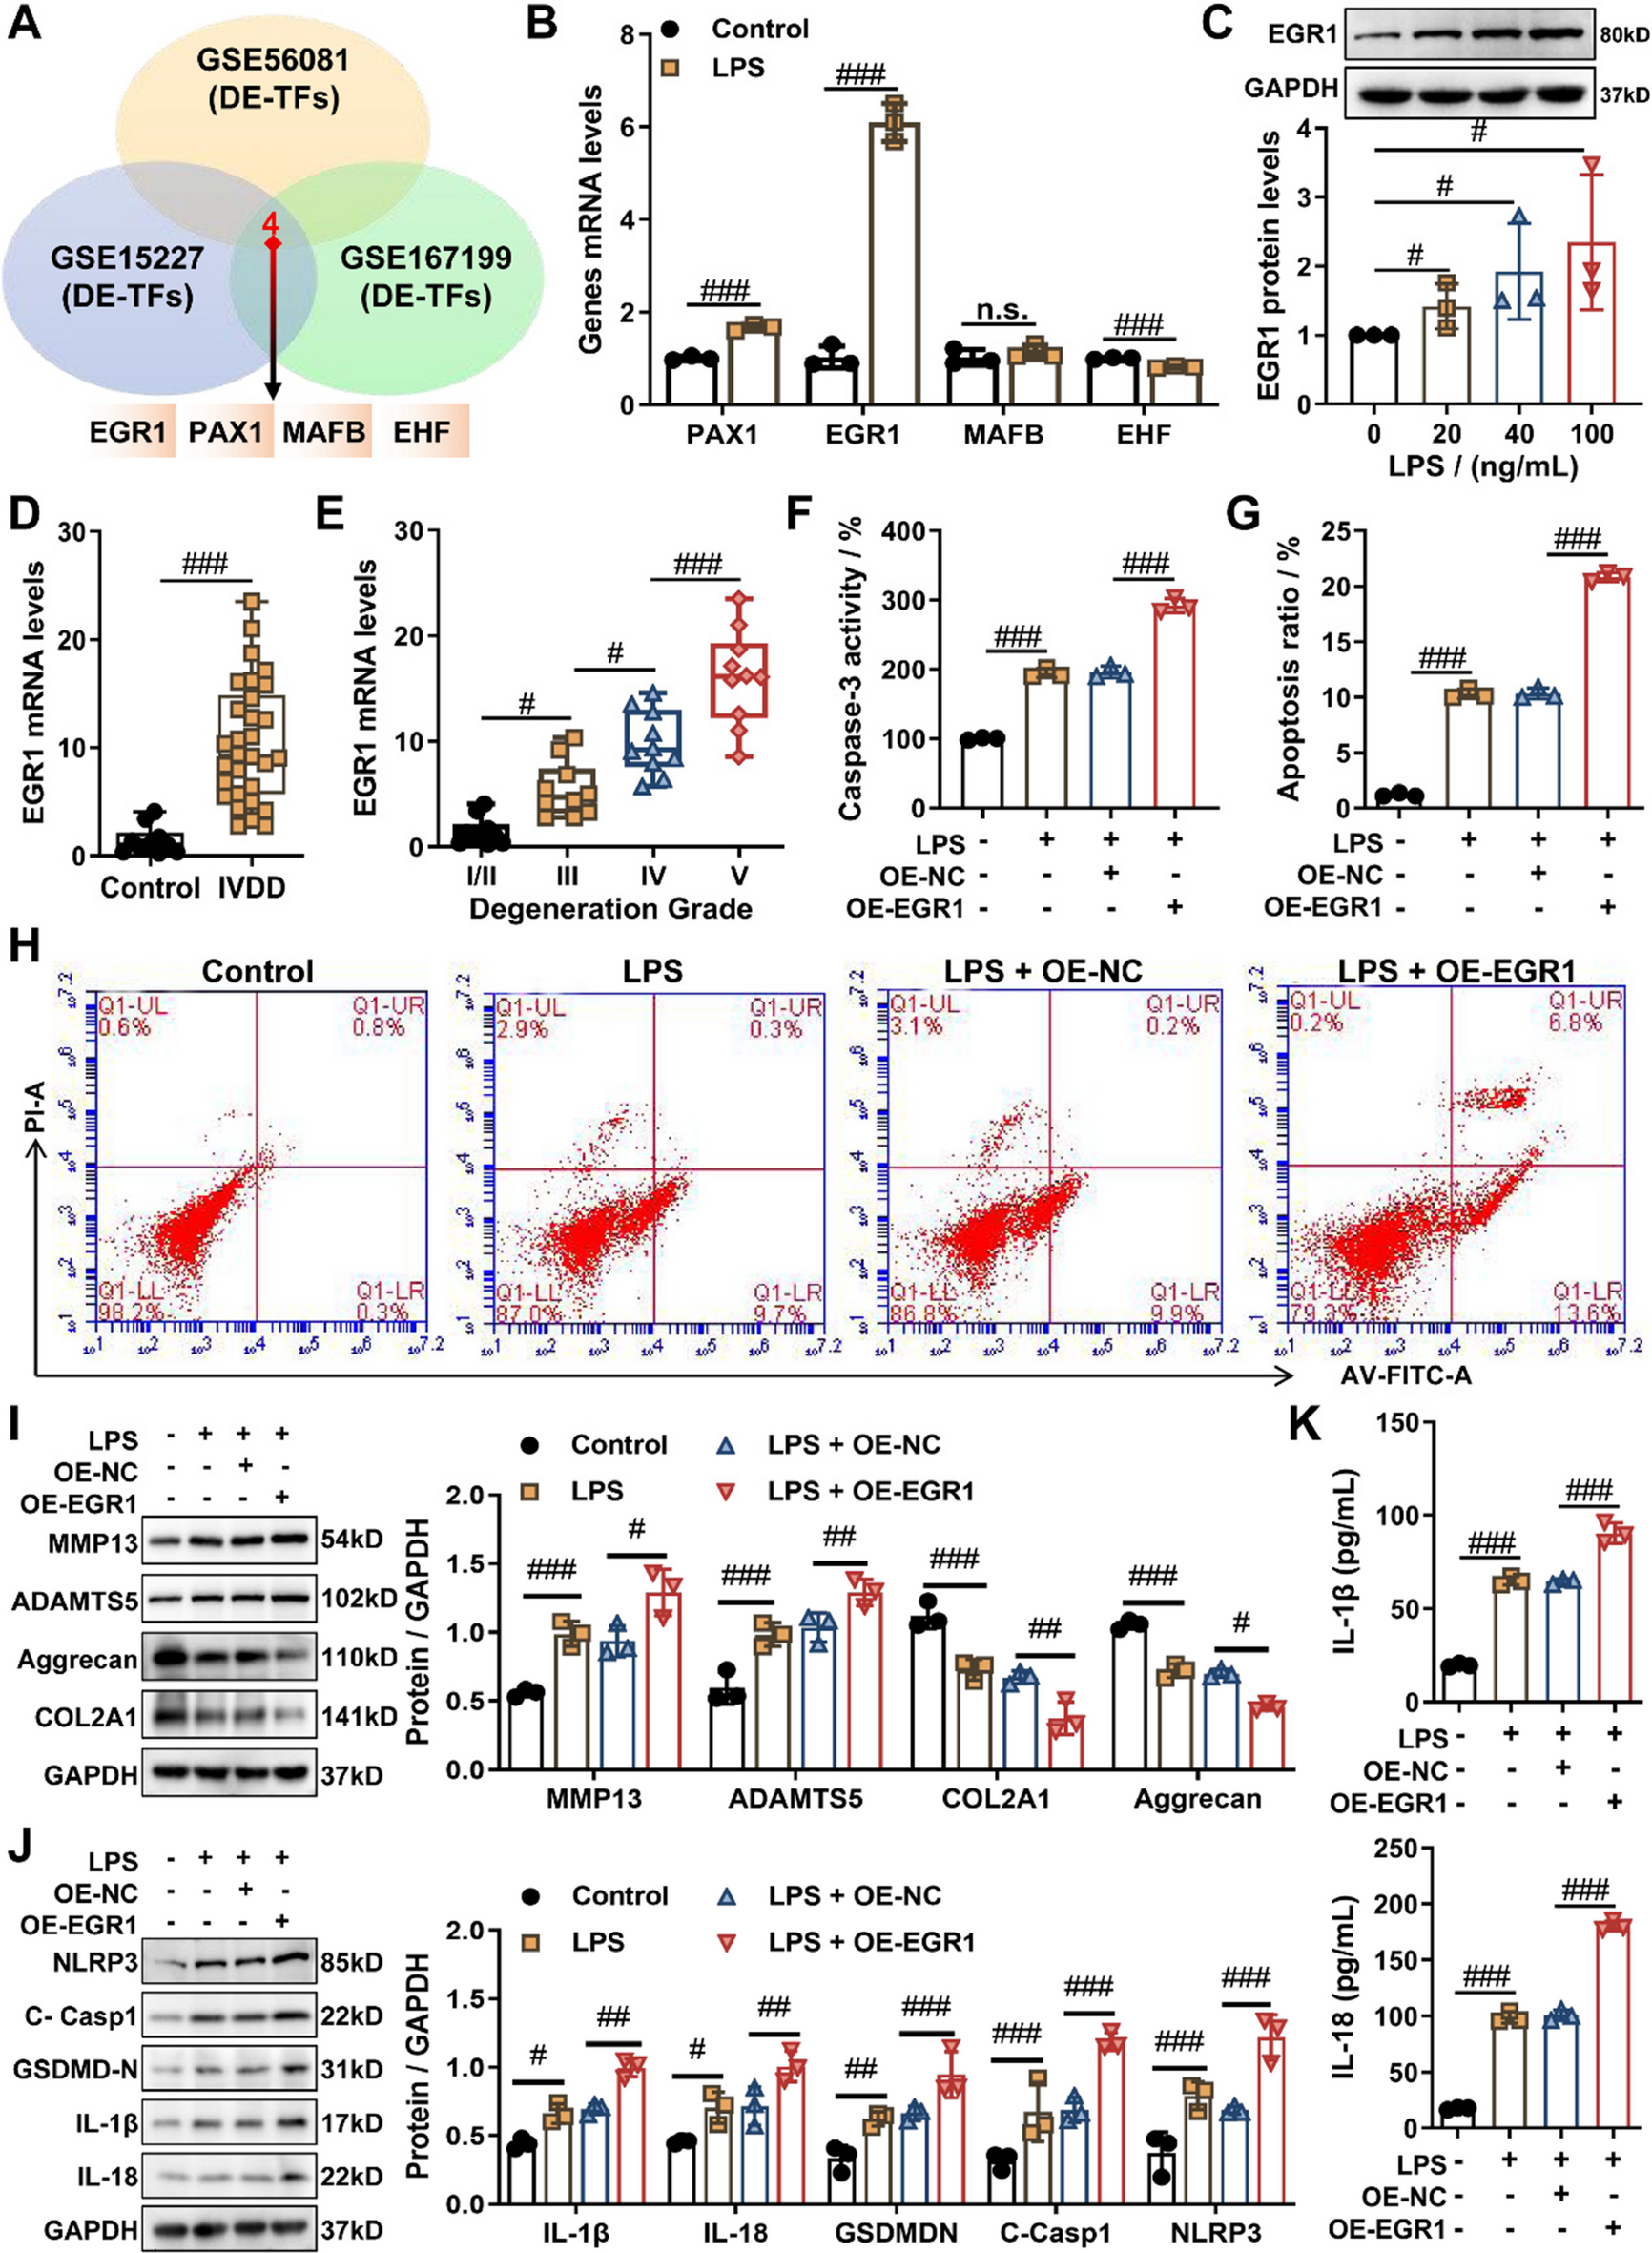
The mRNA expression profiles associated with IVDD were retrieved from the Gene Expression Omnibus (GEO) database (https://www.ncbi.nlm.nih.gov/geo/) including GSE56081 (5 normal vs. 5 degenerative NP tissues), GSE15227 (5 normal vs. 10 degenerative NP tissues), and GSE167199 (3 normal vs. 3 degenerative NP tissues). Meanwhile, IVDD-related miRNA expression profiles were also obtained from the GEO database (https://www.ncbi.nlm.nih.gov/geo/), comprising GSE116726 (5 normal vs. 5 degenerative NP tissues) and GSE63492 (5 normal vs. 5 degenerative NP tissues). Differential expression analysis for mRNAs and miRNAs was performed separately for each dataset using the GEO2R online tool (https://www.ncbi.nlm.nih.gov/geo/geo2r/), which employs the R packages integrated within the Bioconductor project to compare expression levels of mRNAs/miRNAs between predefined groups (normal vs. degenerative NP). Significantly dysregulated mRNAs and miRNAs were confirmed with P-value < 0.05 and absolute log2 fold change (|logFC|) > 1. To identify transcription factors (TFs) involved in IVDD, differentially expressed mRNAs from the three datasets (GSE56081, GSE15227, and GSE167199) were intersected with known transcription factors (TFs) from the TRRUST database, respectively. The differentially expressed TFs (DE-TFs) obtained from all three datasets were then integrated to identify candidate TFs that may regulate IVDD progression.
To explore potential regulatory mechanisms involving the transcription factor EGR1 in IVDD, its target miRNAs were predicted using TransmiR v2.0 (http://www.cuilab.cn/transmir) (Tong et al., 2019), which compiles both validated and predicted transcription factor-miRNA interactions to predict target miRNAs of EGR1. Subsequently, the predicted EGR1-targeted miRNAs were intersected with the differentially expressed miRNAs derived from the analysis of GSE116726 and GSE63492 datasets, thereby identifying the potential target miRNAs of EGR1 in IVDD.
To identify potential target genes of miR-4306 in IVDD, putative targets of miR-4306 were forecasted by five independent bioinformatics algorithms, namely TargetScan (https://www.targetscan.org/mamm_31/), miRDB (https://mirdb.org/), PicTar (http://pictar.mdc-berlin.de/), miRmap (http://mirnamap.mbc.nctu.edu.tw/), and microT (http://diana.cslab.ece.ntua.gr/microT/). Subsequently, the target genes consistently predicted by all five algorithms were intersected with the upregulated differentially expressed mRNAs identified from the analysis of GSE15227 and GSE167199 datasets, thus confirming the potential target genes of miR-4306 in IVDD.
Clinical tissue samples
Experimental protocols were approved by the Ethics Committee of Zhujiang Hospital of Southern Medical University (No. 2022-KY-117–01), and all participants provided written informed consent. Degenerative NP tissues were derived from IVDD patients (Pfirrmann grading: III ~ V) who underwent spine surgeries at Zhujiang Hospital of Southern Medical University (Guangzhou, China) from 2022 to 2023. Non-degenerative NP tissues were obtained from patients (Pfirrmann grading ≤ II) who underwent surgery for idiopathic scoliosis or vertebral fracture. The disc degeneration degree was assessed by modified Pfirrmann grading system according to magnetic resonance imaging (Griffith et al., 2007), in which Pfirrmann grade equal to or less than II was considered as normal NP tissues. All NP tissues were derived from the lumbar spine and used for subsequent multiple experiments. The fresh NP tissues obtained were immediately stored in liquid nitrogen for molecular biological analysis or immediately placed in phosphate-buffered saline (PBS) for primary NP cells separation.
Human NP cells culture and in vitro IVDD cell model construction
The fresh NP tissues obtained from 8 patients with IVDD were used to isolate primary NP cells. In brief, fresh NP tissue removed under sterile conditions was immediately carefully washed using PBS to remove blood and annulus fibrosus. Then, the NP tissue was chipped out 1 mm3 tissue block and digested with 0.1% collagenase II (Sigma, USA) in a water bath at 37 °C for 2 h. After washing twice with PBS, 2.5 g/L trypsin (Sigma, USA) was added to continue digestion in a water bath at 37 °C for 10 min. Subsequently, residual tissue fragments in the digest were removed by filtration through a 200 meshes filter and cells were collected by centrifugation. Finally, the collected cells were seeded in DMEM/F12 complete medium containing 1% penicillin/streptomycin (Invitrogen, USA) and 20% fetal bovine serum (FBS; Gibco, USA) and cultured at 37℃ in the incubator with 5% CO2. The culture medium was replaced every three days. NP cells from passage 2 were put into the culture dish for follow-up experiments. Furthermore, NP cells were treated with 10 μg/mL LPS for 24 h to establish an in vitro IVDD cell model used for the in vitro experiments of this study (Lin et al., 2024). Furthermore, NP cells were dealt with 5, 10, 20 ng/mL TNFα (MCE, USA) or 5, 10, 20 ng/mL IL-1β (MCE, USA) for 24 h to construct additional inflammation-related degeneration models, which were applied to subsequent analysis.
Real-time quantitative PCR (RT‐qPCR)
Total RNAs were extracted from NP tissues and cells using TaKaRa MiniBEST Universal RNA Extraction Kit (Takara, Dalian, China), and then were reversed transcribed into cDNA using PrimeScript™ RT reagent Kit with gDNA Eraser (Perfect Real Time) (Takara, Dalian, China) according to the operating instructions. RT-qPCR amplification was performed with the use of One Step TB Green® PrimeScript™ RT-PCR Kit II (Perfect Real Time) on the ABI 7500 real-time PCR system (Applied Biosystems, USA). The expression levels of miRNA and mRNA were normalized to U6 and GAPDH. All the primers used are listed in Table 1.
Table 1 The primer sequences in this studyWestern blot
Total protein was extracted from NP tissues and NP cells using Precooled RIPA containing protease inhibitors (Beyotime, Shanghai, China), and then assayed for protein concentration using a BCA protein assay kit (Beyotime, Shanghai, China). Subsequently, equal amounts of proteins were separated using sodium dodecyl sulfate- polyacrylamide gel electrophoresis (SDS-PAGE; Invitrogen, USA) and transferred onto polyvinylidene difluoride (PVDF) membranes (Bio-Rad, USA). After blocking with 5% non-fat milk for 2 h, the membranes were incubated with primary antibodies overnight at 4 °C, followed by incubation with HRP-conjugated secondary antibody for 1 h at room temperature. Finally, the intensity of the protein bands was visualized on ChemiDoc XRS Plus (BioRad) using the ECL detection kit (Thermofisher, USA) and quantified using ImageJ software. The primary antibodies in the study are listed as follows: anti-EGR1 (Abcam, ab194357, 1:1000), anti-MAT2A (Abcam, ab154343, 1:1000), anti-NLRP3 (Beyotime, AF2155, 1:500), anti-cleaved caspase-1 (Abcam, ab207802, 1:1000), anti-cleaved N-terminal GSDMD (Abcam, ab215203, 1:1000), anti-IL-1β (Abcam, ab216995, 1:1000), anti-IL-18 (Abcam, ab207323, 1:1000), anti-MMP13 (Abcam, ab51072, 1:1000), anti-ADAMTS5 (Beyotime, AF6150, 1:1000), anti-Aggrecan (Abcam, ab36861, 1:1000), anti-COL2A1 (Beyotime, AF6528, 1:2000), and anti-GAPDH (Abcam, ab8245, 1:10,000).
Cell transfection
The pcDNA3.1-EGR1 vector (EGR1), pcDNA3.1-MAT2A vector (MAT2A), small-hairpin RNAs targeting EGR1 (shEGR1), and their negative control (NC) were purchased from Aiki Biotech (Guangzhou, China). The miR-4306 mimic and inhibitor and their NC were obtained from GenePharma (Shanghai, China). All transfections were executed with Lipofectamine 2000 (Invitrogen, USA) following the manufacturer’s instructions, and then RT-qPCR was used to determine the transfection effect. The sequences of shRNAs, miR-4306 mimic/inhibitor and their NC in this study were listed in Table 2.
Table 2 The sequences of shEGR1, miR-4306 mimics/inhibitor and their negative control in this studyProliferation analysis
Cell Counting Kit-8 (CCK-8) assay and EdU assay were used to detect the proliferation of the NP cells. For CCK-8 assay, the NP cells were treated with the Enhanced Cell Counting Kit-8 solution (C0041, Beyotime), and incubated in the cell incubator. After 1 h of incubation, the absorbance was determined using a microplate reader at an absorbance of 450 nm. For EdU assay, the NP cells were added 37℃ preheated EdU working solution (C0071S, Beyotime) according to the operating instructions. After incubation for 2 h, the medium was removed and fixed with 4% paraformaldehyde for 15 min at room temperature. Next, the NP cells were incubated with Click reaction solution at room temperature in the dark for 30 min. In addition, the EdU-stained cells were incubated with 1 × Hoechst 33,342 solution for 10 min at room temperature in the dark for nuclear staining. Finally, the results were observed under a fluorescence microscope (Leica, Germany) and the EdU positive percentage of cells was calculated.
Cell Apoptosis analysis
Cell apoptosis was detected by flow cytometry with Annexin V-FITC Apoptosis Detection Kit (C1062S, Beyotime) and GreenNuc™ Caspase-3 Assay Kit for Live Cells (C1168M, Beyotime). For flow cytometry, appropriate amount of Annexin V-PE binding solution was added to the collected cells to gently resuspend the cells, and then appropriate amount of Annexin V-PE was added to gently mix. After incubation at room temperature in the dark for 20 min, the cells were placed in an ice bath for flow cytometry. For caspase-3 activity, GreenNuc™ Caspase-3 Substrate was added to the treated cells for continued incubation. After incubation for 20 min, quantification was performed directly using a microplate reader (Thermo Fisher, USA).
Enzyme-linked immunosorbent assay (ELISA) analysis
Concentrations of interleukin-1β (IL-1β) and interleukin-18 (IL-18) in NP cell culture supernatants were quantified using species-specific commercial ELISA kits according to manufacturers' protocols. Human IL-1β levels were measured with the Human IL-1β ELISA Kit (PI305, Beyotime), while Human IL-18 levels were assessed using the Human IL-18 ELISA Kit (PI558, Beyotime). Supernatants were centrifuged at 12,000 × g for 10 min at 4 °C to remove debris prior to analysis, and absorbance was measured at 450 nm using a microplate reader (Thermo Fisher, USA).
Chromatin immunoprecipitation (ChIP) assay
To determine the interaction between EGR1 and miR-4306 promoter, we performed ChIP experiments using ChIP Assay Kit (P2078, Beyotime) according to the manufacturer's instructions. In brief, the NP cells were cross-linked with 1% formaldehyde solution for 10 min at 37℃ to fix protein-DNA interactions. Cross-linking was terminated by adding with Glycine Solution (10 ×) and incubating at room temperature for 5 min. Cells were then washed with precooled PBS containing 1 mM PMSF to stabilize the cross-linked complexes. After washing, the collected precipitated cells were incubated with SDS Lysis Buffer containing 1 mM PMSF for 10 min on ice to fully lyse the cells. Chromatin was then sheared by ultrasonication to generate DNA fragments ranging from 200 to 1000 bp. Next, the fragmented chromatin was immunoprecipitated with either anti-EGR1 antibody (Abcam, ab300449, 1:30) or anti-IgG antibody (Abcam, ab172730, 1:50) in the presence of Protein A + G Agarose/Salmon Sperm DNA to form immunoprecipitate complex. Immune complexes were washed extensively, and bound DNA was eluted and purified. Finally, the purified DNA was analyzed by RT-qPCR using specific primers, and the primer sequences were listed in Table 1.
Dual luciferase reporter assay
To determine the interaction between EGR1 and miR-4306 promoter, the luciferase reporter vector containing the wild-type (WT) or mutant (Mut) binding site of EGR1 in the miR-4306 promoter were devised and synthesized by Aiki Biotech (Guangzhou, China). Subsequently, the NP cells were co-transfected with the respective luciferase reporter vectors and either the EGR1 overexpression vector or negative control (NC) vector using Lipofectamine 2000 (Invitrogen, USA) for 48 h, and the activities of Firefly and Renilla luciferase were detected by the Dual Luciferase Reporter Assay Kit (Promega, USA). Similarly, to determine the interaction between miR-4306 and MAT2A, the luciferase reporter vector containing the wild-type (WT) or mutant (Mut) binding site of hsa-miR-4306 in the MAT2A 3' untranslated region (3'UTR) were devised and synthesized by GenePharma (Shanghai, China). Then, the NP cells were co-transfected with these respective luciferase reporter vectors and either miR-4306 mimics or NC mimics (GenePharma) using Lipofectamine 2000 (Invitrogen, USA) for 48 h, and the activities of Firefly and Renilla luciferase were detected by the Dual Luciferase Reporter Assay Kit (Promega, USA).
Animal experiments
Thirty wild-type C57BL/6 mice (male, 8 weeks old, 25 ± 3 g) were purchased from Guangdong Experimental Animal Centre (Guangzhou, Guangdong, China). All animal experimental protocols were approved by the Animal Research Ethics Committee of Zhujiang Hospital of Southern Medical University (Approval No. LEAC-2022–044). The mice were randomly divided into three groups: sham (n = 10), IVDD (n = 10), and IVDD + EGR1 inhibitor (IVDD + Treatment, n = 10) groups. The mouse IVDD model was established as described previously (Qiu et al., 2020). Two weeks after the establishment of the IVDD model, mice in the IVDD + Treatment group received weekly intraperitoneal injections of the EGR1 inhibitor (458–37-7, Santa Cruz Animal Health, shanghai, China). Mice in Sham and IVDD groups received equivalent volumes of PBS as a vehicle control. Twelve weeks after IVDD induction, mice were sacrificed, and the lumbar spine samples were harvested. Tissues underwent magnetic resonance imaging (MRI) scanning, followed by western blot analysis or fixation, decalcification, embedding, and sectioning into 5 μm thick slices. These sections were obtained for histological and immunohistochemical analyses.
Histology and immunohistochemistry
Tissue sections were stained with Hematoxylin and Eosin (H&E) and Safranin-O/Fast Green according to the established protocol (Qiu, Shi, 2020). For immunohistochemistry (IHC), antigen retrieval was performed by heating sections in 10 mM citrate buffer (pH 6.0) at 95 °C for 20 min. Endogenous peroxidase activity was quenched with 3% H₂O₂ in methanol for 15 min, followed by blocking of non-specific binding sites with 5% bovine serum albumin (BSA) for 1 h at room temperature. Sections were then incubated overnight at 4 °C with the following primary antibodies: anti-EGR1 (Abcam, ab300449, 1:500), anti-MAT2A (Abcam, ab154343,1:500), anti-NLRP3 (Beyotime, AF2155,1:200), and anti-MMP13 (Abcam, ab219620,1:500). After washing, bound primary antibodies were detected using appropriate horseradish peroxidase (HRP)-conjugated secondary antibodies incubated for 1 h at room temperature. Immunoreactivity was visualized using 3,3'-diaminobenzidine (DAB) as the chromogen. Images were captured using an inverted fluorescence microscope (MF52, Mshot). Negative controls were processed identically with omission of the primary antibody.
Statistical analysis
Statistical analyses and graph drawing were mainly conducted by GraphPad Prism 8.4 (GraphPad Software Inc., CA, USA). The differences between groups were analyzed using Student’s t test or one-way ANOVA. Non-parametric data (Pfirrmann grade) were analyzed using the Kruskal–Wallis H test. The correlation between genes was evaluated using Pearson correlation coefficient. Data are presented as mean ± SD, and P < 0.05 was regarded as statistically significant.

Comments (0)