The present study identified three distinct temporal patterns of total, animal, and plant protein intakes in Australian adults, which is significant because the diversity of these patterns may reflect different sociocultural motivations or beliefs that can serve as drivers or barriers for adopting more sustainable diets (e.g., plant-based diets) [32] and adhering to healthy eating styles (e.g., intermittent fasting) [33]. In terms of total protein intake, all mean intakes fell within the macronutrient distribution ranges for protein (15–25%) [29], but towards the lower end. Regardless of patterns, a large proportion of total and animal proteins were consumed in the evening, while plant protein was most likely eaten at midday with the amount of intake being similar across mealtimes. Sociodemographic and eating pattern characteristics varied between patterns. In most patterns, men and women with lower EO and meal frequencies were more likely to have lower protein intake from meals but higher protein intake from snacks.
Temporal distribution of protein intake
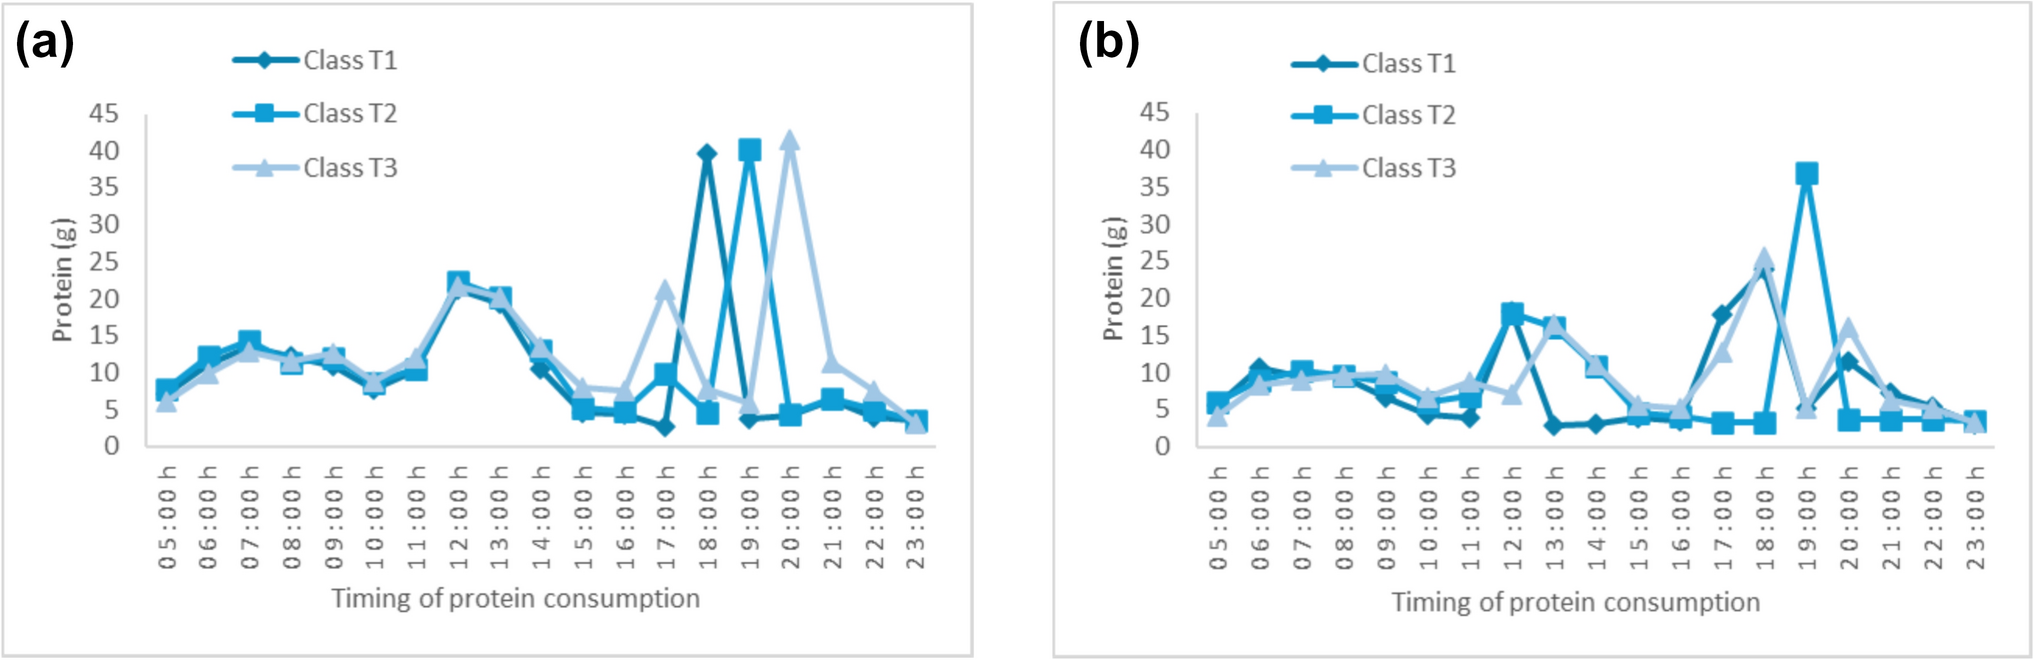
Australians had most of their protein intake in the evening (after 17:00 h), with animal protein being the main source and plant protein intake being more equally distributed throughout the day, regardless of the temporal patterns. The finding regarding a large proportion of total protein intake in the evening is similar to previous observational studies in comparable countries to Australia (United States, Great Britain, and New Zealand) suggesting adults have the largest proportion of their total protein intake in the evening, [7, 34, 35] which aligns with the evening meal being the major meal in many Western countries [36]. The present study also found that Australian protein intake was predominantly from animal sources, with the largest intake also in the evening, which aligns with previous observational studies suggesting that animal-source foods constitute a major protein source for Dutch, New Zealander, and Irish adults [5, 35, 37]. In terms of temporal plant protein distribution, the present study also aligns with previous studies suggesting a similar amount of intake across the day [5, 35, 37]. For example, the average plant protein intake of New Zealander adults in the morning, midday, and evening reported in the previous study was 9.5 g, 10.8 g, and 11.8 g, respectively and is similar to the plant protein intakes observed for the first and second class in the present study [35].
There are only a few studies have examined temporal protein patterns making comparison difficult. A study by Lucassen et al. [38] assessed the timing of eating and protein intake of adults grouped by their chronotype which describes the body’s preference to sleep and wake at certain times and can influence appetite and eating behaviour [17]. They found an 80-min difference in eating time, mainly at breakfast, probably reflecting different waking times between adults with morning-type and evening-type [38]. Another study grouping Finnish adults by their chronotype also found that adults with evening type consistently had their peak energy and macronutrient intake an hour later than those with morning type [38], which is similar to the patterns we identified as T1 and T2. However, as our study did not include measures of chronotype therefore we are unable to identify whether these patterns are similar due to overlapping chronotype. Also, among these small number of studies, relatively small and inconsistent differences have been identified but the importance of these small differences in timing of protein intake is unclear.
Characteristics of temporal protein patterns
The difference in eating timing between the temporal protein patterns observed in the present study may be influenced by sociodemographic factors. For example, T2, A2, and P2 patterns of men and women whose protein consumption was likely to be 1-h later than T1, A1 (in the evening), and P1 patterns (in midday) had higher income, socioeconomic, and employment status. This somewhat aligns with previous British studies suggesting that protein intake timing shifted toward a later time in the day (at 11:00–16:00 h and 16:00–23:59 h) [34], and the higher intake later in the evening was associated with higher social class and non-manual occupations (e.g., managerial and skilled professional workers) [39]. Furthermore, the difference between source-specific protein patterns might be explained by age and household structures, in which protein intake, eating and meal frequencies are more likely to be higher in married, older adults, and couples with and without children. In this study, men and women with A1-A2 and P1-P2 patterns who had a higher proportion of animal and plant protein from meals were older and had a higher proportion of married adults and couples with or without children when compared to adults with A3 and P3 patterns which were characterised by a lower proportion of animal and plant protein from meals. This is probably because commensality or family structures might contribute to higher intake of protein-containing foods and more eating and meal frequencies [36].
In contrast to Class A1 and Class P1, the findings on Class A3 and P3 of both sexes having lower intake, EO and meal frequency support previous studies suggesting that men and women are more likely to have lower protein intake as the number of EOs and meals decrease [18, 40]. Interestingly, Class A3 (men only) and P3 (both sexes) had higher amounts of protein intake from snacking occasions compared to the other classes, which is potentially related to the fact that younger adults are more likely to snack and skip meals- due to time scarcity, changing social commitments, and transition to a new social environment [17, 39, 41].
Unlike meal frequency which tends to be proportionate with the amount consumed [40], we found variability in the snacking frequency and the amount of protein intake from snacking in each pattern. For example, we observed different amounts of protein consumed from snacks despite the same snack frequency in men (Class A3 vs. A1-A2) and women (Class P3 vs. P1-P2). This could be because snacks are culturally seen as unstructured EOs with higher variability in both frequency and food types of individuals across the day [36]. This finding might also be influenced by the different snack preferences of adults in each class, where many preferred snacks high in carbohydrates but low in protein, as suggested in previous studies [41, 42].
Strengths and limitations
To our knowledge, this study is the first to assess temporal protein patterns of Australian adults using a data-driven method. This study also provides further understanding of protein intake distribution throughout the day by assessing the patterns of animal and plant protein intake separately, which may differentially influence the associations between protein intake and health. Another strength includes the identification of sociodemographic and eating pattern characteristics, which explains the distinction between three temporal protein patterns.
Some limitations should be considered in this study. Despite the nationally representative sample, the analysis used survey data from 2011–2012, and the data from 12 years ago may not represent current intake patterns. The COVID-19 pandemic might have also changed Australians’ work and commute hours [43], which could affect protein intake timing, and therefore warrant further analysis once more recent survey data has been published. This study used 1-d dietary recall data and was, therefore, unable to capture the potential day-to-day variability in protein intake patterns, especially between weekdays and weekend days. However, current methods used to model usual dietary intake are designed to estimate total daily intake and could not be applied to our study, which examined temporal intake at eating occasions. Another limitation is the generalisability of Australian dietary patterns and context may be different from other countries.
Moreover, this study used self-reported time of eating, which warrants future studies with more advanced measures of timing, such as picture-based or wearable technologies [4]. The other limitation is the lack of data on factors that potentially influence intake timing, such as different work patterns, occupational status (hours, schedules, and flexibility), and sleep timing and quality [17], which could be further explored in future studies. Another limitation is the cross-sectional design of this study limiting causality, which may warrant further investigations with RCTs considering intake timing of protein and other macronutrients. Lastly, despite the identified age difference between patterns, this study did not separate younger and older adults whose protein intake and requirements might be different. Future sex- and age-stratified patterns may be important for other outcomes, such as examining the impact of temporal protein patterns on ageing-related health outcomes.
Future research/implications
The present study’s findings on temporal protein patterns suggest that how and when people eat total, animal and plant protein varies across population groups with different sociodemographic and eating pattern characteristics. The emerging concepts of eating timing and different eating styles (e.g., intermittent fasting) have been suggested to be relevant for integration into dietary guidelines [4], due to their important roles in body weight and cardiometabolic health [44]. However, the present study did not include measures of cardiometabolic health (e.g., obesity and glycaemic measures), and further research, including randomised controlled trials, examining the different health implications of temporal protein patterns may inform protein intake timing recommendations for use in dietary guidelines. To date, the available evidence on the associations between temporal total protein patterns and cardiometabolic health is mixed, mainly due to the heterogeneity in measuring eating timing and regularity [8]. The inconsistency has also been reported in associations with muscle health, particularly when comparing even vs. skewed temporal protein distribution [45], and therefore, a more standardised approach to measuring eating timing is needed to allow the comparison of results.
It is also worth noting that the present study focuses on protein in isolation, so it does not capture the whole meal containing other foods and macronutrients. Nonetheless, the overall temporal patterning of foods and balance of macronutrients across the day is also likely to be important for health. For example, previous evidence suggested the impact of carbohydrate and fat intake timing on glycaemic control, mainly among adults with impaired glucose metabolism [46]. Future dietary recommendations may also benefit from further investigations on associations between temporal protein patterns and diet quality, given that protein intake is sourced from a variety of foods (e.g. refined grain vs whole grain cereals, lean cuts of meat and poultry vs processed meat high in fat and salt) [47] that may differentially influence overall diet quality [48, 49].
Conclusion
This study identified three distinct temporal patterns of total, plant, and animal protein intake in Australian adults, which have different sociodemographic and eating pattern characteristics. Future research needs to investigate whether temporal protein patterns are associated with diet quality and health outcomes.

Comments (0)