
Remember me
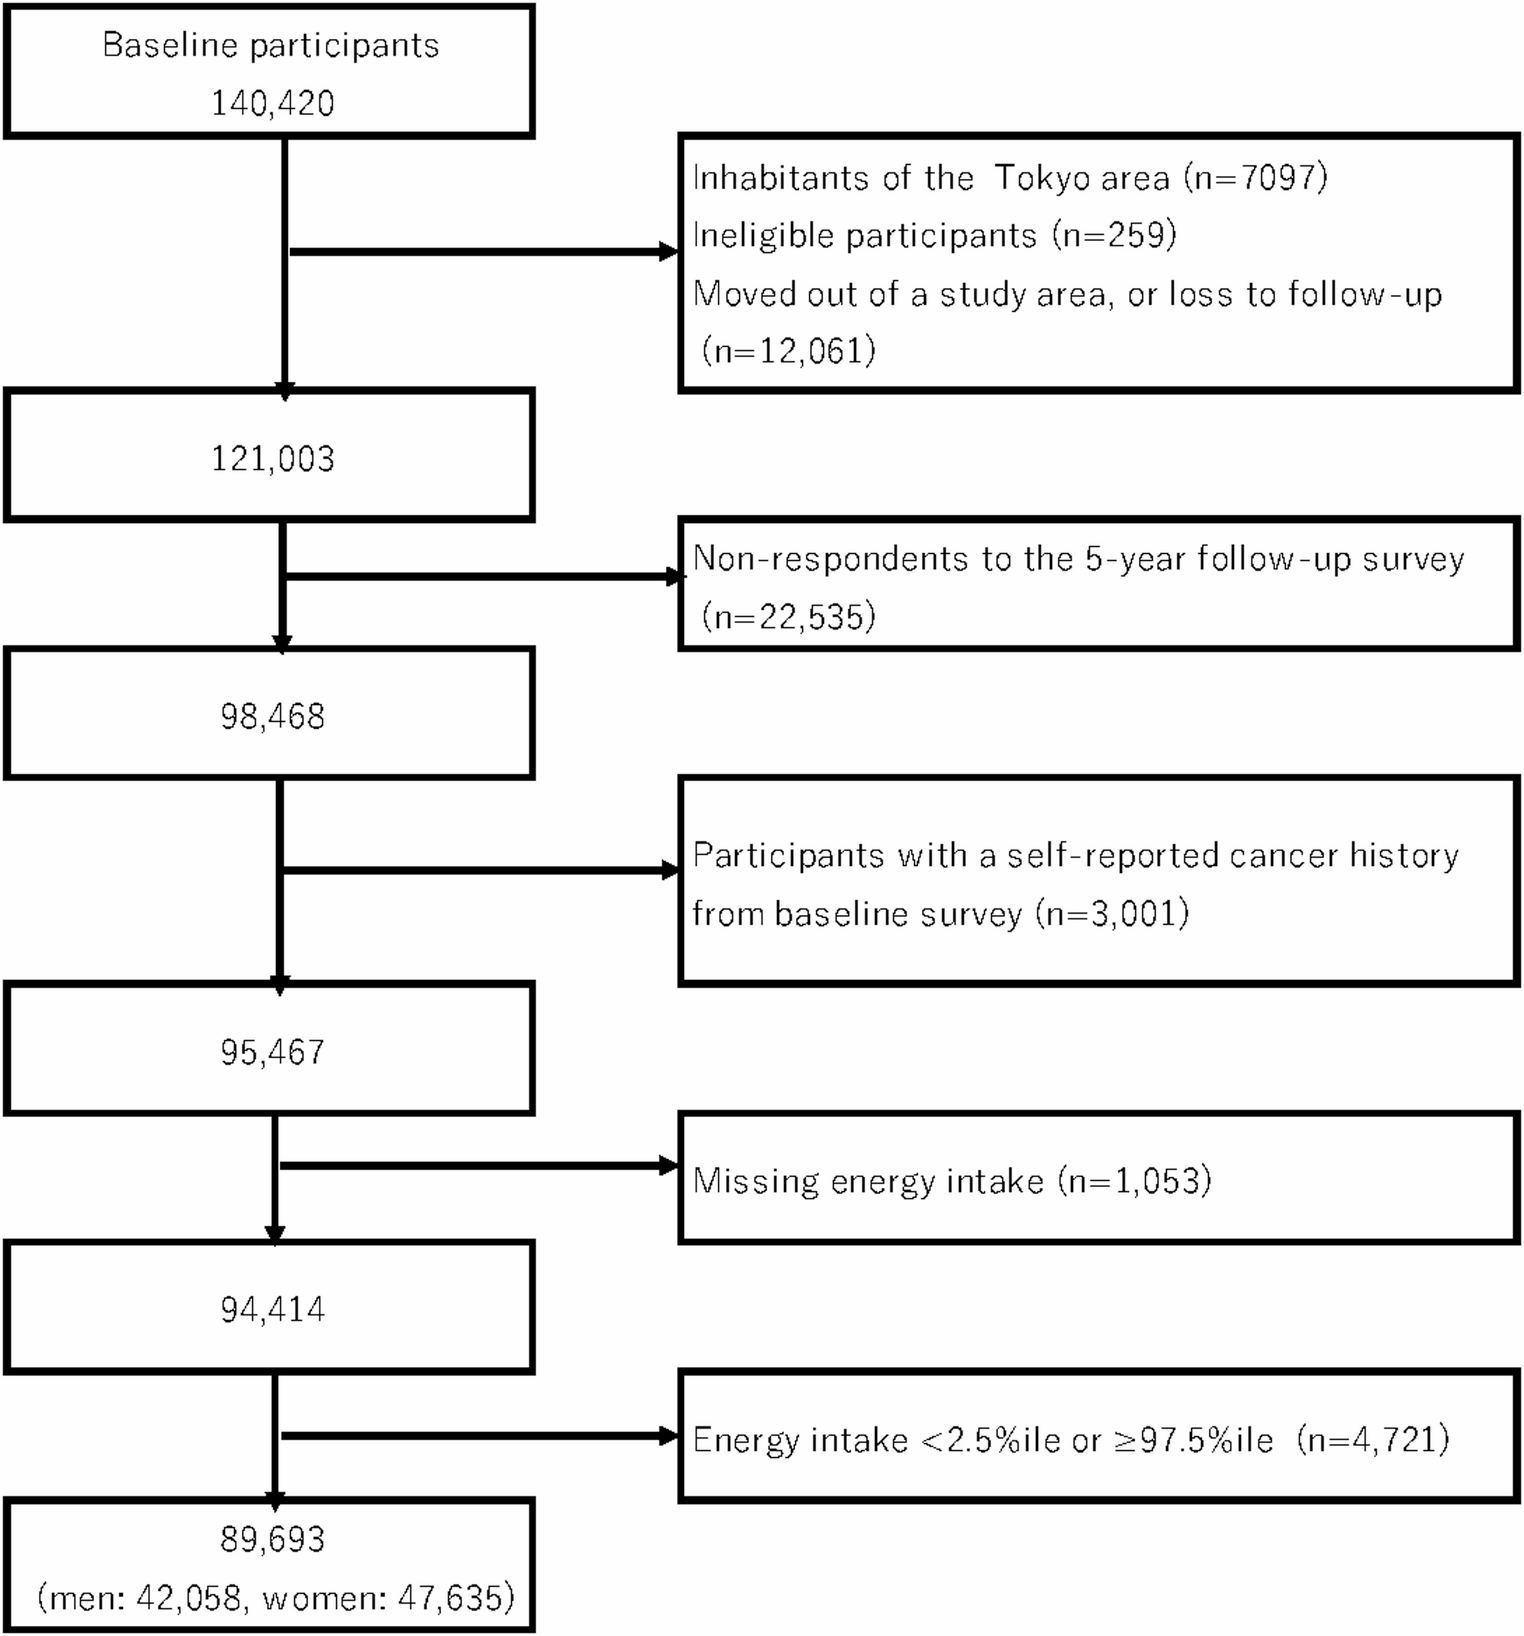
The Japan Public Health Center-based Prospective Study was initiated in 1990 (Cohort I) and 1993 (Cohort II). The study design has been described in detail elsewhere [22]. The study protocol was approved by the institutional review boards of the National Cancer Center, Tokyo. The study population was defined as all registered Japanese residents in 11 public health center areas, aged 40–59 years in Cohort I and 40–69 years in Cohort II. Residents were identified from population registries maintained by local municipalities. The cohort participants were surveyed three times by self-administered questionnaire. Because the 5-year follow-up survey had more comprehensive information on food intake frequency than the first survey, we defined it as the starting point for assessment of dietary exposure in the present analysis. The questionnaire also included items on lifestyle factors (smoking, alcohol drinking, and physical activity, etc.) and medical history, etc. We excluded 19,417 participants from the 5-year follow-up survey due to the lack of cancer incidence data in a single PHC area (n = 7,097); non-Japanese nationality (n = 52); late report of emigration before the 5-year follow-up survey (n = 188); incorrect date of birth (n = 7); duplicate enrollment (n = 12); and death or moving out of the PHC area before the 5-year follow-up survey (n = 12,061). Finally, we targeted a population of 121,003 participants. Of these, 98,468 men and women responded to the questionnaire (response rate 81.4%) and were included in the present study. Participants with a history of all cancer, including non-melanoma skin cancer, were excluded from the analysis (n = 3,001). Furthermore, we excluded 1,053 participants who did not respond to the dietary survey and 4,721 participants whose reported total energy intake was in the lowest 2.5% or highest 97.5% of the distribution. Consequently, 89,693 participants (42,058 men and 47,635 women) remained for the final analysis. (Fig. 1).
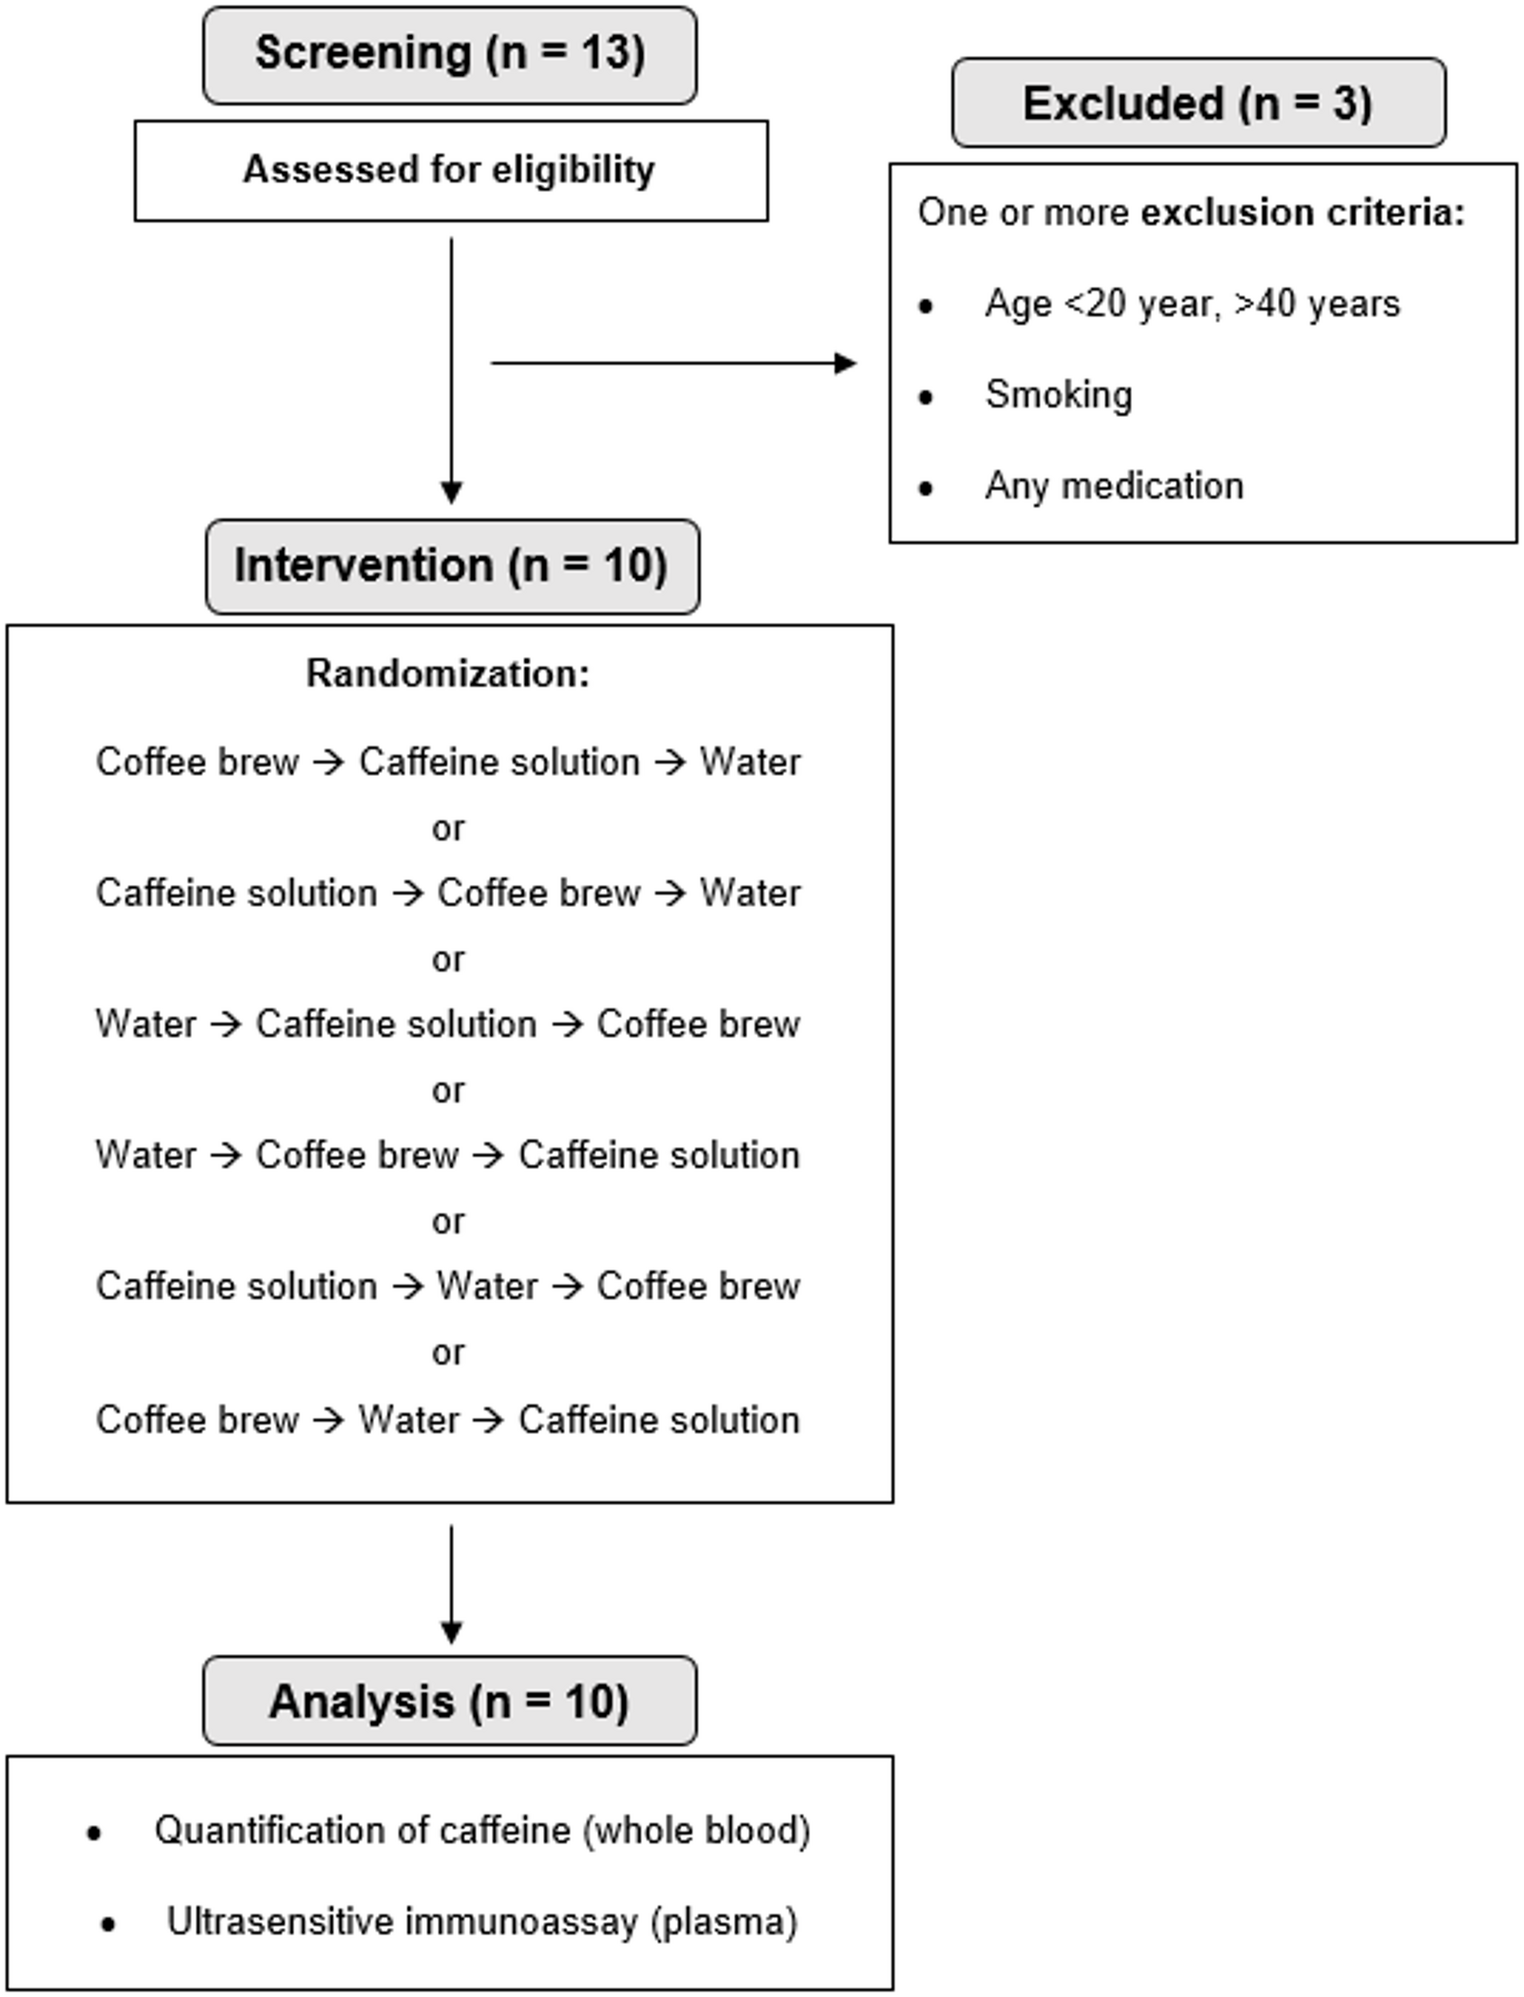
Fig. 1
Flow chart of study participants
Exposure assessment and variablesThe food frequency questionnaire (FFQ) asked about the usual consumption of 138 foods and beverages during the previous year with standard portion/unit sizes and nine frequency categories [23].
Standard portion sizes were specified for each food item in the three amount choices of small (50 percent smaller), medium (same as the standard) and large (50 percent larger). Frequency responses were possible for each food item in the nine choices of ‘rarely’, ‘1–3 days/week’, ‘1–2 days/week’, ‘3–4 days/week’, and ‘5–6 days /week’, ‘once/day’, ‘2–3 times/day’, ‘4–6 times /day’, and ‘7 or more times/day’. The amount of each food consumed (grams/day) was then calculated from these responses. Energy and nutrient intakes, including retinol activity equivalents (μg), β-carotene equivalents (μg), α-carotene (μg), β-cryptoxanthin (μg), lycopene (μg), α-tocopherol (mg), and vitamin C (mg), for individuals were calculated using the Standardized Tables of Food Composition, 7th revised edition [24]. We selected retinol, β-carotene, α-carotene, β-cryptoxanthin, lycopene, α-tocopherol (vitamin E), and vitamin C as antioxidant vitamins for analysis. These nutrients are well recognized for their capacity to neutralize reactive oxygen species and thereby mitigate oxidative DNA damage, which is biologically relevant to carcinogenesis. Carotenoids such as β-carotene, α-carotene, β-cryptoxanthin, and lycopene, as well as α-tocopherol and vitamin C, have strong free radical–scavenging activities, while retinol, a preformed vitamin A, also contributes to antioxidant defense through its role in maintaining membrane stability and modulating cell differentiation. With the exception of lycopene, these nutrients are included in the Japanese Standard Tables of Food Composition (2020 edition) and could be estimated from our validated food frequency questionnaire (FFQ). Lycopene, although not listed in the standard tables, was estimated using an extended carotenoid database developed for the JPHC study. Evaluation of the validity of FFQ-based lycopene intake against dietary records and serum levels showed modest but significant correlations [25]. Previous JPHC studies have provided epidemiological evidence of the association of these antioxidant vitamins with lung, prostate, and liver cancer risk [26,27,28]. Based on this background, we included these vitamins in the present analysis of pancreatic cancer risk.
In 2015, the Ministry of Education, Culture, Sports, Science and Technology in Japan introduced a new conversion factor for β-carotene, replacing the former equivalent of retinol activity equivalents. Accordingly, the current estimation uses the following conversion factor:
$$ \begin & }\;}\;}\,}\mu }\;}\;}\,}\mu })\;}\;}\;\beta }\,(\mu }) \\ & \quad }\;}\;\alpha }\,}\mu })\;}\;}\;\beta }\,(\mu }) \\ \end $$
The FFQ included questions on supplement use, but nutrient intake from supplements was not included in analysis because no comprehensive database for supplements was available.
Validation for nutrition data in the FFQ was evaluated using 14-day or 28-day dietary records, and reproducibility was evaluated using the 5-year follow-up questionnaire twice at an interval of approximately 1 year. Respective Spearman correlation coefficients (energy-adjusted) for validity in men and women were as follows: 0.47 and 0.31 for cohort I and 0.43 and 0.44 for cohort II for retinol equivalent; 0.43 and 0.31 for cohort I and 0.47 and 0.44 for cohort II for β-carotene equivalent; 0.29 and 0.52 for cohort I and 0.50 and 0.52 for cohort II for α-carotene; 0.43 and 0.29 for cohort I and 0.48 and 0.31 for cohort II for cryptoxanthin; 0.29 and 0.37 for cohort II for lycopene; 0.37 and 0.50 for cohort I and 0.24 and 0.37 for cohort II for α-tocopherol; 0.38 and 0.29 for cohort I and 0.46 and 0.44 for cohort II for vitamin C. For reproducibility, the coefficients were moderate: 0.83 and 0.43 for cohort I and 0.53 and 0.52 for cohort II for retinol equivalent; 0.44 and 0.44 for cohort I and 0.56 and 0.55 for cohort II for β-carotene equivalent; 0.48 and 0.42 for cohort I and 0.46 and 0.49 for cohort II for α-carotene; 0.49 and 0.58 for cohort I and 0.52 and 0.44 for cohort II for cryptoxanthin; 0.46 and 0.57 for cohort II for lycopene; 0.65 and 0.49 for cohort I and 0.58 and 0.35 for cohort II for α-tocopherol; and 0.67 and 0.49 for cohort I and 0.58 and 0.48 for cohort II for vitamin C [23, 29,30,31].
Identification of pancreatic cancerCases of pancreatic cancer were determined through active patient information from major local hospitals in each study area and data linkage with population-based cancer registries. Death certificates were used as sources of additional information. We defined pancreatic cancer cases based on the International Classification of Diseases for Oncology, Third Edition codes C25.0–C25.9. Only confirmed primary malignant neoplasms of the pancreas were included, and secondary or metastatic pancreatic cancers were excluded.
Statistical analysisPerson-years of follow-up were calculated for each subject from the starting point to the date of diagnosis, date of emigration from the study area, date of death, or end of the follow-up period (December 31, 2012 for Suita district and December 31, 2013 for all other districts), whichever occurred first. During a mean follow-up of 15.1 ± 4.3 years, 581 pancreatic cancer cases were identified. Hazard ratios (HRs) and 95 percent confidence intervals (CIs) were calculated for the categories of antioxidant vitamin (retinol activity equivalents, β-carotene equivalents, α-carotene, β-cryptoxanthin, lycopene, α-tocopherol, and vitamin C) intake and were adjusted for total energy intake using Cox proportional hazards models based on the residual method in quartiles, with the lowest consumption category as reference. Evaluation using Schoenfeld residuals showed that the proportional hazards assumption was violated for sex. Therefore, all Cox models were stratified by sex and study area (public health center). We conducted the initial analyses by adjusting for study area (10 public health center areas), age (continuous), and sex. In the multivariate model, we further adjusted for smoking status (never, ever, current < 20, 20–39, or ≥ 40 cigarettes/day, or missing), alcohol consumption (< 150 g, ≥ 150 g of ethanol/week or missing), body mass index (< 25.0, ≥ 25.0 kg/m2 or missing), family history of pancreatic cancer (yes or no), medical history of diabetes mellitus (yes or no), coffee consumption (< 1 cup/week, ≥ 1 cup/week), physical activity in metabolic equivalent task-hours/day (continuous), supplement use of multivitamins (no or yes), and energy-adjusted intakes of fish and processed meat (continuous).
In the multivariable models, we adjusted for potential confounders that have been reported in previous prospective cohort and case–control studies as risk factors for pancreatic cancer, including smoking status, alcohol intake, BMI, and history of diabetes. Smoking status was categorized into never, ever, and current smokers (< 20, 20–39, or ≥ 40 cigarettes/day, or missing) [32, 33]. Although cumulative exposure such as pack-years was not available in our baseline survey, this categorization allowed us to account for smoking intensity. BMI was included as a categorical variable (< 18.5, 18.5–24.9, 25.0–29.9, and ≥ 30 kg/m2). Because only 2,417 participants (2.6% of the cohort) had BMI ≥ 30, overweight and obesity were combined to ensure stable estimates. Stratified analyses were performed by sex-specific quartiles, smoking status (current and non-smokers), ethanol intake (unknown, 0, < 150 g/wk, ≥ 150 g/wk) and BMI (< 25.0 or ≥ 25.0 kg/m2) on the basis that antioxidant vitamins are consumed by obesity and smoking-related oxidative stress [1].
All statistical testing was conducted using SAS (SAS Institute, Inc., Cary, North Carolina). All p values were two-sided, and statistical significance was determined at the p < 0.05 level.
Comments (0)