
Remember me
Data were used from the LASA study, which is an ongoing prospective cohort study focusing on the determinants, trajectories and consequences of physical, cognitive, emotional and social functioning of Dutch older adults [32, 33]. The study contains a nationally representative sample of Dutch older adults, who were recruited from three culturally distinct regions in the Netherlands (Amsterdam, Oss and Zwolle). These regions were intentionally selected to capture the major religious and urban–rural variation of the Dutch older population. Participants were randomly drawn from municipal population registers. LASA started in 1992/1993 with a cohort consisting of 3107 participants aged 55 to 85 years old. In 2002/2003, a second cohort and in 2012/2013, a third cohort consisting of 1002 and 1023 Dutch older adults aged 55 to 65 years, respectively, were added to the original sample. Every 3–4 years measurement waves are being conducted. The measurements are performed by trained interviewers, who visited the participants at home and collected data via interviews, self-administered questionnaires and clinical tests. The LASA study was approved by the Medical Ethics Committee of the VU University Medical Center (METC numbers: 92/138, 2002/141, 2012/361, and 2016/301), and all participants provided written informed consent. A detailed description of the sampling and data collection procedures can be found elsewhere [32, 33].
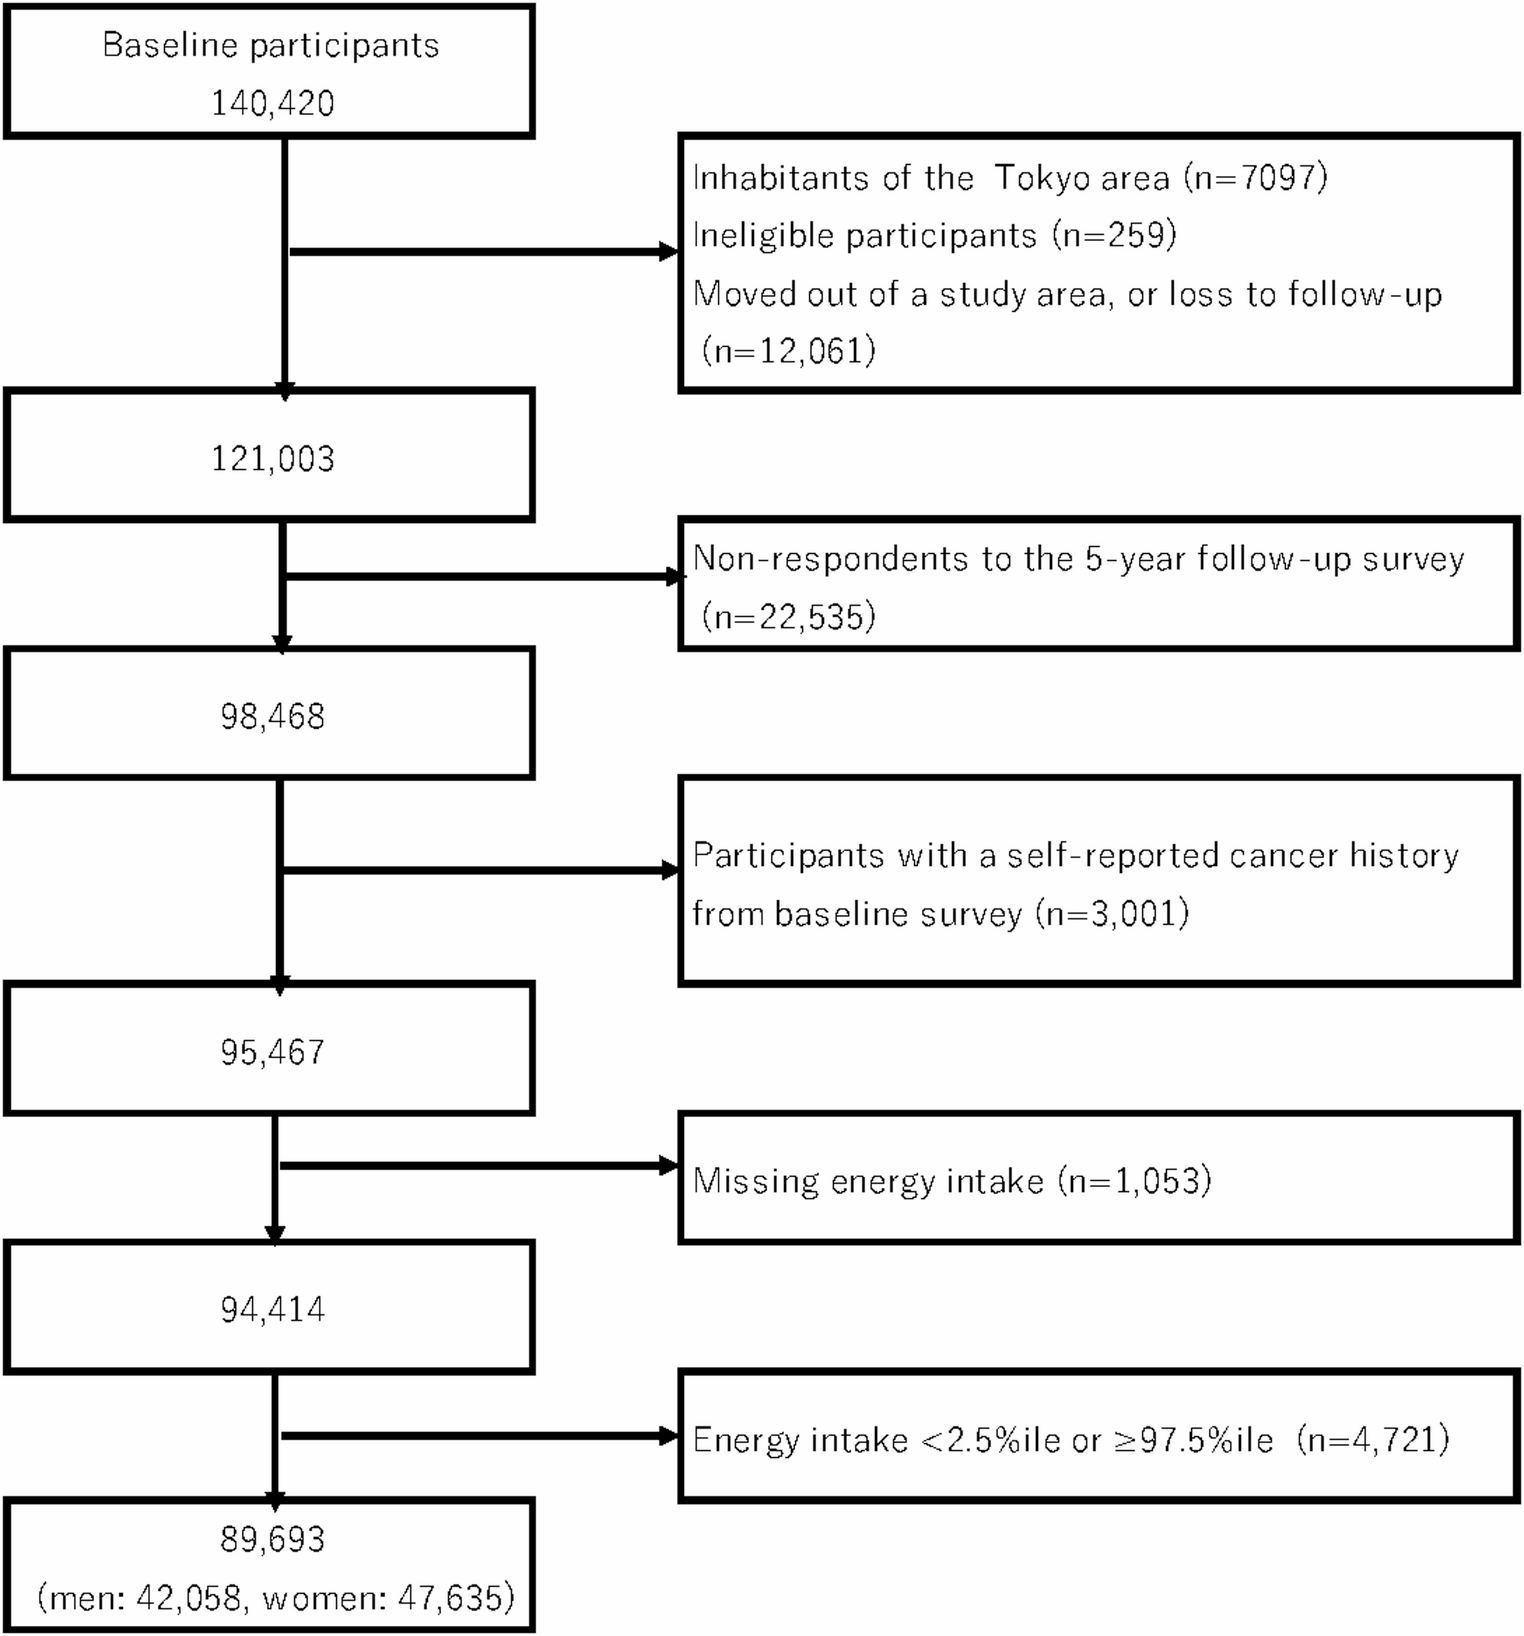
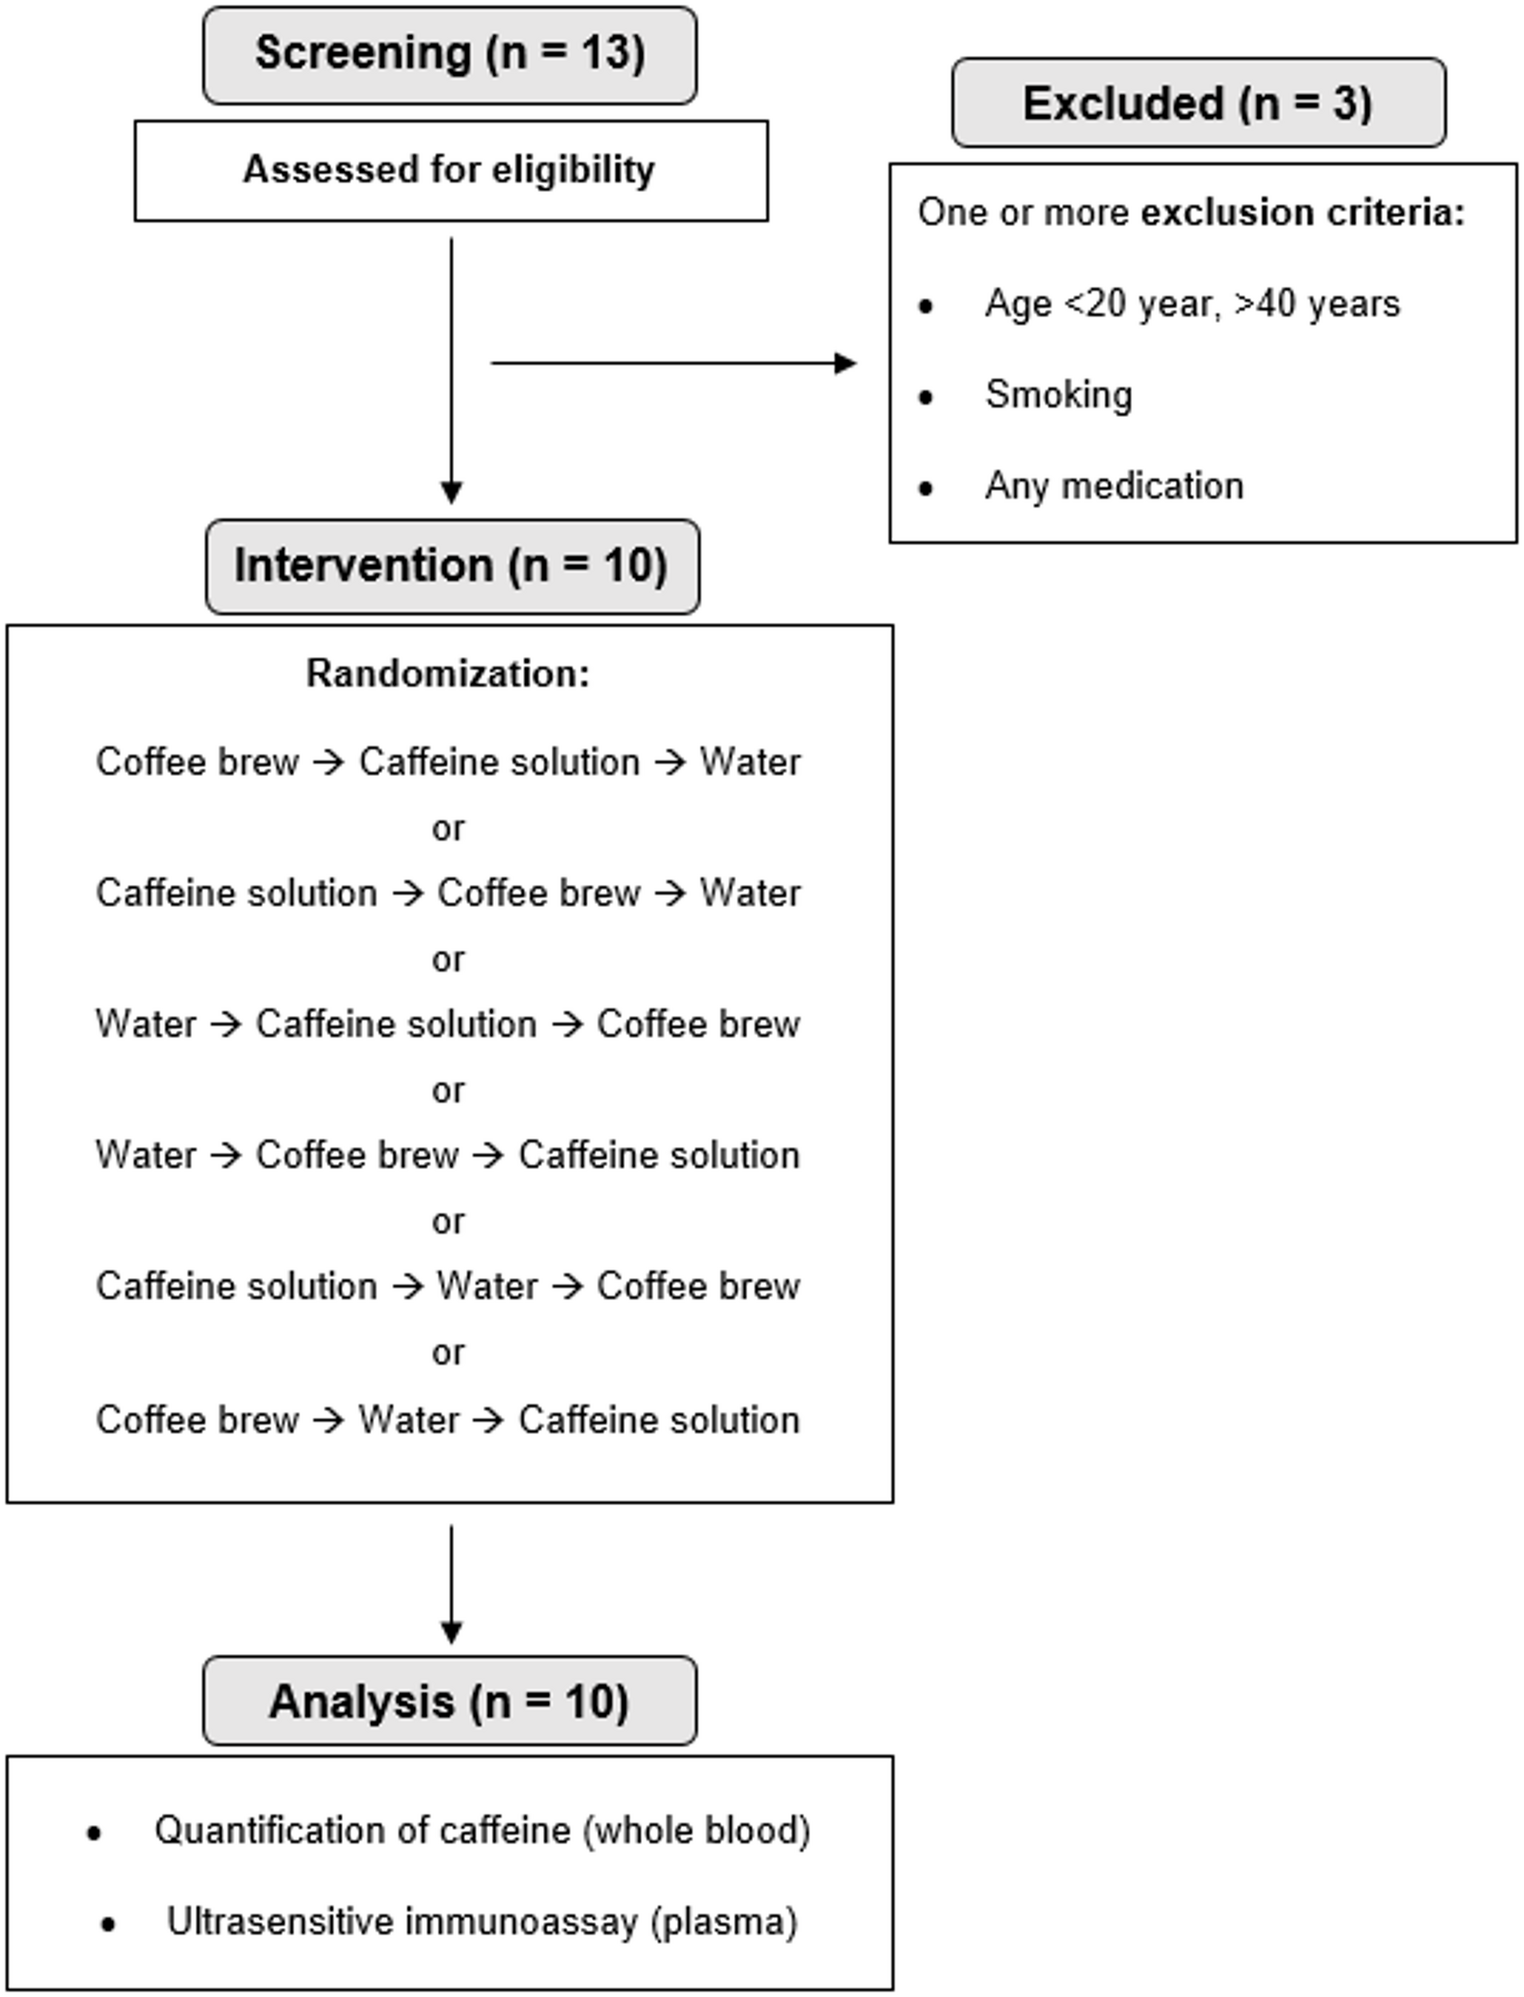
For the present study, participants who completed a Food Frequency Questionnaire (FFQ) as part of the ancillary "LASA Nutrition and Food-Related Behavior Study" which was conducted in 2014/2015 between two regular LASA measurement waves [34, 35], were included. In this ancillary study, a semi-quantitative FFQ was administered to 1439 LASA participants (see Fig. 1 of Winkens et al. [34] for the study flow chart). The 2011/2012 (baseline cohort 1 and 2) and 2012/2013 (baseline cohort 3) measurement waves served as the baseline for cognitive assessments and covariates, with follow-up measurements conducted during the 2015/2016, 2018/2019, and 2021/2022 waves. Of the 1439 participants of the ancillary study, 18 participants with more than 10 missing values on the FFQ questions and 26 participants with implausible energy intake (< 800 kcal or > 4000 kcal for males and < 500 kcal or > 3500 kcal for females [36]) were excluded. Subsequently, 24 participants with a Mini-Mental State Examination (MMSE) score below 24 at baseline in 2011/2013 were excluded to reduce the risk of dietary recall bias due to cognitive impairment, as such scores are indicative of dementia [37]. For each cognitive test, including the MMSE, the Coding Task, the 15-Word Task (15WT), the Digit Span Test, and the Word Fluency Test, participants without any available data (at baseline and follow-up) were excluded. The final analytical samples consisted of 1,371 participants for the MMSE, 1,339 for the Coding Task, 1,341 for the 15WT, 1,363 for the Digit Span Test, and 1,344 for the Word Fluency Test. A flowchart of the study sample is presented in Fig. 1.
Fig. 1
Flowchart with description of the study sample originating from the Longitudinal Aging Study Amsterdam (LASA)
MeasurementsUPF intake (NOVA classification)Dietary intake was evaluated using a 238-item semi-quantitative FFQ, which captured habitual intake over the preceding four weeks. This FFQ, adapted and validated for use in the Dutch population, was originally developed for the Healthy Life in an Urban Setting (HELIUS) study [38]. Its relative validity was examined in a subsample of 88 older LASA participants (mean age 71.9 years) who also completed three 24-h dietary recalls [35]. Results indicated a group-level bias within ± 5% for energy and macronutrient intake, with Pearson correlation coefficients ranging from 0.26 to 0.72 and moderate to high agreement across quintiles. For most micronutrients and food groups, validity was moderate (r = 0.3–0.5), although lower correlations were observed for β-carotene, vitamin B1, fish, and grains [24]. These validity outcomes are consistent with those typically reported for FFQs and are considered acceptable in cohort studies using dietary assessments [39].
Daily intake of each food and beverage item (hereafter referred to as ‘food’) was estimated in grams per day by multiplying reported portion sizes by intake frequency. Each food was subsequently linked to the relevant codes from the Dutch Food Composition Database (In Dutch: NEVO; “Nederlands Voedingsstoffenbestand”), which provides standardized nutritional information for foods commonly consumed in the Netherlands [40]. Each food consisted of several underlying items which were weighted according to their consumption by the Dutch population, based on national food consumption data [38]. For example, the food ‘candy bar’ was linked to seven specific NEVO codes (Mars, Twix, Snickers, Milky Way, KitKat, Lion, and Bounty) with corresponding consumption frequencies of 33.3%, 15.6%, 14.7%, 12.0%, 9.0%, 7.8%, and 7.6%, respectively.
To categorize each food as ultra-processed or not, we applied the NOVA classification system, which groups all foods into four categories based on the degree of processing [11]. NOVA group 1 includes unprocessed and minimally processed foods, such as fresh, dried or frozen vegetables and fruits. Group 2 includes processed culinary ingredients, like molasses and sugar obtained from beet or cane. Group 3 includes processed foods, such as sugared or salted seeds and nuts. Group 4 includes UPFs, like cookies and ice cream. Two researchers independently classified all food and beverage items included in the FFQ based on their level of processing. When uncertainty arose regarding the classification of a specific item, ingredient lists were checked using websites of Dutch supermarkets. Any remaining ambiguities were resolved through additional literature searches and discussion between the researchers.
Next, we calculated, for each FFQ food, the percentage of its underlying NEVO components that were classified as ultra-processed (NOVA group 4). For example, food categorized as UPFs with only one corresponding NEVO code, such as ‘spring roll prepared’ and ‘milk chocolate-full’, were composed of 100% UPF. For food with multiple NEVO codes, we used the weighting as mentioned above to calculate the proportion of the food as UPF. For instance, the FFQ food ‘candybars’, was composed of 100% UPF, because all seven corresponding NEVO codes were classified as UPF. The FFQ food ‘grains for porridge’ was composed of four NEVO codes, including breakfast product ‘Brinta’, ‘meal oat’, ‘breakfast product Albona 7-grains-energy breakfast’ and ‘Flour rice-Bambix’. The corresponding frequency of intake in the Dutch population of these items was 79.7%, 16.4%, 2.3% and 1.6%, respectively. Given that only ‘Flour-rice Bambix’ was classified as UPF, the FFQ food ‘grains for porridge’ was composed of 1.6% UPF.
For each participant, the UPF proportion of each FFQ food was multiplied by the participant’s reported daily intake of that food in grams to calculate the daily intake of UPFs in grams per food. The daily intake of UPFs from all FFQ foods was then summed to determine each participant’s total daily UPF intake in grams. For the present study, overall daily UPF intake was expressed as a percentage of the participant’s total daily intake of foods in grams, with a higher percentage indicating a higher contribution of UPFs to the diet. We used a weight-based rather than energy-based approach to capture non-nutritional components related to food processing, such as additives, and to include UPFs that do not provide energy, such as artificially sweetened beverages [41]. Alcoholic beverages were not included as UPFs, and were excluded from the weight ratio, because alcohol intake is associated with both higher UPF intake and adverse cognitive outcomes [42,43,44]. The association between alcohol intake and adverse cognitive outcomes [42, 44] is likely due to the neurotoxic effects of the ethanol molecule itself or the nutritional deficiencies related to alcohol use [45]. We therefore decided to include alcohol intake as a confounding factor.
Cognitive functionThe dependent variable, cognitive function, was repeatedly measured during the regular LASA measurement waves. Cognitive function was assessed in four domains using five tests: global cognition (MMSE), information processing speed (Coding Task), episodic memory (15-Word Test), and executive function (Word Fluency and Digit Span).
The MMSE is a frequently used screening instrument for global cognitive impairment [46] and was used to measure global cognition. The total MMSE score ranges from 0 to 30 with a higher score indicating better cognitive functioning.
The Coding Task was used to measure information processing speed. The Coding Task used is an adapted version of the Alphabet Coding Task-15 [47]. In this timed letter-symbol substitution task, participants verbally indicated the matching symbol for each letter across three one-minute trials. Verbal instead of written responses were collected to minimize delays from writing and to prevent difficulties in interpreting handwriting during scoring [48]. The mean score on the three trials was used, which ranged from 8.0 to 47.7. A higher score indicates faster information processing speed.
The 15WT was used to measure episodic memory. This test is derived from the Auditory Verbal Learning Test [49]. Participants had to learn 15 words during three trials, instead of the original five trials due to limited interview time, and were asked to recall as many words as possible immediately after every trial and after a 20-min delay. The mean score (range 0–25) of the following three scores was used: the total score on the three trials for immediate recall (range 0–45), the maximum score on the three trials for immediate recall (ranged 0–15) and the total score on the delayed recall (range 0–15). A higher score indicates better episodic memory.
The Digit span test was used to measure executive functioning. This test is a subtest of the Wechsler Adult Intelligence Scale [50]. Participants were asked to recall a set of numbers forwards and backwards whereby the sequence-length of the numbers increased. The total number of correct sets of numbers forwards and backwards was used. The total score ranged from 0 to 30, with a higher score indicating better executive functioning.
The Word Fluency Test, which is a verbal fluency test, was also used to measure executive functioning. During the Word Fluency Test participants were asked to name as many words as possible that begin with the letter D in one minute, which assessed phonemic fluency. The score of this task ranged from 0 to 36. After that, participants were asked to name as many animals as possible in one minute, which assessed semantic fluency. The score of this task ranged from 1 to 40. The mean score of the two tasks was used, and a higher score indicated better executive functioning.
All test scores were standardized into z-scores by using the sample mean and standard deviation (SD) of each test at baseline to be able to compare the different test scores. For tests that consisted of multiple components (15WT and Word Fluency Test), the mean of the individual z-scores was used in the analyses.
CovariatesDuring the first main LASA interview, data were collected on: sex at birth (male/female), birth date in order to calculate age (years) at each measurement wave, and the highest level of education completed by the participant. Education was categorized into low (not completed elementary and completed elementary), middle (lower vocational, general intermediate, intermediate vocational and general secondary education) and high (higher vocational education, college and university). During each measurement cycle, data were collected about partner status, body weight and height, physical activity, alcohol intake, smoking status, depressive symptoms and presence of chronic disease. Partner status was determined by a closed question with the following answer options: no partner, partner co-residing and partner residing outside the household. No partner and partner residing outside the household were categorized into living alone, while partner co-residing was categorized into living with a partner. BMI was calculated by dividing measured body weight in kilograms (kg) by measured body height in meters (m) squared. Body weight was measured to the nearest 0.1 kg using a calibrated bathroom scale (Seca, model 100, Lameris, Utrecht, the Netherlands) and body height was measured to the nearest 0.001 m using a stadiometer. Physical activity was assessed using the LASA Physical Activity Questionnaire (LAPAQ) [51], in which participants were asked about frequency and duration of walking outdoors, biking, gardening, light and heavy household activities and sports in the last 2 weeks. Physical activity was defined as total metabolic equivalent (MET) hours per week spent on all these activities. Alcohol intake was assessed by asking the participants whether they drank alcoholic beverages. If so, they were asked how many days per week they drank these beverages and the number each day. Participants were classified into the following four categories using the alcohol intake index developed by Garretsen [52]: does not drink (0 days/month), light drinking (6 or more drinks on < 1 day/month, 4–5 drinks on < 4 days/month, 2–3 drinks on < 3 days/week, 0–1 drinks/day), moderate drinking (6 or more drinks on 1–3 days/month, or 4–5 drinks on 1–4 days/week, or 2–3 drinks on 3–7 days/week) and (very) excessive drinking (6 or more consumptions on 1–7 days/week or 4–5 drinks on 5–7 days/week). Smoking status was asked and divided into never, former and current smoker. Depressive symptoms were measured with the Center for Epidemiologic Studies Depression Scale (CES-D) [53], which is a self-reported symptom rating scale. The total score ranged from 0 to 60, with a higher score representing a higher level of depressive symptoms. The presence of chronic diseases was self-reported and defined as the number of chronic diseases from frequently occurring somatic chronic diseases in the Netherlands, including chronic non-specific lung disease, cardiac disease, peripheral arterial disease, diabetes, cerebrovascular accident or stroke, arthritis and cancer [54]. The total score ranged from 0 to 7. This score was categorized into no chronic disease, one chronic disease and two or more chronic diseases. Finally, total energy intake (kcal/day) and diet quality were based on the FFQ assessed during LASA ancillary study. Diet quality was defined as adherence to the Dutch Healthy Diet index 2015 (DHD15-index) [55]. The index is used to assess adherence to the Dutch dietary guidelines [56], includes 13 components (vegetables, fruits, whole grain products, legumes, nuts and seeds, dairy, fish, tea, fats and oils, red meat, processed meat, sugar-sweetened beverages and fruit juices, alcohol) instead of the original 15 components. Information on salt and type of coffee consumption was unavailable, so these were excluded. Each component was scored from 0 to 10, giving a total range of 0 (no adherence) to 130 (full adherence) [55].
Statistical analysesDescriptive statistics were performed to characterize the total study sample (comprised of participants with an MMSE baseline measurement) and stratified by quartiles of overall UPF intake. Continuous variables were presented as means with standard deviation (± SD) when normally distributed or as medians with interquartile range (IQR) when not normally distributed. Categorical variables were summarized as frequencies and percentages.
Linear mixed model analyses were used to examine the association between quartiles of overall UPF intake (%) and repeated measures of Z scores for the various cognitive measures. UPF intake, expressed as a percentage of total daily intake in grams, was categorized into quartiles consistent with previous studies [23, 26, 29], which resulted in the following categories: 1.5–13.2%, 13.2–18.5%, 18.5–24.9% and 24.9–72.4%. Quartiles were used to allow comparison with previous literature and to capture potential non-linear associations. Following earlier approaches [57, 58], linear mixed model analyses were used to model both level and change in cognitive function by quartiles of overall UPF intake with the first quartile used as the reference. The level models tests the association between UPF intake and cognitive function over time, thus capturing both cross-sectional and longitudinal associations. Age and age2 at each measurement, along with other covariates, were included in the model: Cognition = Intercept + UPF quartile + Age + Age2 + other covariates + Random effects + Error. To assess the association between UPF intake and cognitive decline with aging, change models were used in which an interaction term between UPF quartiles and age at each measurement was included: Cognition = Intercept + UPF quartile + Age + (UPF quartile × Age) + Age2 + Other covariates + Random effects + Error. This interaction term assessed whether the rate of cognitive change varied by UPF intake during aging. In a previous study using the same approach [58], we performed a sensitivity analyses to assess the robustness of our findings by including time of assessment instead of age at each measurement for the change models, while adjusting for baseline age and baseline age2, to allow an estimation of the rate of cognitive decline per study wave, rather than per age year. As this yielded the same results, we did not perform this sensitivity analysis again. Models included a random intercept for repeated measurements and a random slope for age when it improved model fit (included in all models except for the Word Fluency Test). Improvement in model fit was evaluated using likelihood ratio test with an unstructured covariance matrix for the random effects. Z scores were analyzed continuously and model assumptions were verified and met via analyses of residuals using histograms, Q-Q plots and scatterplots. All available data were included, as mixed-effects models accommodate missing values.
For all analyses, three hierarchical models were fitted. Model 1 adjusted for age at each measurement, age squared [57], sex and education. Model 2 additionally adjusted for partner status, total energy intake, BMI, physical activity, alcohol intake, smoking status, depressive symptoms and presence of chronic diseases. Model 3 further adjusted for diet quality. Time-independent covariates included sex, education, total energy intake and diet quality; time-dependent covariates included age, partner status, BMI, physical activity, alcohol intake, smoking status, depressive symptoms and presence of chronic diseases. In the fully adjusted models, interaction with sex was tested, as prior research suggested potential sex differences in the association between UPF intake and cognitive decline, with some associations only observed in females [23]. Interaction between quartiles of UPF intake and sex was tested in the fully adjusted level models, while in the fully adjusted change models three-way interaction between quartiles of UPF intake, sex and age was tested. If at least one of the interaction terms in the hierarchical models was statistically significant (p-value < 0.05), all three adjustment models for that specific cognitive test were stratified by sex, while analyses for the other cognitive tests and model types (level or change) were not stratified. To visualize cognitive trajectories across UPF intake quintiles, predicted values from the fully adjusted change models, including the interaction with age, were plotted against age. Age and age2 were centered at 55 years since that is the starting age of LASA cohort. Only the lowest and highest quintiles were depicted, illustrating contrasts in cognitive function and age-related decline associated with lowest versus highest UPF intakes for the sample.
One sensitivity analysis was performed using the fully adjusted model, by creating an additional UPF weight ratio in which bread was excluded to test the robustness of the results. It is difficult to classify breads as either UPF or not according to NOVA [11], as the exact interpretation of the terminology used, such as mass-produced, is not self-evident [59]. Moreover, a previous study using data from the UK Biobank found that high bread intake was associated with decreased risk of dementia [60]. In addition, Dutch people consume a lot of bread [61].
All statistical analyses were performed using SPSS Statistics (version 28, IBM Corp, Armonk, NY, USA) for descriptive statistics and Stata Statistical Software (release 17, StataCorp LLC, College Station, Texas, USA) for linear mixed models. For all analyses, a two-sided p-value of < 0.05 was considered statistically significant.
Comments (0)