
Remember me
Lactic acid bacteria were successfully isolated from plain yoghurts (MI, Z), lactose-free yoghurt (MILM), bio yoghurt (ZB), Greek yoghurt (G), and goat’s milk yoghurt (K), as well as apple-cinnamon lactose-free Greek yoghurt (T) and layered blueberry yoghurt (N). In case of plant-based fermented alternatives, lactic acid bacteria were isolated from coconut milk-based vegan yoghurt (ZK), the soy-based plain yoghurt (JS), and almond-based yoghurt (MM). A total of 40 LAB isolates were obtained during the isolation process. However, it should be noted that lactic acid bacteria were not be recovered from six fermented products (JBL, JB0, MA, C, D, A).
Identification by MALDI-TOF MSStarter cultures are typically comprised of a mixture of multiple species. Based on the results obtained from MALDI-TOF analysis, Streptococcus salivarius ssp. thermophilus, Lactobacillus delbrueckii, Lacticaseibacillus rhamnosus, Lactiplantibacillus plantarum, and Lactobacillus acidophilus were successfully isolated and identified (Table 3). According to the results obtained, at the time of the analysis, certain products contained only a single predominant lactic acid bacterium species in high numbers. In the T, ZB, and ZK samples, Streptococcus salivarius ssp. thermophilus was detected in significant quantities. In contrast, multiple species were successfully identified in the MI, MILM, and G samples. The probiotic effects of live-culture products have been well-documented in the literature (Marco et al. 2017).
Table 3 Results of the identification of lactic acid bacteria isolates using MALDI-TOF MS. Reliability scores: high (2.00–3.00), isolates identified at the species level; low (1.77–1.99), isolates identified at the genus levelA comparison of dairy-based and plant-based products revealed no significant differences in the occurrence of the isolated and identified species. In one vegan product (JS), Lactiplantibacillus plantarum was identified, irrespective of the fruit-flavoured or plain nature of the product. In the MILM product, this species was detected alongside Lacticaseibacillus rhamnosus and Streptococcus salivarius ssp. thermophilus, despite being primarily used in the fermentation of plant-based products due to its enhanced growth in plant-derived media. However, it also thrives in dairy-based fermented products (Horáčková et al. 2022).
FT-IR typing and LDA analysisThe values obtained from the analysis of FT-IR absorbance data using linear discriminant analysis (LDA) are presented in Figs. 1, 2, and 3. The differentiation of the isolates previously identified at the species level by MALDI-TOF was successfully achieved based on the distances between clusters represented in the two-dimensional coordinate system, according to their carbohydrate composition.
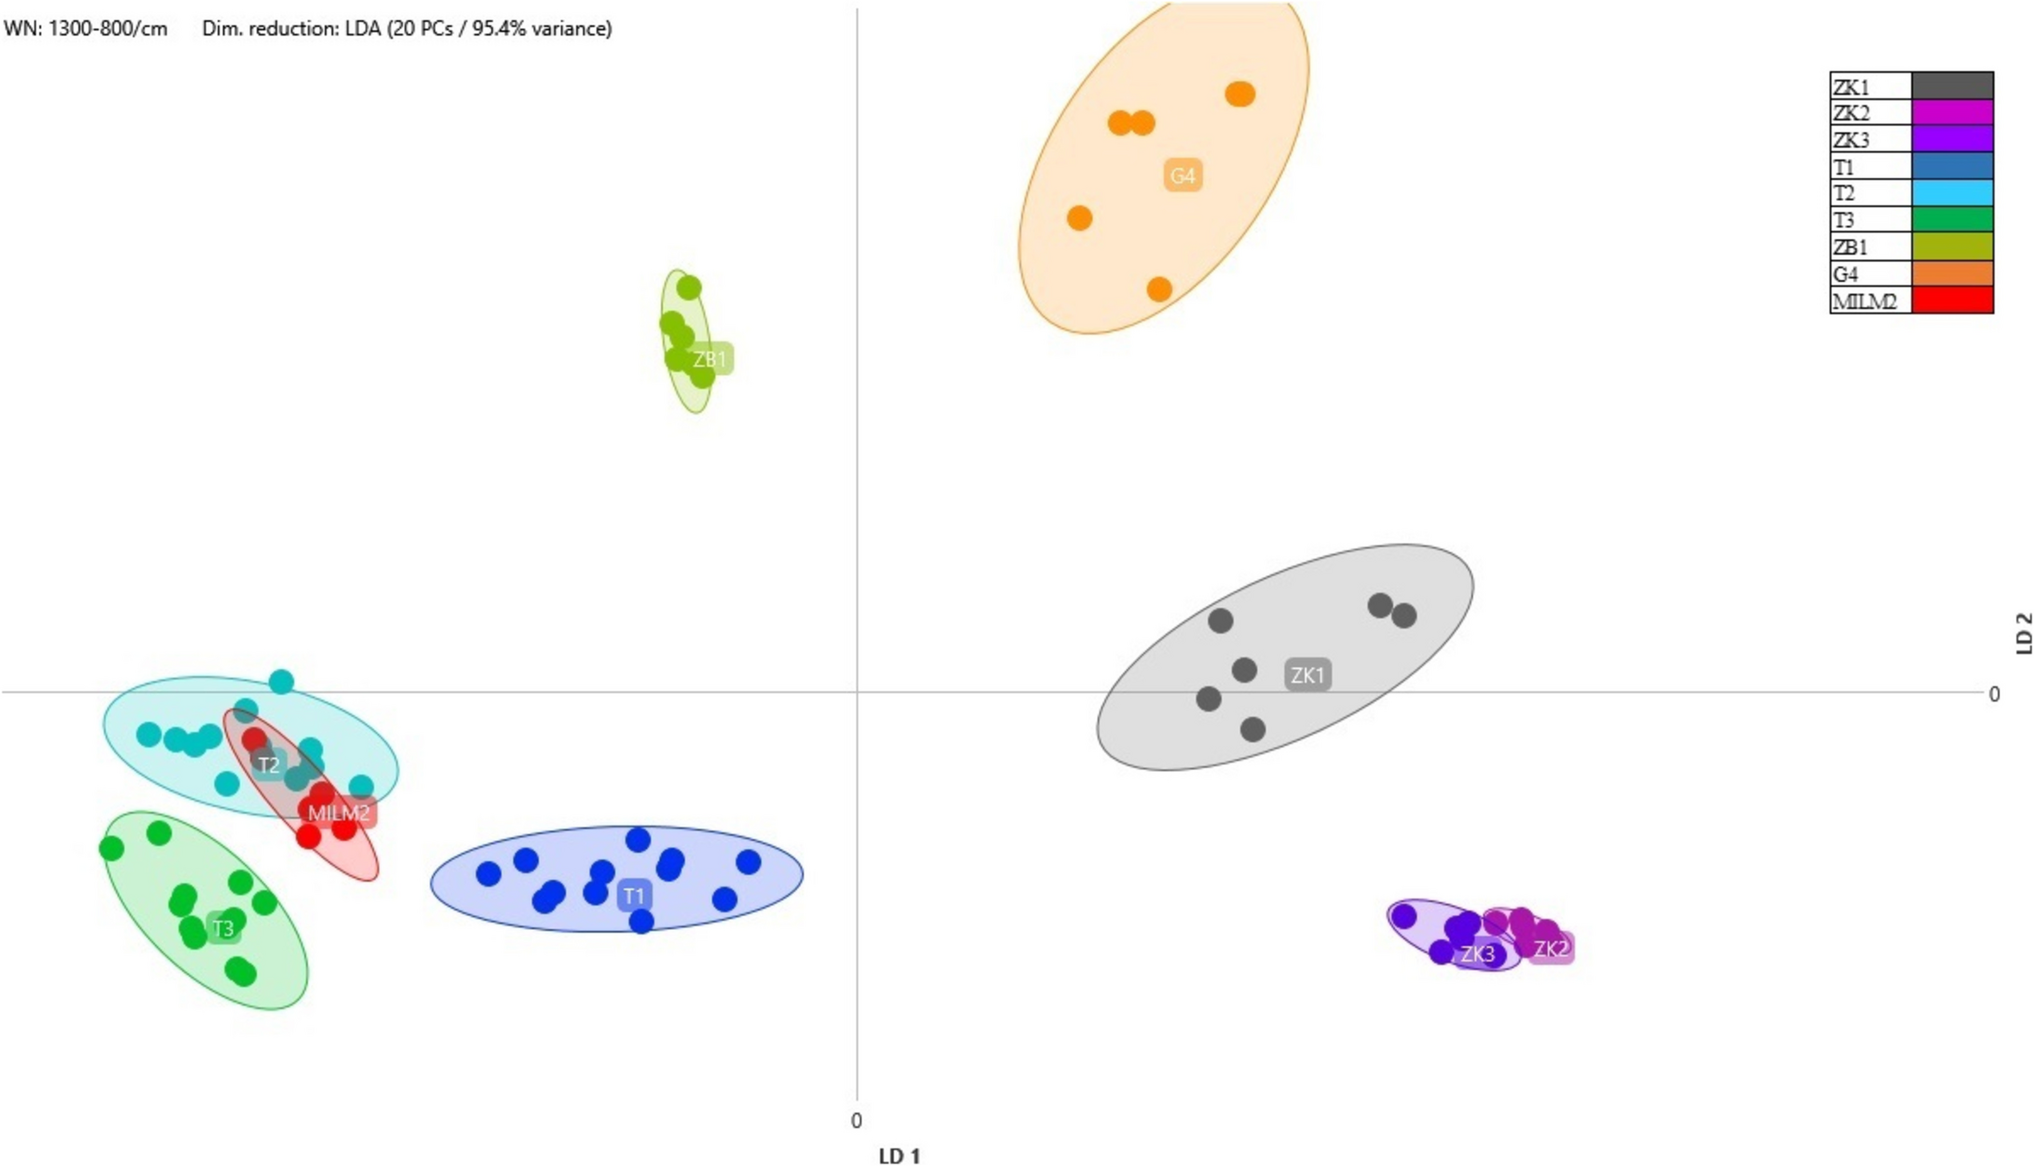
Fig. 1
Comparison of Streptococcus salivarius ssp. thermophilus strains isolated from different samples using LDA at a 95.4% variance level. The colour coding of the individual isolates is as follows: ZK1, grey; ZK2, violet; ZK3, purple; T1, dark blue; T2, light blue; T3, dark green; ZB1, light green; G4, orange; MILM2, red
Fig. 2
Comparison of Lacticaseibacillus rhamnosus strains isolated from different samples using LDA at a 95.3% variance level. The colour coding of the individual isolates is as follows: N1, grey; N2, purple; N3, purple; N4, violet; G1–G3, shades of blue; MILM1, shades of blue; M1, yellow; MI2, orange; MI3, red; MM1–MM4, shades of green; MM5, brown
Fig. 3
Comparison of Lactiplantibacillus plantarum strains isolated from different samples using LDA at a 95.2% variance level. The colour coding of the individual isolates is as follows: JS1, grey; JS2, purple; JS3, bluish purple; JS4, dark blue; JS5, light blue; MILM3, green; MILM4, yellow-green; MI4, orange; MI5, red
A total of nine strains of Streptococcus salivarius ssp. thermophilus were isolated, designated as ZK1, ZK2, ZK3, T1, T2, T3, ZB1, G4, and MILM2 (Table 3). The outcomes of the linear discriminant analysis performed on the Streptococcus salivarius strains’ absorbance data, isolated from five distinct yoghurt samples using Fourier-transform infrared spectroscopy, are presented in Fig. 1.
The proximity of two isolates in the plot indicates the similarity of their metabolic profiles. For each isolate, an occurrence zone was delineated around the data points following a minimum of three independent sample preparations and measurements. In instances where the zones overlap, it can be deduced that the isolates belong to the same strain, as evidenced by the overlap observed in ZK2 and ZK3, or MILM2 and T2. Conversely, where zones do not overlap, there is a significant difference in metabolic products (e.g. T1, T2, and T3). The greater the distance between clusters, the more pronounced these differences are (e.g. G4 and T1).
Sixteen strains of the Lacticaseibacillus rhamnosus species were successfully isolated: N1, N2, N3, N4, G1, G2, G3, MILM1, MI1, MI2, MI3, MM1, MM2, MM3, MM4, and MM5 (see Table 3 for details). The linear discriminant analysis (LDA) results demonstrated that the zones of multiple isolates from different samples overlapped, indicating close similarity. For instance, overlaps were observed between MM3 and MM5, G1 and G2, and MILM1 and MI3 (Fig. 2). Given that the clustering results primarily correlate with the product groups of different manufacturers, it is likely that the producers use the same starter cultures for fermenting their respective products. This finding is consistent with the conclusions of earlier studies, which indicate that the production of industrial yoghurt and probiotic dairy products frequently relies on standardised microbial consortia. The rationale behind this is to ensure consistent fermentation performance and product quality.
Nine strains of the Lactiplantibacillus plantarum species were detected. Based on the linear discriminant analysis (LDA) results, the isolates were classified into three main clusters, of which a high degree of similarity was observed among the JS1, JS2, JS3, and JS4 samples, while JS5 exhibited distinct characteristics. The third cluster consisted of the MILM3, MILM4, MI4, and MI5 isolates (Fig. 3). The results suggest that specific L. plantarum strains are consistently present in certain product groups, possibly reflecting standardised fermentation practices by manufacturers. The distinct separation of JS5 may indicate strain variation due to differences in fermentation conditions, raw material composition, or additional microbial interactions. Further analyses could provide deeper insights into the functional differences between these clusters and their potential impact on product characteristics, such as probiotic functionality, flavour development, and metabolic activity.
Antibiotic susceptibility testingAntibiotic susceptibility testing was performed on 15 isolates in three replicates, selected to represent the identified species and, where possible, derived from different products. The results of the inhibition zone test are presented in Table 4. For oxacillin, isolates belonging to Lactiplantibacillus plantarum, Lactobacillus delbrueckii, and Streptococcus salivarius ssp. thermophilus exhibited similar sensitivity, with inhibition zone diameters ranging from 20 to 23 mm. However, sensitivity differences were observed among Lacticaseibacillus rhamnosus strains, with the N4 sample being resistant to oxacillin, which correlates with the FT-IR analysis shown in Fig. 2, where it appears as an outlier, distinct from other clusters. The inhibition zones for the MI2 and MILM1 samples were considered to demonstrate transitional sensitivity. Based on the LDA (linear discriminant analysis) figure, they were grouped separately from the other oxacillin-sensitive strains, such as G2, G3, MM4, and MM5. The G5 sample, representing Lactobacillus acidophilus, demonstrated the highest sensitivity to this antibiotic.
Table 4 Results of disc diffusion susceptibility tests (Kirby–Bauer) with lactic acid bacteria strains (n = 45), after 48 h. Notations: S sensitive, I intermediate, R resistantAll the strains tested exhibited sensitivity to penicillin, and by the oxacillin tests, the G5 Lactobacillus acidophilus isolate demonstrated the highest level of sensitivity. Based on the results for both antibiotics, it can be concluded that Lactobacillus acidophilus may be particularly sensitive to cell wall synthesis inhibitors; however, further investigations are required to confirm this statement. When testing clindamycin, variable results were obtained for the lactic acid isolates. For Lacticaseibacillus rhamnosus, the MILM1 and MI2 isolates demonstrated reduced sensitivity and resistance compared to the other samples, including G2, G3, N4, MM4, and MM5 isolates. Streptococcus salivarius ssp. thermophilus strains exhibited sensitivity to clindamycin, albeit to varying extents, with the ZB1 isolate demonstrating greater sensitivity than the others. In the case of Lactiplantibacillus plantarum, the antibiotic induced inhibition zones of varying sizes across three isolates. Of particular interest is the observation that the MILM3 (highly sensitive) and MI4 (transitionally sensitive) isolates were closely related according to Fig. 3, yet they exhibited significant differences in sensitivity to clindamycin. The inhibition zones induced by tetracycline also demonstrated variability. Based on the response to tetracycline, the microbes could be divided into two groups: sensitive or resistant, with no strains showing transitional inhibition zone sizes. The resistant strains (MI2, G2, JS2, MI4, MILM3, Z2, ZB1, MILM2) and sensitive strains (G3, N4, MILM1, MM4, MM5, G5, G4) were distributed approximately evenly. The G2 and G3 strains showed different sensitivity to Tetracycline.
Association between FT-IR spectral clusters and antibiotic susceptibilityThe results of the relationship between FT-IR spectroscopy and antibiotic susceptibility profiles are shown in Table 5. Statistically significant associations were observed between FT-IR spectral groups and resistance patterns for three antibiotics tested (oxacillin, clindamycin, and tetracycline; p < 0.001). Cramér’s V values ranged from 0.627 to 0.819, indicating strong associations. These findings suggest that strains with similar FT-IR profiles tend to exhibit similar antibiotic resistance characteristics. These findings indicate that strains with similar FT-IR profiles tend to exhibit similar antibiotic resistance characteristics. All antibiotics were tested at concentrations recommended by clinical diagnostic guidelines. Since all isolates were susceptible to penicillin at the applied dose, the Chi-square test could not be performed for this antibiotic. The contingency table contained cells with zero observed and/or expected frequencies across categories, thus violating the test’s hypothesis.
Table 5 Statistical associations between FT-IR spectral clusters and antibiotic sensitivity, based on the Chi-square test, Fisher’s exact test, and Monte Carlo simulation at a 95% confidence interval
Comments (0)