
Remember me
The comparison of the influence of different MWCNTs on the OD in microplate cultures showed significant stimulation in the case of all tested MWCNTs in comparison to the control (Fig. S1, from 125 to 1000 µg/mL for NC, from 250 to 1000 µg/mL for SA and 500 µg/mL for ChT). Moreover, the observed colour of the cultures corroborated the hypothesis that high concentrations of MWCNTs stimulated pyocyanin production. However, the viability values were not entirely in line with the OD measurements, which might be caused by a reduction in the assay’s sensitivity caused by a high concentration of black MWCNTs in wells (Augustyniak et al. 2022). The significant stimulation of the viability was noted concerning the control in the case of 500 µg/mL for NC, 250 µg/mL for SA and 1000 µg/mL for ChT. On the other hand, lower signals (but not significantly different from the control) were noted for 1000 µg/mL for NC and 500 and 1000 µg/mL for SA. It could be accounted for by fluorescence obstruction in a 96-well plate caused by MWCNTs.
Based on the most promising results (expressing the highest stimulation), the same assays were performed in the cultures led in the Petri dish in a volume of 10 mL. The selected concentrations of MWCNTs for these experiments were 1000 and 500 µg/mL. The OD (measured in a way that reduces the risk of aspiration of CNT) was significantly increased in the samples with NC 1000 µg/mL, compared to the control (Fig. S2). Interestingly, other types of MWCNT did not cause significant differences from the control. Similar results were obtained in the case of viability. It was significantly higher in the cultures with NC 1000 µg/mL, compared to the control. On the other hand, pyocyanin production (Fig. 1) was significantly stimulated in the case of NC 1000 and 500 µg/mL, SA 1000 and 500 µg/mL and ChT 1000 µg/mL, which indicated that the level of culture viability in the resazurin assay was not proportional to pyocyanin production. The most pronounced stimulation was noted for 1000 µg/mL of SA, reaching 88.79 µg/mL, compared to the control, producing only 7.12 µg/mL of pyocyanin. Based on these results, the pyocyanin production process was optimised using SA MWCNTs, as they had shown the highest potential to stimulate pyocyanin production effectively. TEM images presented in Fig. 1 (right panels) show that SA MWCNT morphology differs from NC MWCNTS and ChT MWCNTs. It is composed of a very straight and rigid structure with tiny inner space and an outer mean diameter of ~ 90 nm. Their diameter is also the most developed, compared to other samples. NC MWCNTs and ChT MWCNTs are typical spaghetti-like structures with outer mean diameters of ~ 15 and ~ 25 nm, respectively.
Fig. 1
The influence of different commercial MWCNTs on pyocyanin production of P. aeruginosa in Petri dish cultures (37 °C, 48 h) (left panels) and their corresponding TEM images (right panels)
Optimisation of pyocyanin production using MWCNTs as process stimulatorsThe experiments conducted according to the DoE plan enabled the fitting of the function and assessing which factors significantly influenced pyocyanin production (Fig. 2a). The obtained fit was high and equalled R2 adj. = 0.944. Among the factors significant for pyocyanin production were the temperature (although only quadratic), MWCNT concentration (linear and quadratic) and the interaction between the two factors (Fig. 2b). The optimal MWCNT concentration and process temperature were calculated, and they equalled to 812.13 µg/mL and 32 °C with predicted pyocyanin concentration of 421.02 μg/mL. The obtained temperature agreed with our previous optimisations of pyocyanin production (Honselmann genannt Humme et al. 2024).
Fig. 2
Pyocyanin production a DoE optimisation; b Pareto chart; and c pyocyanin adsorption on MWCNT
Pyocyanin adsorption on MWCNTThe concentration of pyocyanin extracted after incubation with MWCNTs (without bacteria) was lower in comparison to the control (around 80% of the control) (Fig. 2c). Further separation attempts performed on the MWCNT pellet released only 3% of the control concentration. Based on these findings, it was concluded that pyocyanin is partially adsorbed on MWCNT. However, the fact that complete extraction of pyocyanin from the MWCNT pellet was impossible may indicate chemical MWCNT-pyocyanin binding. Pyocyanin may induce the creation of H2O2, e.g. by oxidating NADPH in cells (Abdelaziz et al. 2023). Interestingly, ROS may increase the sorption capabilities of MWCNTs, as was shown on fulvic acids, by treating this carbon nanomaterial with H2O2 (Czech 2017). The adsorption of pyocyanin on various materials was previously reported, e.g. on clays (including montmorillonite, sepiolite and palygorskite) or carbon materials, which additionally confirms this possibility (Fashina and Deng 2022; Hirakawa et al. 2022). Based on the obtained results, it can be hypothesised that partial adsorption of pyocyanin on MWCNT may be one of the reasons for elevated pyocyanin production. Pyocyanin production is associated with quorum sensing (QS) in P. aeruginosa, regulated primarily by autoinducers such as Acyl-homoserine lactone (AHL) and Pseudomonas quinolone signal (PQS). Therefore, there is a possibility that the adsorption of pyocyanin and/or these signals could also overregulate production (Abdelaziz et al. 2023). PQS signals affect the operation of LasR-LasI and RhlR-RhlI systems, which contribute to increasing levels of Pseudomonas autoinducers (PAI-1 and PAI-2), positively affecting phz operons (Mudaliar and Bharath Prasad 2024). On the other hand, reducing the quantity of another AHL (3-oxo-C12-HSL) could remove the inhibitory factor of phenazine synthesis (Sun et al. 2016). Lastly, the sorption of pyocyanin could reduce the negative signal in a feedback loop, forcing cells to overproduce the pigment. Since phenazine synthesis pathways in P. aeruginosa are tightly associated with QS, more than one mechanism may be involved in the observed outcome (Mudaliar and Bharath Prasad 2024). Nevertheless, the mechanisms underlying the stimulation of PYO production need to be verified in further research, preferably in transcriptomic analyses, which were outside our study’s goal.
Basic characterisation of the optimised cultureThe optimised and control cultures were compared based on biomass/substrate, product/biomass and product/substrate yields at different time points (24, 48 and 72 h) (Fig. S3a). Differences were noted for biomass/substrate yield at 24 and 48 h; it was higher for the control culture than the optimised culture and 72 h higher for the optimised culture than for the control. The more pronounced differences were noted in the case of product/biomass and product/substrate yields. Product/biomass yield reached 35.44 µg of PYO/mg of biomass and 117.02 µg of PYO/mg of biomass for the control and optimised culture after 72 h, respectively (around 3.3 times higher for the optimised culture). Product/substrate yield reached 7.08 µg of PYO/mg of glycerol and 20.41 µg of PYO/mg of glycerol for the control and optimised culture after 72 h, respectively (around 2.9 times higher for the optimised culture).
The monitoring of the OD (Fig. 3a) revealed a lasting trend of increased OD values in the case of MWCNT-supplemented culture, compared to the control. However, the viability of the cells was changing (Fig. 3b). The stimulative effect of MWCNT on the viability of cells was noted at the 2nd, 10th, 12th and 24th h of the incubation. The viability was higher in the control culture at the 4th, 48th and 72nd h of the incubation. Such results indicate that the cells incubated with MWCNT reached their viability peak after 24 h and proceeded with the death phase much faster than the control culture. It was previously reported that adding MWCNTs to Geobacter cocultures resulted in an accelerated metabolic rate (Zheng et al. 2020). The pyoverdine monitoring (Fig. S3b) revealed increased fluorescence values in the control culture (in comparison to the MWCNT-supplemented sample) at the 4th, 6th, 8th, 24th, 48th and 72nd h. It may suggest that the culture incubated with MWCNT is reprogrammed to produce pyocyanin instead of pyoverdine. Our previous research noted similar findings where pyocyanin production was stimulated with zinc oxide nanoparticles, resulting in lower pyoverdine-associated fluorescence (Honselmann genannt Humme et al. 2024).
Fig. 3
The characterisation of the optimised and control culture: a OD, b viability, c ROS, d SOD, e CLSM LIVE/DEAD staining of the control, f LIVE/DEAD staining of the MWCNT-exposed culture (green — live cells; red — dead cells), g matrix staining of the control, and h matrix staining of the MWCNT-exposed culture (blue — eDNA and cells, red — exopolysaccharides, and yellow — proteins)
The DCFH-DA assay revealed lowered ROS levels in the case of MWCNT-exposed culture when compared to the control and H2O2-spiked culture (Fig. 3c). This may suggest that the nanomaterial presence did not elevate the ROS and reduced their naturally occurring presence. These findings were confirmed in the SOD assay, where no significant differences in the enzyme activity were found between the control and MWCNT culture (Fig. 3d). The possibility of interference between reagents and MWCNT was excluded in these assays due to the sample collection that avoided the aspiration of nanomaterial agglomerates (see “Basic physiology of the optimised culture”).
CLSM analyses of the bacteria-nanomaterial interactionsThe interactions between microorganisms, especially bacteria, and CNTs have been extensively studied with frequent reporting of antibacterial properties of CNTs, especially single-walled carbon nanotubes (SWCNTs) (Selim et al. 2024). On the other hand, multi-walled carbon nanotubes (MWCNT) were less frequently reported as bactericidal, and some studies have even underlined different effects associated with bacteria-MWCNT interactions. Among them are the aggregation effect of Pseudomonas aeruginosa cells contacted with MWCNT (Kovach et al. 2020) and enhanced conjugative plasmid transfer (Weise et al. 2022). In our research, the CLSM analysis of the biofilm revealed the differences between the control and MWCNT-exposed cultures (Fig. 3e–h). LIVE/DEAD staining allowed observing the cells surrounding the aggregates of carbon nanotubes and an apparent increase in the thickness of the biofilm layer (the aggregates are not visible due to a lack of staining; their presence was confirmed in the white field optical mode). Interestingly, no pronounced changes in cell viability were noticed between the control and MWCNT-treated samples (Fig. 3e, f). In the case of the biofilm, matrix staining showed that in the presence of MWCNTs, more pronounced production of proteins took place, especially under the nanomaterial aggregate (Fig. 3g, h). It was suggested that exopolysaccharide-binding proteins (CdrA) can play a role in biofilm formation in P. aeruginosa, where, in the initial stage, they act as matrix cross-linkers (Courtney et al. 2020).
NMR and FT-IR analysesThe samples obtained from both the control experiment and the one utilising MWCNTs were analysed using 1H and 13C NMR methods. The resulting spectra were further compared with those of a sample sourced commercially. Notably, all spectra recorded for 2 mg of pyocyanin dissolved in 0.5 ml of perdeuterated methanol (CD3OD) exhibited remarkable similarity, indicating structural consistency. However, our assignments of the signals to the corresponding atoms, based on the Overhouser effect, differ from those reported in the literature. Figure 4 a and b graphically present a summary of the 1H NMR and 13C NMR spectra of the three pyocyanin samples with the assignment of the resonance signals to the corresponding atoms based on our measurements and literature data. Description of NMR data are as follows: 1H NMR (400 MHz, MeOD) δ 4.16 (s, 3H, N-CH3), 6.45 (d, J = 8.2 Hz, 1H, H-4), 6.53 (d, J = 8.9 Hz, 1H, H-2), 7.65 (dd, J = 8.3, 8.3 Hz, 1H, H-8), 7.83 (dd, J = 8.2, 8.9 Hz, 1H, H-3), 7.98 (dd, J = 8.3, 8.6 Hz, 1H, H-7), 8.03 (d, J = 8.6 Hz, 1H, H-6), 8.25 (d, J = 8.3 Hz, 1H, H-9).13C NMR (101 MHz, CD3OD) δ 36.11 (N-CH3), 94.46 (C-4), 115.64 (C-2), 116.57 (C-6), 127.25 (C-8), 133.93 (C-9), 134.46 (C-5a), 136.42 (C-4a), 137.45 (C-7), 138.12 (C-9a), 146.73 (C-3), 147.02 (C-10a) and 178.32 (C-1). Additional fragments of spectra are available in Supplementary materials (Fig. S4–S6).
Fig. 4
Analysis of the purified pyocyanin: a summary of 1H NMR, b summary of 13C NMR, c FTIR-ATR analyses of the purified pyocyanin (400–2000 cm.−1)
FTIR-ATR spectra of pyocyanin powder samples obtained from the control (Control) and test (MWCNT) samples were compared with IR spectra of commercial pyocyanin labelled (Standard). From the IR spectra shown, it can be seen that qualitatively, they are almost identical in the entire range of wavelength numbers, i.e. 400–4000 cm−1 (Supplementary materials, Fig. S7). Minor differences relate only to the intensity of the recorded absorption bands. Figure 4 c shows a fragment of the compiled IR spectra in the 400–2000 cm−1 range because absorption bands with the highest intensity and with well-developed extremes characteristic of, among other things, stretching bond vibrations in standard pyocyanin are recorded in this range. From numerous literature data (Mahmoud et al. 2016; DeBritto et al. 2020; Hamad et al. 2020), it is known that the bands registered in the 2000–1500 cm−1 wavenumber range (with extrema at ~ 1730, 1624, 1604 and 1558 cm−1) are mainly related to stretching vibrations, of various types of double bonds in pyocyanin, i.e. C = O, C = C and C = N, and those registered below 1500 cm−1 (with extrema registered, among others, at ~ 1490, 1440, 1404, 1330, 1250, 1158 and 978 cm−1) are bands of stretching vibrations of single bonds, e.g. C–C, C–N and C–H. Many bands in the 1500–400 cm−1 range also correspond to deformation vibrations. Bands associated with skeletal stretching vibrations of C = C bonds are located in the 1620–1450 cm−1 range, and bands of deformation vibrations of C–H bonds occur below 900 cm−1 (Hamad et al. 2020). The band not recorded in the IR spectrum of standard pyocyanin with an extremum at ~ 1730 cm−1, according to the literature, is associated with stretching vibrations of C = C bonds in the aromatic ring of pyocyanin (Mahmoud et al. 2016). Based on the analysis of the IR spectra of the tested samples, it can be undoubtedly concluded that the test sample (MWCNT) contains pure pyocyanin with a well-developed structure.
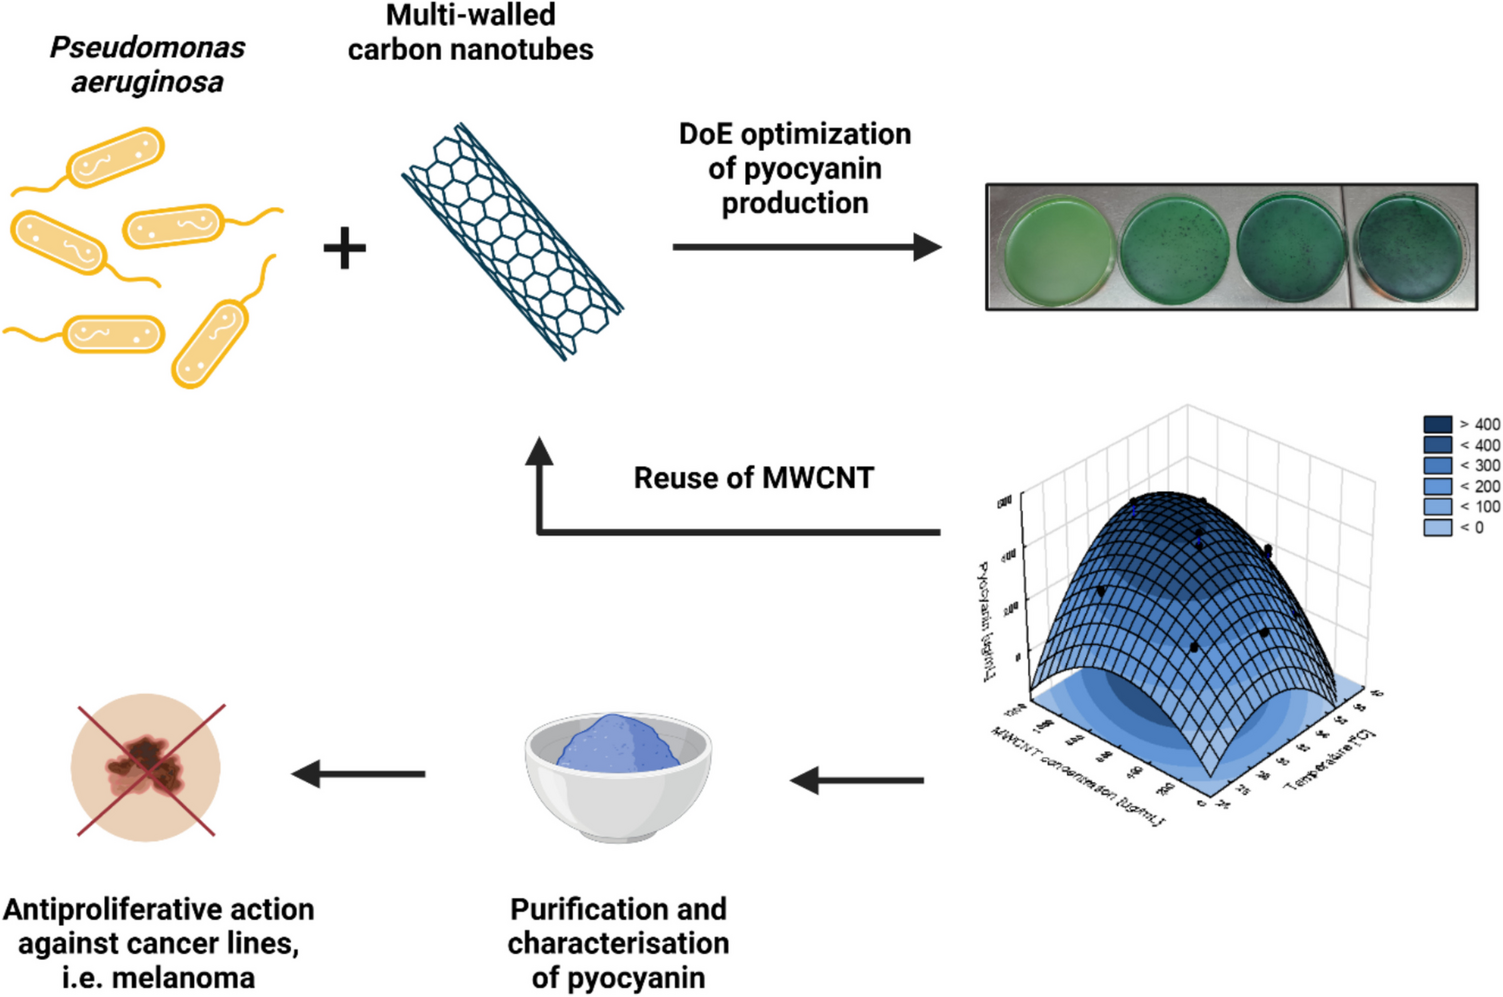
Anticancer propertiesThe Cell Proliferation Reagent (WST-1 assay) was used to evaluate the antiproliferative activity of PYO against selected human neoplastic cell lines, including melanoma (A375), lung cancer (A549), hepatoma (HepG2), breast cancer (MCF7) and murine fibroblasts (L929) as non-cancerous cells. The results are summarised as IC50 values in Fig. 5 a and cell proliferation (% control) in Fig. 5 b and c. According to the IC50 values, the cell sensitivity was as follows: A375 > HepG2 > MCF7 > A549 > L929 (after 24 h of treatment). A similar relationship (HepG2 > MCF7 > HCT > A549) was demonstrated by Ibrahim et al. after 48 h of incubation with PYO (Khaled Ibrahim et al. 2024). In the current study, small differences (higher sensitivity of HepG2 cells) were observed after 72 h, as the sensitivity of cell lines to PYO could be ranked as follows: A375 > HepG2 > A549 > MCF7 > L929. Undoubtedly, the most sensitive cell line defined was melanoma. Its sensitivity to pyocyanin was also confirmed on other melanoma cell lines (SK-MEL-30 and SK-MEL-2) (Patil et al. 2017; Koyun et al. 2022). The selectivity index (SI) also confirmed that melanoma cells were unique (after 72 h) to meet the PYO selectivity criteria (SI > 10) proposed by Peña-Morán (Peña-Morán et al. 2016). However, based on the selectivity criteria proposed by Kohatsu et al. (Kohatsu et al. 2020) (SI > 2), the anticancer activity of PYO against HepG2 cells can also be considered selective.
Fig. 5
Anticancer assays: a the IC50 values (µM) and selectivity-index (SI) determined using WST-1 assay after 24 and 72 h of PYO treatment; b the antiproliferative activity of PYO determined using WST-1 assay after 24 h and c 72 h of treatment; d the cytotoxic activity of PYO determined using LDH assay after 24 h of treatment. The results are expressed as the mean and SD from at least four (b, c) or three (d) independent experiments; * p < 0.05 vs. control (Student’s t-test)
The LDH test results did not confirm the above observations (Fig. 5d). This test was performed only after 24 h of PYO treatment because the test is dedicated to assessing acute toxicity, which is measured by the amount of LDH released into the culture medium only from cells with damaged cell membranes. The stability of the measured LDH (up to 9 h) limits the feasibility of the test to short-time incubations with tested compounds. In the tested concentration range, it was impossible to determine IC50 values based on the LDH test results. A significant reduction in viability was observed only in MCF7 cells treated with 200 µM of PYO. These seemingly inconsistent results can be explained by differences in the functional mode of both tests, which were confirmed by microscopic observation (Figure S8, Supplementary materials). In the case of all cell lines, a decrease in culture density was observed in comparison to the control (at a concentration-dependent cell sensitivity, namely for A375 from a concentration of 10 µM). This microscopic observation was confirmed by the WST-1 assay results, which allowed us to determine the changes in the number of viable, metabolically active cells in the culture. However, only in the case of MCF7 (starting from a concentration of 50 µM) characteristic features of dead cells were observed in the culture (predominance of spherical cells). The results indicate that PYO has antiproliferative rather than cytotoxic effects on cancer cells, but a more detailed understanding of the mechanism of action of PYO requires further research, which exceeds the current goal of the study.
Reuse of MWCNTAn attempt was made to reuse the MWCNT incorporated in the pyocyanin production process to reduce its cost and decrease the possible negative environmental impact. It was demonstrated that the nanomaterial could be reused at least two times without losing the stimulative effect (even obtaining higher stimulation) on pyocyanin production (Fig. 6a). Interestingly, the nanotubes did not require any specific regeneration to maintain their bioactivity in the following processes.
Fig. 6
The reuse of the MWCNTs: a production of pyocyanin with reused MWCNTs, b XRD analysis of the reused MWCNTs, c Raman spectroscopy, d TEM micrographs (SA — pristine MWCNTs, R1 — MWCNTs reused once, R2 — MWCNTs reused twice)
The analyses of the reused Sigma Aldrich MWCNTs showed a decrease in the specific surface area (25.74, 16.62 and 4.5 m2/g, respectively) and total pore volume (0.01087, 0.00795 and 0.00072 cm3/g, respectively) with each use cycle. Nevertheless, the increasing content of ashes (7.05, 25.94 and 32.64%, respectively) was noted, and the higher the ash content, the higher the stimulation of pyocyanin production. SEM–EDX analysis (Supplementary materials, Fig. S9) enabled the detection of only C in pristine Sigma Aldrich MWCNTs, C, O, P, S, Cl, K and Mg in MWCNTs that were reused once, and C, O, P, S, Cl, K, Mg and Fe in the sample reused twice. The biogenic elements O, P and S are probably leftover from the bacterial biomass, while the source of K, Fe and Mg is likely King’s A medium.
XRD analysis of the pristine MWCNTs identified three reflexes at 2θ = 26° (002), 43° (101) and 53° (004) (Fig. 6b). These reflexes are typical for the hexagonal graphite structure (Nawar et al. 2020). XRD analyses of the reused Sigma Aldrich nanomaterial showed a reflex typical for MWCNTs (26°) in each sample. However, the other reflexes (43° and 53°) were less pronounced with each reuse. Interestingly, after the second reuse of nanomaterial, some sharp reflexes were identified by the XRD software as inorganic salts, i.e. KCl and K2SO4.
Raman spectroscopy of the pristine nanomaterials identified three prominent bands: D band, G band and 2D band, which are characteristic of MWCNTs (Dobrzańska-Danikiewicz et al. 2017) (Fig. 6c). Raman spectroscopy of the reused MWCNTs revealed no pronounced differences between the pristine sample, reused for the first time and the one reused twice. For pristine MWCNTs the characteristic bands were identified at 1353 cm−1, 1582 cm−1 and 2699 cm−1, for the MWCNTs reused once at 1352, 1584 and 2700 cm−1 and for MWCNTs reused twice at 1353 cm−1, 1583 cm−1 and 2699 cm−1, respectively. The calculated ID/IG ratios were 0.26, 0.32 and 0.34, respectively. It shows a slight increase in structural defects and/or contaminants in the samples after each application.
TEM analysis (Fig. 6d) showed no pronounced morphological differences between the pristine and reused MWCNTs. However, the images indicate the deposition of an amorphous layer on the outer surface of the nanotubes, which is thicker after each application in the pigment production process.
Comments (0)