Strains, plasmids, and chemicals
The restriction enzymes ATP and Taq DNA polymerase were purchased from Takara (Dalian, China). β-Nicotinamide adenine dinucleotide (NAD+) and β-nicotinamide adenine dinucleotide phosphate (NADP+) were obtained from BioSharp (Anhui, China). 4-Androstene-3,17-dione (4-AD) and 9α-hydroxy-4-androstene-3,17-dione (9OH-AD) were purchased from Sigma-Aldrich (Shanghai, China). Phytosterols composed of β-sitosterol (45%, MW = 414.71 Da), campesterol (37%, MW = 402.7 Da), and stigmasterol (18%, MW = 412.7 Da) and thus an average molecular weight of 410.4 Da were purchased from Yunnan Biological Products Co., Ltd. (Yunnan, China). α-Glycerol phosphate dehydrogenase from rabbit muscle was purchased from Sigma-Aldrich (Shanghai, China). The protease was purchased from Beyotime (Shanghai, China). A PCR cleanup kit was purchased from Omega BioTek (Hubei, China). Industrial grade HP-β-CD was purchased from Zhiyuan Biotechnology Co., Ltd. (Shandong, China).
Bioinformatic prediction of glycerol metabolic pathways
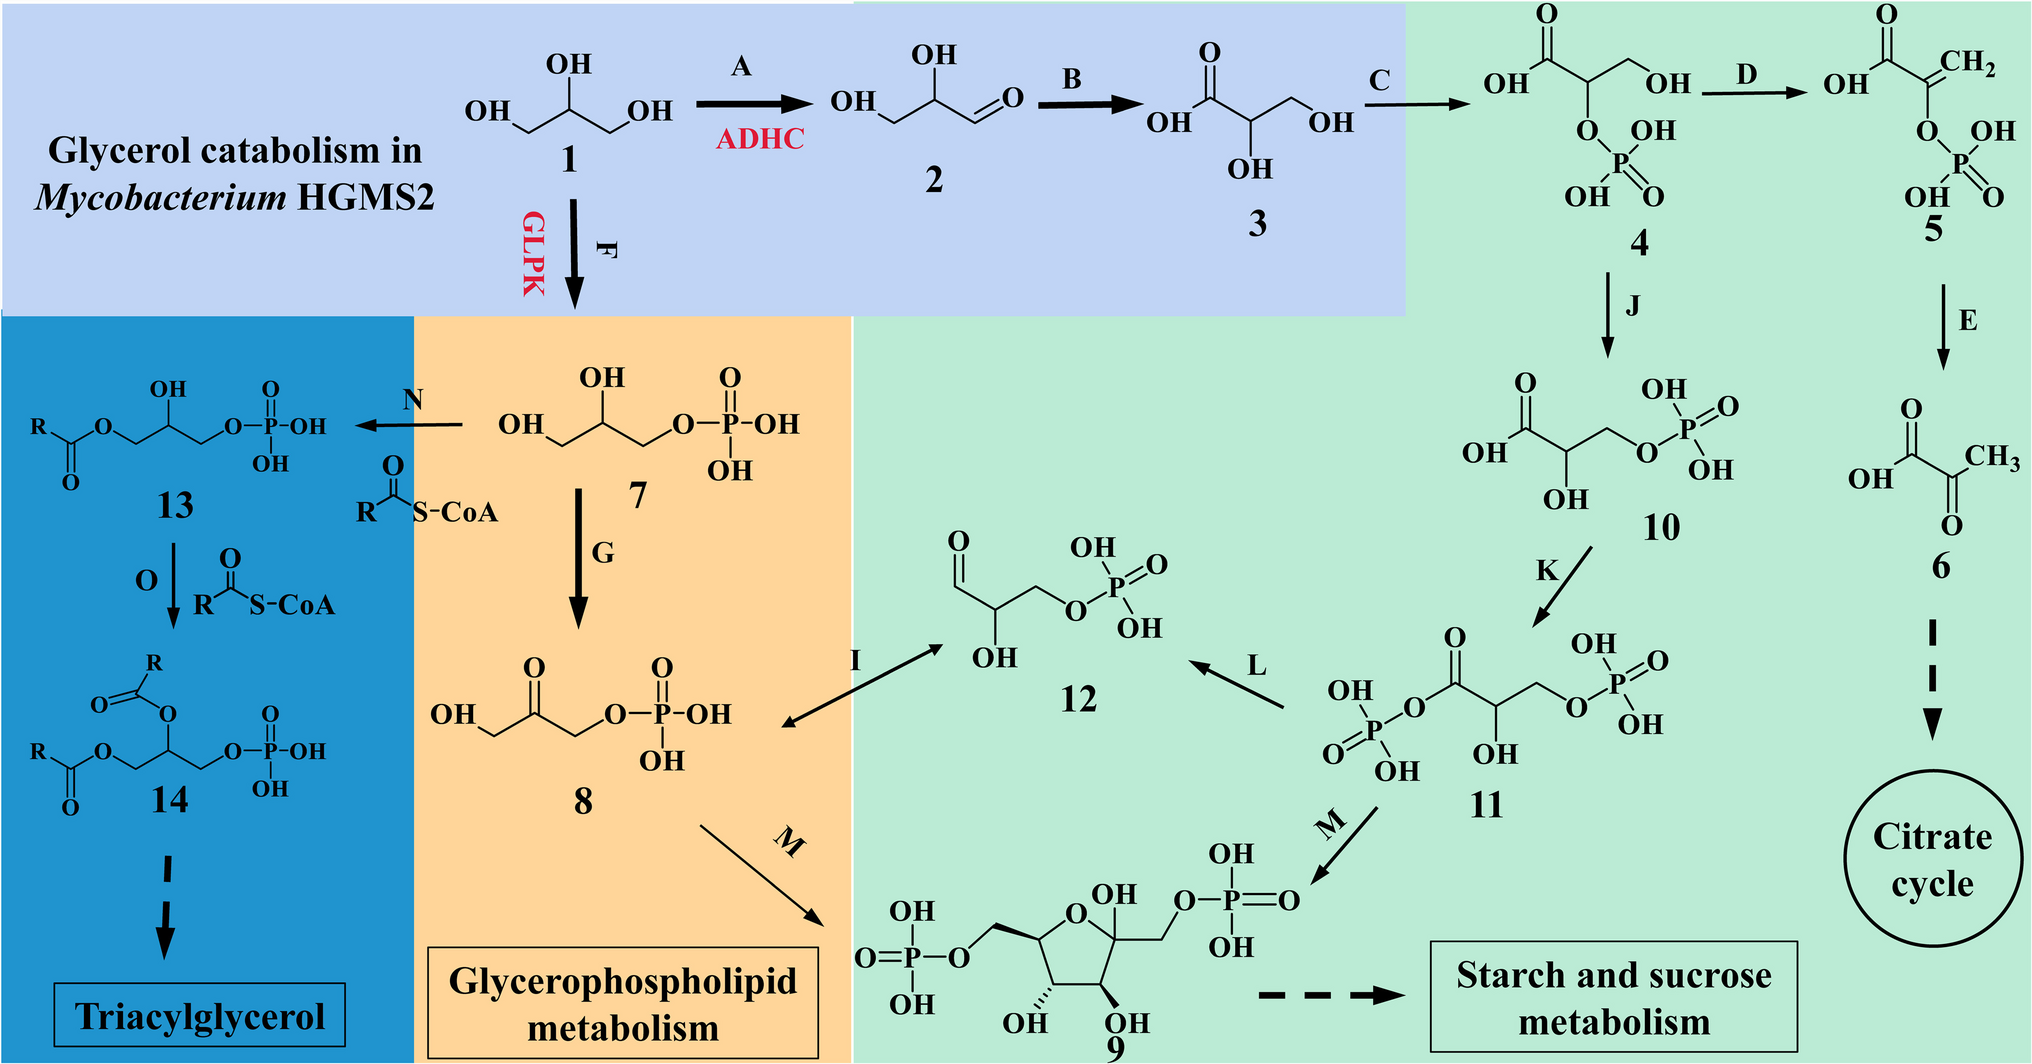
Putative glycerol metabolic pathways in Mycolicibacterium HGMS2 were constructed via the KEGG mapper (Kanehisa et al. 2017). The proteosome of the HGMS2 strain (CP031414.1) (Wang et al. 2020) was used to query all the annotation data lists on HGMS2 metabolism through BlastKoala, which is based on the KEGG Database on Mycolicibacterium (#1763). Among all the annotation lists, glycolipid metabolism (#00561) was selected to reconstruct the glycerol metabolic pathway, for which putative enzymes were highlighted.
Prediction of the three-dimensional structures of the HGMS2 ADHC and GLPK enzymes
Structural models of the HGMS2 ADHC and GLPK enzymes were predicted with RoseTTAFold (Baek et al. 2021) via online resources and the protocol described by Dubey et al. (2021). To conduct the RoseTTAFold prediction, the ADHC and GLPK enzyme sequences were submitted as query sequences through the RoseTTAFold open access resource (https://robetta.bakerlab.org/), and the first of multiple solutions was used as the template for the enzyme structures. Additionally, the RoseTTAFold prediction, which also contains side-chain information, uses a three-track neural network to generate the ADHC and GLPK models on the basis of their protein sequences.
Molecular cloning of ADHC and GLPK
ADHC and GLPK were expressed in soluble forms via the pRSV vector and pRSV-MBP vector, respectively (Wang et al. 2020) (Table 1). ADHC was expressed as a His6-tagged protein, whereas GLPK was a maltose binding protein (MBP)-tagged protein. In the pRSV-MBP vector, the His-tag is located in front of MBP and can be used for protein purification.
Table 1 Various plasmids used in this studyThe glycerol dehydrogenase gene (adhc) and glycerol kinase gene (glpk) were amplified from HGMS2 genomic DNA via PCR with two different pairs of primers. A 1047 bp adhc DNA fragment was obtained via a forward primer (ADHC-F: 5′-CGGGATCCAAACCGTTTCCG-3′) and a reverse primer (ADHC-R: 5/-CGGAATTCTAGATCGTGGCGGTTCG-3′). To subclone the adhc gene into the above vectors, two restriction enzyme sites, BamH I and EcoR I, were introduced into the 5′ and 3′ ends of the adhc PCR product, respectively. A 1518 bp glpk DNA fragment was amplified via a forward primer (GLPK–F: 5′-CGGAATTCTCTGCCCAAATTCGTCGCGG-3′) and a reverse primer (GLPK–R: 5′-GGAATTCCATTGTTACTAGGAGACGTCGACCCAA-3′). Two restriction enzyme sites, EcoR I and Nde I, were introduced into the 5′-end and 3′-end of the glpk PCR products, respectively.
Each PCR product was purified via a PCR cleanup kit. The PCR product of the adhc gene was digested with BamH I and EcoR I, while the PCR product of the glpk gene was digested with EcoR I and Nde I. The digested PCR product of the adhc gene was ligated into a predigested pRSV vector harboring the kanamycin gene, and the digested PCR product of the glpk gene was ligated into a predigested pRSV-MBP vector. Each ligated plasmid was transformed into E. coli DH5α competent cells for plasmid amplification. The positive clones on kanamycin-containing LB agar plates for each ligation reaction were selected and screened via colony PCR with the forward primer described above and the T7 terminator primer. Each constructed vector was confirmed by DNA sequencing at BioSune (Shanghai, China). The two kinds of expression plasmids were named pRSV-ADHC and pRSV-MBP-GLPK (Table 1 and Fig. S1).
Expression and purification of the ADHC and GLPK enzymes
Each plasmid was individually transformed into E. coli BL21(DE3) cells for enzyme expression. Enzyme expression and purification essentially followed the same procedure described by Wang et al. (2020). The two enzymes were overexpressed in soluble forms of fusion proteins at 18 °C for 12 h by the induction of 0.4 mM IPTG. Both enzymes were purified by Ni–NTA agarose chromatographic purification with a gradient of guanidine hydrochloride concentrations from 45 to 200 mM. The His-tag and MBP-tag were removed from each fusion protein by incubation with Tev protease at a mass ratio of 1:0.05 protein to Tev protease (w:w%) at room temperature for 4 h, followed by a second Ni–NTA agarose chromatographic purification. The mixture containing the desired enzyme was collected and desalted with a HiPrep 26/20 desalting column (GE, USA), followed by MonoS ion exchange chromatographic purification. Peaks corresponding to ADHC and GLPK were collected and concentrated with an Amicon Ultra30 centrifugal filter (Millpore, IRL) for the assay of enzyme activity.
Enzyme activity assay
The activity of ADHC was spectrophotometrically evaluated by monitoring the absorption of NADPH at 340 nm and 25 °C according to the protocol described by Wang et al. (2014). The reaction mixture contained 870 μL of 0.1 M Tris–HCl, 20 μL of 0.05 M glycerol, 10 μL of 1 mM NADP+, and 100 μL of purified ADHC enzyme, and the final volume was 1 mL. A reaction without glycerol was used as a control. One unit (U) of enzyme activity was defined as the amount of enzyme required to reduce 1 μmol of glycerol to glyceraldehyde per minute at 25 °C and pH 9.0.
The activity of GLPK was measured spectrophotometrically at 340 nm at 25 °C using NAD+ as an artificial electron acceptor (Bublitz 1962). The reaction mixture consisted of 562.8 μL of reaction buffer containing 1 M hydrazine, 2 mM MgCl2, 0.2 M glycine (pH 9.8), 10 μL of 0.1 M glycerol, 7.2 μL of 0.075 M ATP, 10 μL of 0.02 M NAD+, and 4 μL of 1 mg/ml α-glycerol phosphate dehydrogenase from rabbit muscle (Sigma, USA). The reaction was initiated by adding an appropriate amount of purified GLPK. A reaction lacking glycerol was used as a control. One unit (U) of GLPK enzyme activity was defined as the amount of enzyme required to phosphorylate 1 μmol of glycerol into glycerol 3-phosphate per minute at room temperature and pH 9.0.
The Km values of the ADHC and GLPK enzymes for glycerol were calculated from Lineweaver‒Burk plots with GraphPad Prism 9 software (Zorn and Li 2017). The effect of pH on enzyme activity was measured in different Tris‒Cl buffers from pH 6 to 10, and the effect of temperature on enzyme activity was measured between 30 and 55 °C.
Gene knockout and complementation experiments
Knockout of the adhc and glpk genes from the HGMS6 genome was performed via a homologous recombination strategy via the p2NIL-SacB vector described previously (Goude and Parish 2009b; Li et al. 2021). Briefly, each of these genes was replaced through homologous recombination with a specific DNA fragment that contained upstream and downstream sequences outside of the targeted gene. Each sequence was approximately 1 kbp in length. All the upstream and downstream sequences of the adhc and glpk genes were amplified from the genomic DNA of Mycolicibacterium HGMS2 via forward and reverse primers (Table S1). The amplified upstream and downstream fragments for each target gene were digested with two pairs of restriction enzymes, BamH I/Xba I and Xba I/Hind III, respectively, and then ligated in one step into the p2NIL-SacB vector that had been predigested with BamH I/Hind III. The ligated plasmids were subsequently transformed into E. coli DH5α competent cells for amplification. The constructed plasmids were confirmed by DNA sequencing (Table 1) and electroporated into HGMS6 cells.
DNA electroporation transformation was performed via a Gene Electroporation System from SCIENTZ (Linbo, China). Competent cells were prepared as previously described (Goude and Parish 2009a; Li et al. 2021). A total of 1 μg of each recombinant plasmid was mixed with 100 μL of competent cells, and the mixture was subsequently added to a 0.2 cm precooled electroporation cuvette. A single pulse of 2.2 kV, 20 UFs, and a resistance of 1 kΩ with a constant wave pulse were applied with a time constant of 25 ms. The bacterial suspension was diluted to 0.5 mL with LB medium and incubated for 2–3 h at 30 °C. The culture was then spread on an LB agar plate (LBK) containing 34 mg/mL kanamycin and grown at 30 °C for 2–3 days to promote the first recombination, followed by a second recombination by spreading on a sucrose agar plate (LBS) containing 10% sucrose. Recombinant colonies were then picked from the LBKS plates for PCR verification. Specifically, positive colonies were transferred to 3 mL of LBT medium containing 0.05% Tween-80 and cultured at 30 °C and 200 rpm for 2 days, after which their genomic DNA was extracted for PCR verification with the same pairs of primers for amplifying the adhc and glpk genes (Table S1). The verified mutant strains were stored at − 80 °C.
Each deleted gene was complemented by homologous expression of the adhc or glpk gene on pMV261 in two single mutants, whereas the double mutant was complemented by homologous expression of the adhc and glpk genes via the use of one pMV261 vector simultaneously.
Evaluation of cell growth
Examination of cell growth was conducted via FM media (Franke and Kessin 1977) containing glucose or glycerol as the main carbon source. The FM medium contained K2HPO4·3H2O (0.5 g/L), citric acid (2 g/L), ferric ammonium citrate (0.05 g/L), MgSO4·7H2O (0.5 g/L), and (NH4)2HPO4 (3.5 g/L). The initial concentrations of glycerol and glucose were arbitrarily set up at 20 g/L and 15 g/L, respectively, in both liquid and solid media. The cell density was determined on the basis of the absorbance at 600 nm and wet cell biomass, which was measured every 24 h for 7 days. Mycolicibacterium neoaurum HGMS6 was used as the control.
Small‑scale phytosterol fermentation
Small‑scale fermentation was used to compare the effects of glycerol and HP-β-CD on the rate of phytosterol conversion to 4-AD. Mycolicibacterium strains were initially cultured in 5 mL of LB medium at 30 °C for 2 or 3 days until their cell densities reached 13–15 at OD600nm. These cultures were then used as seeds for the inoculation of 50 mL of a standard fermentation medium that contained yeast extract (15 g/L), glucose (1 g/L), NaNO3 (5.4 g/L), (NH4)2HPO4 (0.6 g/L), and Tween 80 (0.05%, w/v) in a 250 mL Erlenmeyer flask. Phytosterol powder was ground with a soybean grinder, homogenized with a homogenizer, added to 50 mL fermentation medium (5 g/L) for autoclaving at 121 °C for 20 min. Glycerol and HP-β-CD were added to the fermentation media at final concentrations of 5% (w/v) and 0.5% (w/v), respectively, for emulsifying phytosterols. The cell cultures were shaken at 30 °C and 200 rpm for 7 days, during which time 1 mL of fermentation broth was collected every 24 h for the extraction of metabolites.
Extraction of metabolites and HPLC analysis
Metabolites in the fermentation broth were extracted with ethyl acetate at a ratio of 1:1 (v/v%). The mixture was thoroughly mixed before centrifugation at 14,000 × g for 5 min, after which 500 μL of the supernatant was collected. The extracts were dried by evaporation and dissolved in 200 µL of a 60% methanol/water solution or an isopropyl alcohol/acetonitrile solution for high-performance liquid chromatographic (HPLC) assays. HPLC assays were performed via a Waters 1525 HPLC machine (CA, USA) with a Sunniest C18-reversed-phase chromatographic column (5 μm, 150 mm × 4.6 mm I.D., Waters, USA) at 30 °C and monitored at 254 nm for 4-AD or 205 nm for phytosterol. The mobile phase for the 4-AD assay contained methanol and water at a ratio of 60:40 (v/v%), and the flow rate was set at 1 mL/min. The mobile phase for the phytosterol assay contained acetonitrile and isopropyl alcohol at a ratio of 60:40 (v/v%), and the flow rate was set at 1 mL/min. The sample injection volume was 20 μL.
To quantify the 4-AD concentration of fermentation broth, we used a variety of 4-AD concentrations to establish a standard curve that correlated the relationship between the HPLC peak area and the 4-AD concentration for a series of standard samples (Fig. S2). The content of 4-AD in the fermentation broth was calculated according to the standard curve. The molar conversion rate (Conv) of phytosterol to 4-AD was estimated via the following equation:
$$Conv=\frac}}\right)}\%,$$
where Mst and Mp are the weights of steroids and phytosterols, respectively. MWst and MWp are the molecular weights of steroids and phytosterols, respectively. In this work, the average molecular weight of phytosterols was 410.40 Da (see above) (Li et al. 2021).
Pilot‑scale fermentation
Pilot-scale fermentation was conducted in a 5 L steel fermenter. The fermentation medium consisted of yeast extract (8 g/L), glycerol (10%, w/v), (NH4)2HPO4 (0.6 g/L), NaNO3 (2 g/L), phytosterol (50 g/L), Tween-80 (0.1%, w/v), lectin (3 g/L), and HP-β-CD (0.5%, w/v). A control experiment was performed using the same medium containing 15% (w/v) soybean oil. Phytosterols were emulsified with glycerol, Tween-80, lectin, and HP-β-CD before the mixture was transferred to the fermenter. All the other components were added to the fermenter before water was added until the total volume of the medium reached 3 L. The medium was autoclaved in situ at 121 °C for 30 min, after which it was cooled to 30 °C while stirring at 500 rpm. The fermentation medium was inoculated with 10% (w/v) seed mixture, which had been cultured for 2 days. The fermentation mixture was processed at 30 °C with stirring at 500 rpm, and the dissolved O2 concentration (50–60%) and pH value (pH 7.5) of the fermentation broth were constantly monitored in-line and automatically adjusted if necessary. Samples were collected every 12 h to monitor the 4-AD concentration via HPLC.

Comments (0)