2.1 Study Design, Population and Data Sources
We incorporated multiple data sources to estimate QALE. Age- and sex-specific mortality rates by level of educational attainment were required to derive LE. Estimates of HRQoL stratified by age, sex, and level of educational attainment were needed to adjust LE for quality of life.
A nationally representative sample of HRQoL was sourced from the Household, Income and Labour Dynamics in Australia (HILDA) survey. This longitudinal household panel survey collects annual demographic, economic, and health and social data, the full details of which can be found elsewhere [14]. This study used Wave 22 (Restricted Release 22, version 5.1) [15] which collected data on 21,732 participants from July 2022 to February 2023 [14]. With a cluster stratified design, HILDA provides a sample of all Australian households residing in private dwellings, excluding institutionalised persons and those residing in very remote, sparsely populated areas of Australia [14, 16]. The cross-sectional weights for the self-completion questionnaire provided within HILDA are created with Australian Bureau of Statistics population benchmarks, enabling the creation of population estimates [14].
HILDA survey participants were asked to complete the Short-Form-36 (version 1) within the self-completion questionnaire component of the survey. Australian preference weights were applied to these SF-36 responses to obtain Short-Form Six-Dimension (SF-6D) health utility scores where death is represented by a score of zero, states worse than death may range down to − 0.363, and a score of 1 represents perfect health [17].
We estimated age- and sex-specific mortality by level of educational attainment using linked 2016 Census of Population and Housing and Death Registrations data over 2016–2019 available with the Person-Level Integrated Data Asset (PLIDA). Data within the PLIDA are linked indirectly using a Person Linkage Spine, created by combining individual-level data from three administrative datasets which together result in virtually complete coverage of all Australian residents [18]. The 2016 Australian Census collected demographic data, including education, on 9 August 2016 for all Australian residents with an estimated response rate of 94.8% [19]. Deaths Registrations contain a record of all deaths registered in Australia, including date of death. All Australian residents aged 25 years and above with a 2016 Census record that linked to the Spine were included in analyses to estimate mortality rates.
2.2 Variables
Both the HILDA survey and Census 2016 provided the age (in years) and sex (male or female) of individuals. Age was limited to 25 years and above as formal education is commonly completed by age 25 years in Australia [20]. The HILDA dataset provided a variable for the highest education level achieved derived from three questions relating to education. In the 2016 Census, educational attainment was determined by two questions regarding the highest year of secondary schooling completed and the highest non-school qualification obtained. To facilitate international comparisons, educational attainment was divided into three broad categories that align with the International Standard Classification of Education (ISCED) as in other studies of education-related inequality [5, 9]. Educational attainment categories were as follows: low level (completed Year 11 or below, i.e. did not complete the final year of secondary schooling, ISCED 0–2), intermediate (completion of year 12 and/or other non-tertiary or vocational qualification, ISCED 3–5), high level (completion of a bachelor’s degree or above, ISCED 6–8). Details of the variables used to assign individuals to the education levels are provided in Online Resource Supplementary Table S1.
2.3 Analysis2.3.1 Health-Related Quality of Life
Of the 15,954 HILDA survey participants eligible to complete the SCQ, there were 13,691 aged 25 years and above. A valid SF-6D score was available for 12,416 of these respondents; however, 6 (< 1%) of these were excluded as their level of education attainment was not determined. Therefore 12,410 participants remained for inclusion in the HRQoL analysis, and 10.3% of eligible respondents were excluded owing to missing data (1281 of 12,410). The included and excluded populations are contrasted in Online Resource Supplementary Table S2a. Exclusion from the analysis was predominantly due to missing SF-6D data. Logistic regression for individuals missing versus not missing utility data showed that respondents with missing data tended to be male, younger and of lower education (Online Resource Supplementary Table S2a). Details of participant flow are provided in Online Resource Supplementary Fig. S2 and the characteristics of the HILDA sample in Online Resource Supplementary Table S2b.
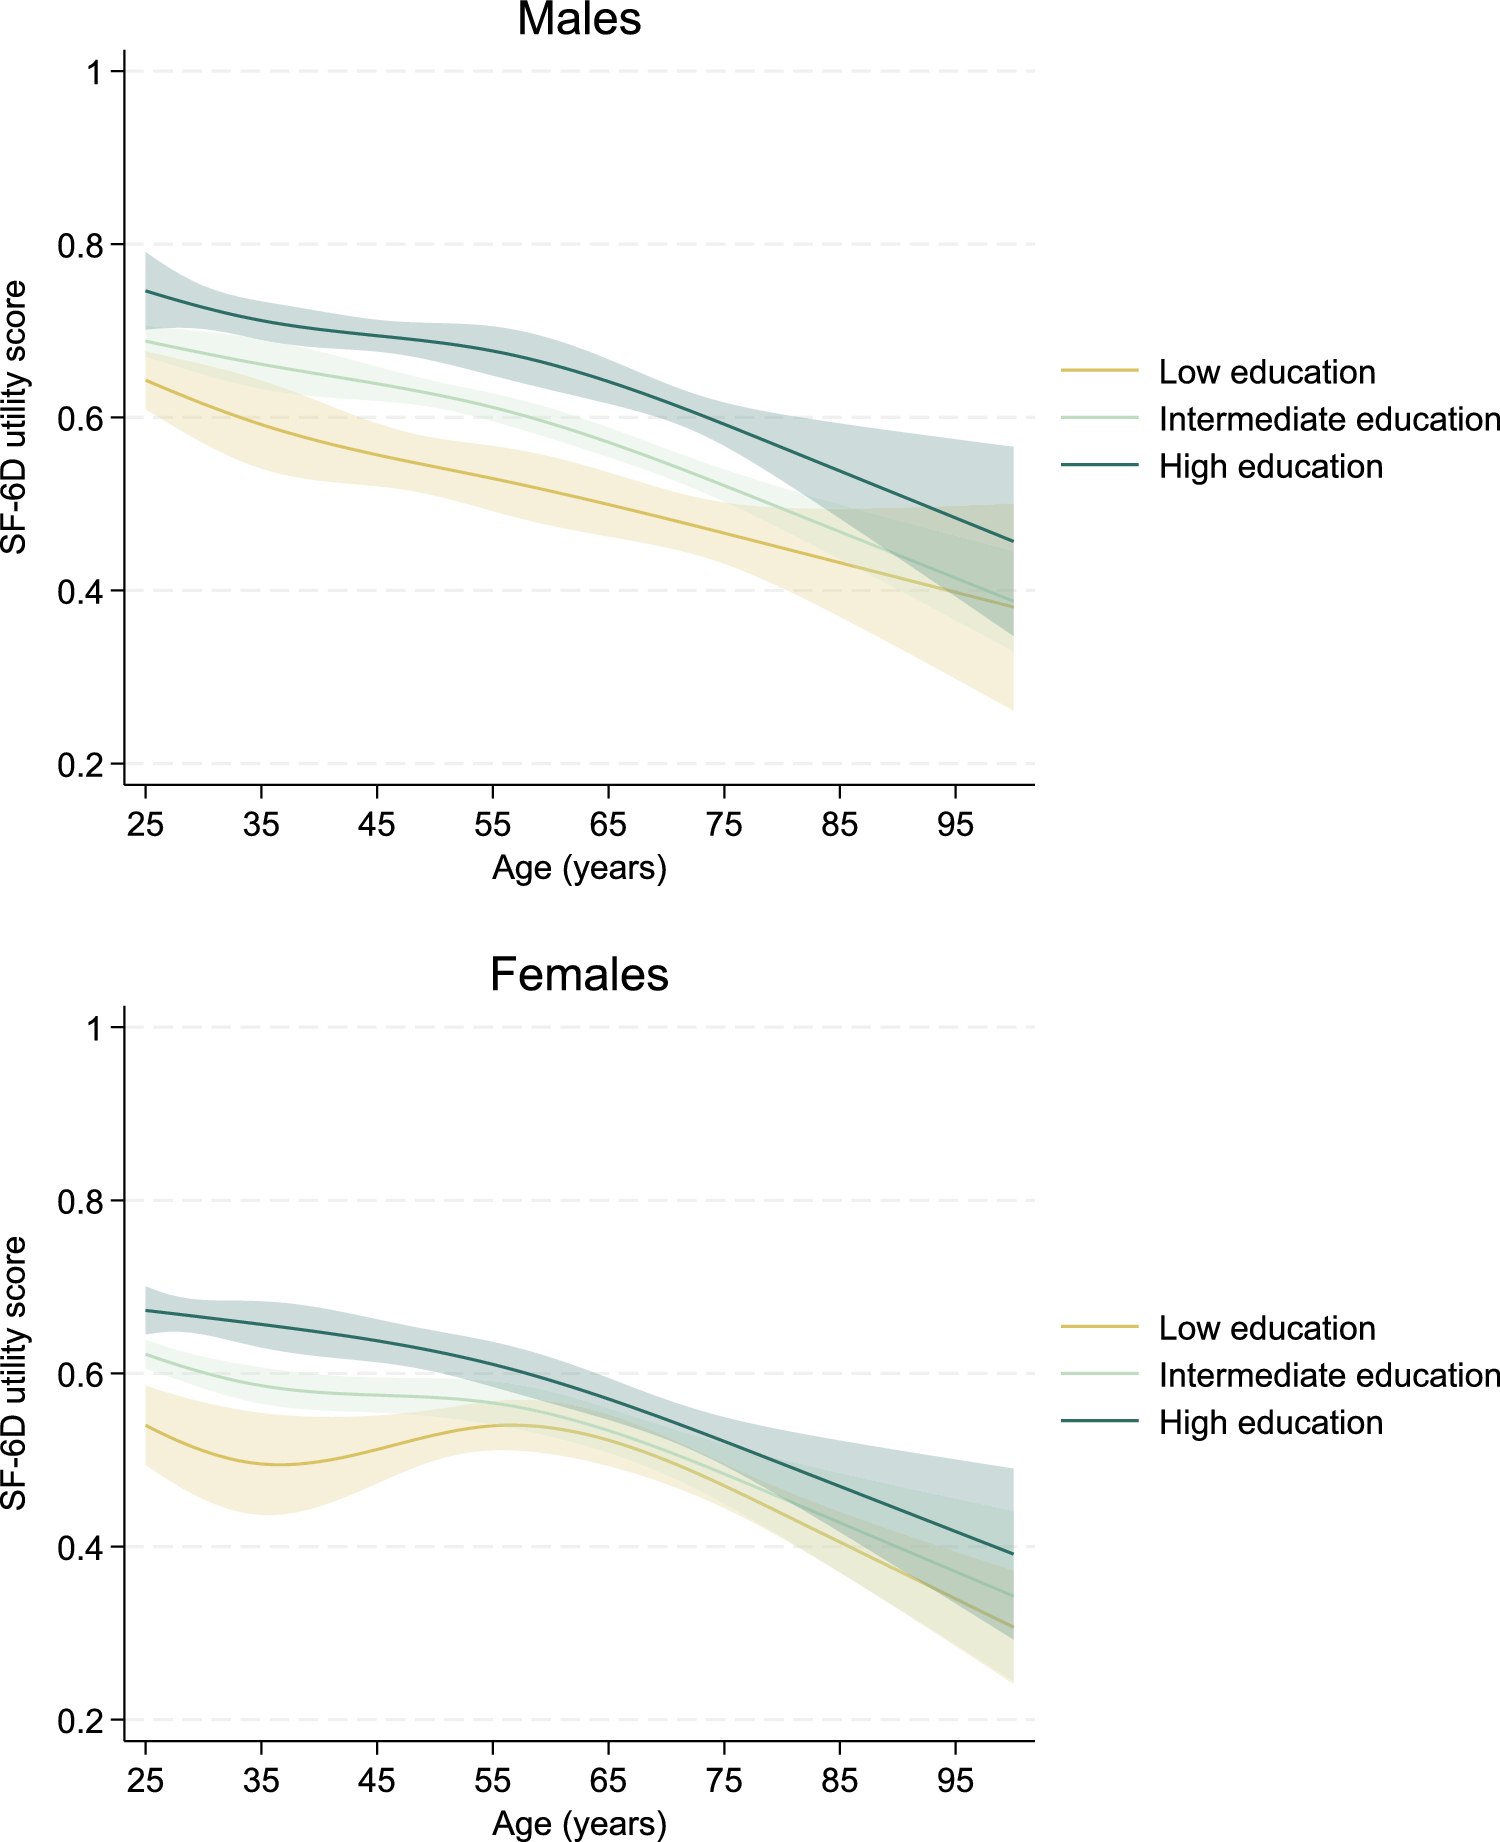
The mean health utility for each age, sex and education subgroup was estimated using generalized linear models. Health utility was assumed to follow a normal distribution using an identity link (i.e. linear regression), and all models were stratified by sex and education level. As the relationship between utility and age is not necessarily linear, the model included the effects of age as cubic splines with four knots at the 5th, 35th, 65th and 95th percentiles (ages 27, 41, 59 and 80 years) [21]. As the health utility data were skewed, a generalized linear model following a beta distribution and logit link was also estimated at the whole of population level. Model fit was acceptable for the normally distributed linear model and superior to the beta distributed model, which underperformed owing to the impact of outliers (utility scores falling outside the range of the beta distribution). Therefore, the standard linear model was used throughout. Model fit and spread of residuals by age are discussed and shown in Online Resource Supplementary Fig. S1. Cross-sectional sample weights provided within the HILDA dataset were applied to allow for the clustered, stratified nature the HILDA survey when extrapolating utility estimates to the general population [14]. Separate models for each sex and education level subgroup were used to estimate age-sex-education-specific HRQoL for every year of age (from 25 to 100 years).
2.3.2 Mortality Rates
Methods to estimate mortality rates by educational attainment using linked Census-Death Registrations data are described elsewhere [5, 22]. Previous research has demonstrated that mortality rates estimated using linked Census-Death Registrations are different to those in the Australian population [22]. For this reason, we estimated age-sex-education-specific mortality rates by applying education-specific rate ratios to age-sex-specific mortality rates for 2019, derived from the complete Death Registrations data using estimated resident population counts on 30 June as the denominator [22]. Rate ratios were estimated separately for men and women in each 5-year age group using negative binomial regression. For these analyses, person-time at risk was estimated as the time between the Census night (9 August 2016) and 31 December 2019 or date of death, whichever occurred first. Missing Census data on educational attainment (n = 834,630) were imputed using ordered logistic regression with sociodemographic characteristics as predictors, including age, sex, broad cause of death and SEIFA Index of Education and Occupation, as carried out previously [22].
Lastly, Poisson regression was conducted on the count of deaths in the at-risk population against age to estimate a sex-education-specific mortality rate for every year of age (25–100 years). As with utility values, the effects of age were modelled as cubic splines with four knots at the 5th, 35th, 65th and 95th percentiles (ages 27, 41, 59 and 80 years).
2.3.3 Life Expectancy and QALE
We estimated life expectancy using unabridged life tables commencing from age 25 years. Individuals dying within an age interval were assumed to survive half of the interval. The Sullivan method was used to estimate QALE, whereby the person-years lived within each interval are adjusted by multiplying by the estimated utility score for that age-sex-education-specific subgroup [23]. This generates the quality-adjusted life years (QALYs) experienced within each interval, which are then used to derive QALE. In line with prior Australian studies estimating QALE [24, 25], the QALE estimates were provided both undiscounted and with an annual discounting rate of 3% applied.
2.3.4 Inequality Analysis
Education-related inequality was assessed with both absolute and relative measures. The absolute difference was determined by subtracting the LE (or QALE), for the low-education group from that of the high-education group. The relative difference was calculated by dividing the LE (or QALE) of the high-education group by that of the low-education group, then subtracting 1 and multiplying by 100 to indicate the percentage difference between the most and least advantaged groups.
2.4 Uncertainty
Probabilistic sensitivity analysis was conducted to determine the uncertainty of the LE and QALE estimates using a Monte Carlo simulation over the following parameters: mean health utility, age-adjusted rate ratios estimated using linked Census-Death Registrations data (assumed standard error of 5%), and mortality rates by individual years of age extrapolated from those in age brackets. We conducted 1000 simulations to estimate 95% confidence intervals around the discounted QALE estimates for all sex-education groups by year of age. Analysis was conducted with Stata 18.0 software (StataCorp LP, College Station, TX, USA).

Comments (0)