
Remember me


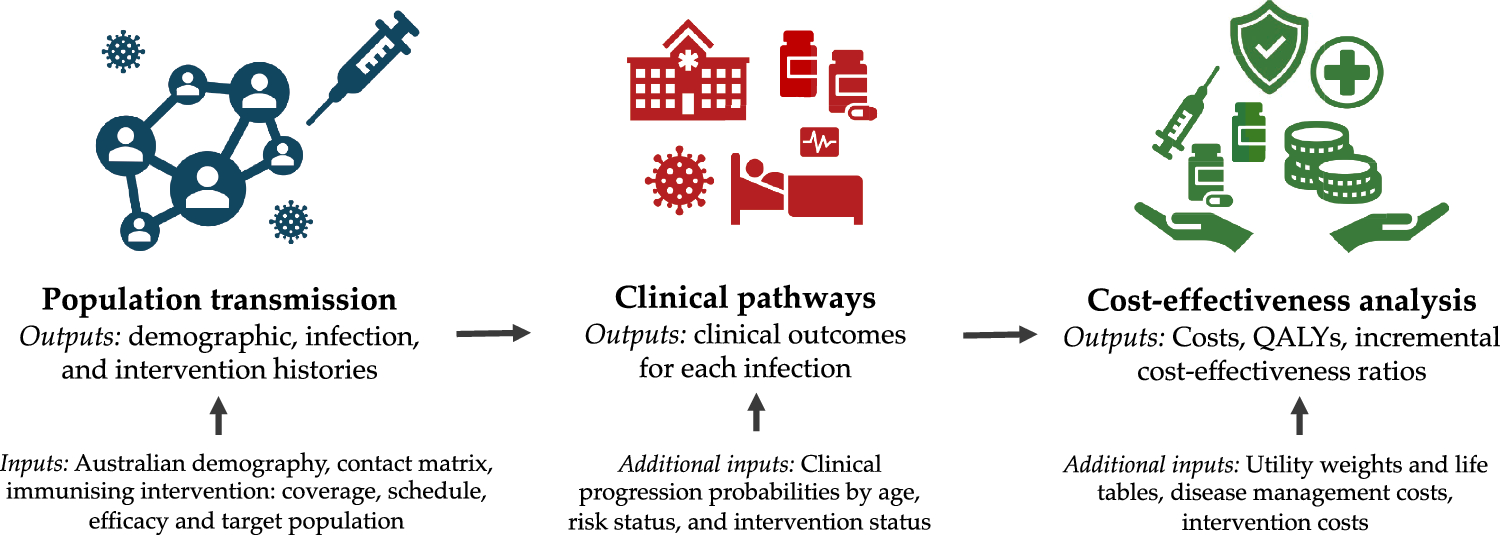
In order to integrate the impact of pollutants in cost-effectiveness and utility analysis, one needs to (i) estimate the amount of pollutants associated with a care pathway or a healthcare system using estimates from LCAs, (ii) convert these pollutant emissions into future health damages (e.g., using an adapted version of the ReCiPe 2016 model [26], an acronym derived from RIVM and Radboud University, CML, and PRé consultants) that provide conversion factors to estimate the effect of pollutant emissions (CO2e, CFC11, NOx, etc.) on future health (DALYs, QALYs, LYs), and (iii) integrate these future losses into cost-effectiveness (e.g., using ICER) and/or utility analysis (QALYGHG/QALYpatient ratio) [26]. A summary of the methodological framework is provided in Fig. 1. Notably, one may focus on a particularly impactful pollutant (in our case, GHG emissions), instead of accounting for all of them, which largely simplifies the LCA.
Fig. 1
Scheme of the methodological framework to perform pollution-integrating HTA. Most human health damages are expected to emerge from global warming induced by GHG emissions. Other pollutant emissions are expected to be difficult to account for due to the scarcity of data available to quantify them, but are expected to represent <10% of future health damages at the national scale and therefore have a relatively low impact in most care pathways. Other impacts on ecosystem and resource scarcity are also not accounted for in HTA, but may be calculated using the ReCiPe model. CFC11 trichlorofluoromethane, GHG greenhouse gas, HTA health technology assessment, ICER incremental cost-effectiveness ratio, LCA life cycle assessment, OS overall survival, PFS progression-free survival, QALY quality-adjusted life years, ReCiPe RIVM and Radboud University, CML, and PRé consultants model, SOx sulphur dioxides
2.1 Quantitation of US Healthcare System Pollutant EmissionsThe exact effect of each pollutant is difficult to take into account within a particular care pathway as it relies on the correct quantification of CO2e emissions, but also trichlorofluoromethane-equivalent (CFC11e) emissions, ammonia (NH3), nitrogen oxides (NOx), Sulfur oxides (SOx), benzene, etc. In order to show each healthcare system’s pollution impact, we used the example of the US healthcare system. We used the estimated fraction of each pollutant emission attributed to the functioning of the healthcare sector at the US national scale from Eckelman and Sherman [27], multiplied by the national emissions of each pollutant in 2021 (or the last available year if not in 2021) to obtain an estimation of the healthcare system-related pollutant emissions for the year 2021 (see ESM Table S1). Total emissions from the healthcare sector (including CO2e, CFC11e emissions, NH3, NOx, SOx, benzene, etc.) were then multiplied by the ReCiPe 2016 [26] conversion factors using an egalitarian perspective (Sect. 2.2 adapted ReCiPe model) to estimate future health damages in DALYs (Supplementary Data and Table S1 in the ESM).
2.2 Estimation of Future Human Health Damages Caused by PollutantsThe ReCiPe model [28] in its updated 2016 version [26] provides a framework for estimating the impact of GHG emissions and other pollutants (CFC11e emissions, NH3, NOx, SOx, and benzene) on human health, ecosystem quality, and resource scarcity. Future human health damages are expressed in DALYs (DALYGHG) representing years lost or lived with disability due to disease or injury. In this work, we focused exclusively on human health impacts; effects on ecosystem quality (e.g., species loss) and resource scarcity (e.g., mineral resource depletion) were not assessed. Health damages considered in ReCiPe 2016 include increased risks of respiratory disease (via ozone depletion and particulate matter), various cancers (via ionizing radiation, ozone depletion, chemical exposure), malnutrition (via global warming and water depletion), malaria (via global warming), and diarrheal diseases (via global warming).
While spatial differentiation (region-specific modeling) is available for certain endpoints, it was not implemented in ReCiPe 2016 for human health damages, as its effect was deemed minimal compared with its relevance for ecosystem impacts. Several potential health damage pathways are also not included in the model, such as those involving indoor chemical and fine particulate matter exposure, direct pesticides application to food, climate change-related shifts in other infectious diseases, noise pollution, or the effects of emerging pollutants and technologies.
ReCiPe 2016 conversion factors (kgCO2/DALYGHG for GHG emissions) strongly depend on the discount rate applied to future health outcomes, representing the societal preference for present versus future life years. A 3% discount rate, for instance, assigns a weight of only 0.04 to a DALY lost 100 years from now—essentially disregarding its value. Similarly, with a 0.5% discount rate, a DALY lost in 500 years is weighted at just 0.082 (Fig. 2). Thus, the use of a discount rate has profound implications; applying a positive discount rate greatly diminishes the perceived health burden of climate-related damages on future generations. In effect, it undermines intergenerational equity by heavily prioritizing present-day health outcomes over those of individuals living in the next centuries.
Fig. 2
Impact of discount rate on the relative value of DALY depending on time. Use of a > 0.1% discount rate implies that the impact of climate change for people living in 100 (2–3% discount rate) or 500 years (1.5–0.5%) is almost not taken into account. DALY disability-adjusted life years
The ReCiPe model is proposed by its authors with three different perspectives, each reflecting different value judgments regarding time horizon, discounting, and uncertainty tolerance [26].
The individualistic perspective adopts a short-term outlook (20-year time horizon) with a 3% discount rate. It includes only impacts that are well established and undisputed within the scientific community and assumes a high level of human adaptability (i.e., technological optimism). The hierarchist perspective reflects a scientific consensus on the most likely cause–effect mechanisms and time horizon (100 years) and also applies a 3% discount rate.
The egalitarian perspective is the most precautionary. It includes all known impact pathways for which data are available, spans a long-term time horizon (1000 years), and applies no discounting (0% rate), thus fully incorporating intergenerational equity. Intergenerational equity, as in the egalitarian perspective, is recommended by Stern [29] and considered as a relative consensus endorsed by the 5th Assessment Report of the IPCC [30].
2.2.1 Conversion Factors from GHG to DALY, QALY, and LY and Their Associated UncertaintyAlthough the ReCiPe 2016 model enables the conversion from CO2e (and other pollutant) emissions into DALY, one may prefer metrics such as QALY or LY, which are more commonly used in economic evaluations. To address this, we developed an adapted version of the ReCiPe 2016 model that converts GHG emissions into future health losses in DALYGHG, QALYGHG or LYGHG while incorporating uncertainty. Uncertainty in the conversion factors linking GHG to DALYGHG, QALYGHG or LYGHG was estimated from the input data used to build the original ReCiPe model. Distributions were fitted to the available data using classical probability models, as summarized in Table 1.
Table 1 Summary of model parameters used to estimate the uncertainty surrounding the ReCiPe conversion factorsTo convert DALYGHG to QALYGHG, we used estimates from Augustovski et al. [31], who compared health outcomes of care pathways quantified in both DALYs and QALYs. A log-linear regression model (R2 = 0.99) was used to characterize the conversion, giving equal weight to each study and capturing the associated uncertainty. This model is described in more details in the Supplementary Data (see ESM). The resulting conversion factor from DALY to QALY is therefore a distribution with a mean of 1.05 and a 95% confidence interval of 0.484 to 2.016. This distribution was incorporated into the overall uncertainty for GHG-to-QALYGHG conversion.
Conversion of DALYGHG to LYGHG was performed by dividing by a utility weight representing the quality of life associated with the health state of interest. To propagate uncertainty through all stages of the conversion, we performed a bootstrap procedure with 1,000,000 iterations to generate the final probability distributions for DALYGHG, QALYGHG, and LYGHG (Fig. S1, see ESM).
Findings from Augustovski et al. were corroborated by results from Feng et al. [32], who concluded that while DALY- and QALY-based outcomes may differ for the same intervention, the differences are generally modest and do not substantially affect conclusions regarding cost effectiveness relative to commonly used thresholds.
2.3 Comparison of QALYGHG and QALYpatient to Evaluate Medical Benefit of a Care StrategyIn health technology assessment, three main types of economic evaluations are commonly used: cost-effectiveness analysis (CEA), cost-utility analysis (CUA), and cost-benefit analysis (CBA). CEA compares the costs and health outcomes of different interventions, usually expressed in natural units such as life-years gained. CUA is a specific form of CEA that incorporates both the quantity and quality of life, typically using QALYs as the outcome measure. CBA, on the other hand, assigns a monetary value to both costs and benefits, allowing for a direct comparison between them. Each method provides a different perspective on value and can inform decision making depending on the context and policy objectives.
Within the CUA framework, especially when evaluating or comparing care pathways, it is important to account not only for the incremental health gains experienced by patients (ΔQALYpatient), but also for the incremental future health losses related to greenhouse gas emissions generated by the care pathway (ΔQALYGHG). We propose defining the net health impact from a societal perspective integrated over time as:
A negative result indicates that future losses are higher than gains for nowadays patients.
The ΔQALYGHG emerging from the care pathway emissions and ΔQALYpatient may also be compared using the societal ratio:
$$Societal\, ratio=\frac_}_}$$
This ratio represents the proportion of future QALY losses (due to greenhouse gas emissions) relative to the immediate QALY gains for patients. A societal ratio greater than 100% implies that the health damages incurred in the future outweigh the health benefits obtained today.
This approach can be adapted to other health metrics such as DALY or LY within a CEA framework. When adopting a societal perspective—particularly under the egalitarian ReCiPe perspective—it may be more coherent not to discount QALYs, in order to apply a consistent valuation across present and future health outcomes. Alternatively, a CBA could be conducted by assigning a monetary value to QALYGHG, DALYGHG, or LYGHG. However, this implies incorporating assumptions about future GDP growth to determine an appropriate discount rate, even under an egalitarian perspective (assuming a constant proportion of GDP is allocated to healthcare over time). Such long-term economic projections introduce substantial uncertainty and should therefore be interpreted with caution.
2.4 GHG-Accounting Cost-Effectiveness Ratio in Health Economic AnalysisFor a particular care pathway, or when comparing care pathways, ΔQALYGHG may be integrated in the GHG-accounting incremental cost-effectiveness ratio (ICERGHG) as follows:
This modified ICER accounts for both the health benefits for current patients and the future health losses due to greenhouse gas emissions. A similar approach can be applied using DALY or LY, depending on the health outcome metric of interest. Alternative approaches to integrate future detrimental impacts into CEA include adjusting the numerator of the ICER using the social cost of carbon (SCC), which monetizes the damage associated with each additional tCO₂e emitted. The use of SCC is presented, discussed, and compared with other integration methods in the Supplementary Data (see ESM).
2.5 Estimation of a Care Pathway’s GHG FootprintGreenhouse gas (GHG) emissions associated with a care pathway can be estimated using the GHG footprint methodology described in ISO 14067, which recommends relying on emission factors (EFs) when direct GHG emissions are not available for specific items. Several databases provide emission factors relevant to healthcare, including the HealthcareLCA database [33], the care pathway GHG calculator from the sustainable healthcare coalition (https://shcpathways.org/full-calculator/), and the Ecovamed drug GHG footprint database [10]. In the US, the US EEIO model also provides emission factors, expressed in kgCO₂e per dollar spent (kgCO₂e/$), covering a broad range of products and services, including pharmaceuticals [17].
2.6 Case ApplicationsWe applied our methodology to real-world scenarios using case studies drawn from previously published articles, in order to illustrate the range of possible outcomes when incorporating GHG emissions into HTA. These cases highlight diverse situations, including scenarios where future detrimental impacts may be substantial, or even exceed the direct health benefits, as well as one scenario in which a new strategy reduces GHG emissions while also improving patient outcomes.
When available, direct GHG emissions were used for items (e.g., from the Ecovamed drug GHG footprint database [10]), otherwise, emissions factors were used to estimate emissions (Supplementary Data, see ESM).
GHG accounting (in kgCO2e) was added either on top of already published health economic models or clinical trials for the following interventions: (i) use of anti-PCSK9 antibodies versus placebo for hypercholesterolemia [34], (ii) influenza vaccination versus no vaccination [35], (iii) addition of bevacizumab to first-line treatment in glioblastoma versus placebo [36, 37], and (iv) duration of adjuvant trastuzumab (6 months vs 1 year) in early breast cancer [38] (details for each case study and associated modeling are provided in the Supplementary Data, see ESM).
A model was developed to assess the impact of reducing pembrolizumab infusion doses and treatment duration. The GHG footprint estimates for all case applications are intended to be illustrative and should be interpreted with caution, as they remain approximations in the absence of dedicated LCA studies.
Our objective was not to obtain an absolute quantification of emissions for each care pathway, but rather to compare relative differences in GHG emissions between alternative scenarios. Therefore, only emissions related to components that varied between scenarios were considered. Specifically, drugs and other healthcare expenses for the anti-PCSK9 antibody case; vaccines, travel, and healthcare expenses were considered for the influenza vaccination case; only drug-related emissions were accounted for in the bevacizumab versus placebo comparison in glioblastoma; drugs and outpatient visits were included in the trastuzumab duration comparison in early breast cancer; drugs and outpatient visits were also included for pembrolizumab treatment in first-line non-small cell lung cancer (NSCLC).
Comments (0)