
Remember me
This study used the US Flatiron Health, electronic health record-derived, deidentified database of patients with aNSCLC. The Flatiron Health database is a longitudinal database, comprising deidentified patient-level structured and unstructured data, curated via technology-enabled abstraction [22, 23]. During the study period, the deidentified data originated from approximately 280 US cancer clinics representing more than 800 sites of care. The majority of patients in the database originate from community oncology settings; relative community/academic proportions may vary depending on the study cohort.
The study included patients diagnosed with aNSCLC from January 2011 to April 2023. Patients were included based on a diagnosis of non-small cell lung cancer (NSCLC) using the International Classification of Diseases, Ninth Revision code 162.x or International Classification of Diseases, Tenth Revision codes C34.x or C39.9, pathology consistent with NSCLC, and diagnosed with stage IIIB, IIIC, IVA, or IVB NSCLC on or after 1/1/2011 (or diagnosed with early-stage NSCLC and subsequently develops recurrent or progressive disease on or after 1/1/2011) confirmed by a clinical expert abstractor through unstructured data. The analysis used the aNSCLC dataset from Flatiron Health, which includes patients with at least two clinical visits of any type since 1 January, 2011. The dataset included individuals diagnosed with aNSCLC or those with early-stage NSCLC who subsequently developed advanced disease. The study protocol received approval from the Colorado Multiple Institutional Review Board. All data provided by Flatiron Health was deidentified, with measures in place to prevent reidentification. The study adhered to best-practice guidelines established by the ISPOR Task Force regarding the suitability of electronic health records for health technology assessments [24]. Specifically, we evaluated whether the dataset structure, source consistency, and clinical variable completeness were sufficient to support a reliable characterization of patients with aNSCLC. Additionally, we assessed the analytic cohort’s fitness by comparing the demographic characteristics of the complete case cohort to the unadjusted full cohort (Table A3 of the Electronic Supplementary Material [ESM]). This assessment aimed to determine if the analytic sample remained broadly representative, without formal statistical testing.
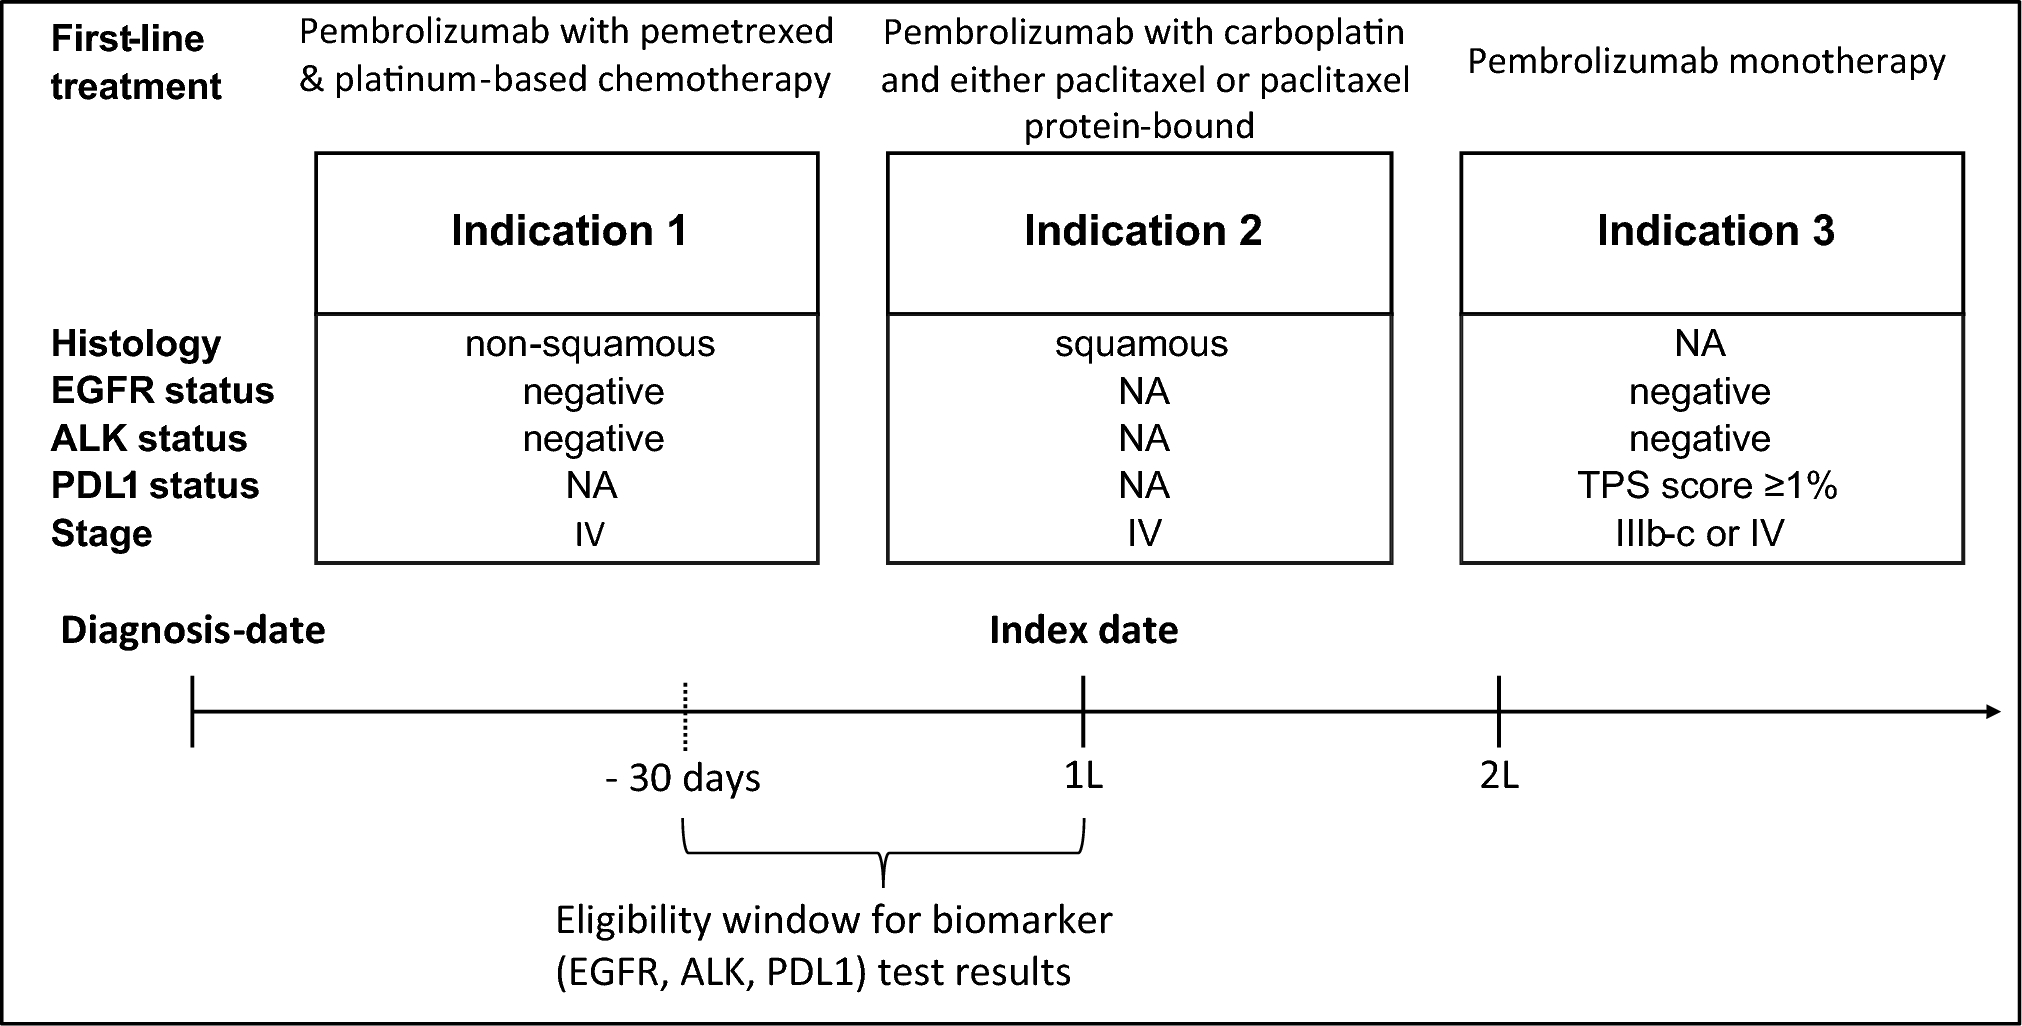
2.2 Patient Cohort Selection and Treatment AssignmentPatients included in the cohort were required to have had received first-line systemic treatment, and eligibility was further limited to those aged 65 years or older (regardless of insurance status), and those aged under 65 years with Medicare insurance. The cohort was subdivided into three groups based on US Food and Drug Administration indications for pembrolizumab treatment [7]. Indication 1 included patients with metastatic non-squamous NSCLC without epidermal growth factor receptor (EGFR) or anaplastic lymphoma kinase (ALK) mutations, Indication 2 comprised those with metastatic squamous NSCLC, and Indication 3 involved patients with metastatic NSCLC with PD-L1 expression (tumor proportion score [TPS] ≥ 1%) and without EGFR or ALK mutations. Biomarker status, including EGFR, ALK, and PD-L1, was verified using test results within a 30-day window before the initiation of first-line therapy (see Fig. 1). In Indications 1 and 3, patients were excluded if they had any positive EGFR or ALK results within the specified time window.
Fig. 1
Epidermal growth factor receptor (EGFR) and anaplastic lymphoma kinase (ALK) status were considered negative only if all results within the specified time window were negative. 1L first line, 2L second line, NA not applicable, PDL1 programmed death-ligand 1, TPS tumor proportion score
Histology and biomarker-based filtering
Within each indication group, patients were assigned to treatment and control groups based on Food and Drug Administration-approved indications for pembrolizumab as a first-line treatment (hereafter “pembrolizumab therapies”) [7]. In Indication 1, patients received pembrolizumab with pemetrexed and platinum chemotherapy; in Indication 2, pembrolizumab with carboplatin and either paclitaxel or paclitaxel protein bound; and in Indication 3, pembrolizumab monotherapy. Patients treated with pembrolizumab who did not meet the criteria for Indications 1, 2, or 3, such as those receiving non-designated combinations (e.g., pembrolizumab + platinum + pemetrexed for patients having a positive EGFR or ALK mutation) were not included in the indication-specific cohorts. For patients assigned to the control group, we identified and ranked chemotherapy regimens by utilization frequency and selected those accounting for approximately 80% of observed use (more details in Table A2 of the ESM). Patients without a recorded date of death or those in control groups who switched to pembrolizumab-based therapies at subsequent-line treatments were right censored at the date of the last recorded visit and the initiation of subsequent therapies, respectively. A new line of therapy was defined as the initiation of systemic treatment, as evidenced by an order or administration of an antineoplastic agent in the electronic health record. A new line of therapy was assigned when a gap of more than 120 days occurred between any two consecutive drug administrations.
2.3 Statistical AnalysisThe study evaluated real-world progression-free survival (PFS) and overall survival (OS). PFS was measured from the therapy start date to progression or death, with progression identified through clinician-documented evidence abstracted from electronic health records. OS was measured from the index date (treatment start date) to death. Propensity score (PS) weighting addressed confounding and balanced treatment groups, with PS estimated through logistic regressions considering factors such as age, sex, race, smoking status, and cancer stage. The complete case cohort included only patients with non-missing covariates required for PS modeling. The IPW-adjusted Kaplan–Meier method was used for the survival analysis, calculating median and restricted mean survival times (RMSTs) with a 60-month truncation. The confidence interval (CI) for median survival differences was estimated using bootstrapping with IPW weights. The Cox proportional hazards model was not used because of the assumption of violations (see Appendix A17 of the ESM); instead, outcomes were evaluated using IPW-adjusted methods. The decision to exclude hazard ratios aligns with critiques of their limitations in non-proportional settings [25]. All analyses were conducted using R version 4.2.2.
2.4 Analytical Considerations and Scenario AnalysesThe study examined how various analytical considerations influence comparative effectiveness outcomes. Specifically, the focus was on four key choices: (1) selecting the time period for the control group; (2) incorporating PD-L1 levels as covariates; (3) identifying the relevant market basket of therapeutic alternatives; and (4) applying right censoring at the point of treatment switching. These scenarios were chosen based on their relevance to real-world clinical and methodological challenges in oncology research, as identified in prior studies and methodological guidance on comparative effectiveness research [18, 26, 27].
In what follows, we describe each of these four analytic considerations in detail. For each, we provide: (a) an explanation of its importance and potential impact on comparative effectiveness outcomes (Context); (b) the rationale for its treatment in the base-case analysis (Base case); and (c) a discussion of the sensitivity analyses conducted to explore alternative assumptions (Scenarios). This structured approach aims to highlight how these key decisions can shape OS and PFS benefits of pembrolizumab therapies compared to therapeutic alternatives. Table 1 summarizes each of these decisions.
Table 1 Analytical considerations for the base case and the scenarios2.4.1 Selecting the Time Period for the Control Group (Choice 1)Context: The dataset spans 2011–23, highlighting the introduction of pembrolizumab in 2016 and its adoption by 2017, which partially replaced platinum-based chemotherapy. Including pre-2017 data could bias treatment probability estimates as those patients lacked access to pembrolizumab therapies. Analyzing only post-2017 data risks confounding by indication because of incomplete therapy selection rationale, especially for controls.
Base case: To mitigate these issues, the base case for Indications 1 and 2 utilized a time-stratified IPW approach to create a representative chemotherapy control group and enable valid comparisons with pembrolizumab therapies. Separate PS models were developed for both the entire study period (2011–23) and post-2017 (2017–23), combining IPWs into one model. Each patient received weights from only one model based on their treatment start year: those treated in post-2017 were assigned weights from the PD-L1-adjusted model, and earlier patients from the full-period model. When merging by patient ID, patients with weights from both models (2017–23) were assigned the recent-period weight, using a coalescence approach. For Indication 3, PS estimation was restricted to the post-2017 period because of the availability of PD-L1 expression data.
Scenarios: Scenarios (1a and 1b) tested the impact of time period selection, including one where cohorts treated only after pembrolizumab availability were analyzed, and another that constructed a historical control from patients treated between 2011 and 2016. A PS model from post-2017 data was used to predict treatment probabilities for patients treated in 2011–16, assuming that the relationship between covariates and treatment assignment observed after 2017 would have applied similarly in the earlier period had pembrolizumab been available.
2.4.2 Incorporating PD-L1 Levels as Covariates (Choice 2)Context: The relationship between PD-L1 expression levels and the efficacy of pembrolizumab therapies is debated. Some studies, like Keynote-001 [28] and Keynote-042 [29], indicated that patients with PD-L1 TPS ≥ 50% experience higher response rates and longer OS. However, conflicting results exist: one study [30] found no significant impact of PD-L1 levels on OS for patients with TPS ≥ 50% receiving pembrolizumab alone. Furthermore, the Keynote-189 trial [31] showed improved OS and PFS with pembrolizumab plus chemotherapy, regardless of PD-L1 levels. Since widespread PD-L1 testing began in 2017, including PD-L1 levels as a covariate in the PS models would exclude pre-2017 patients and a substantial portion of post-2017 patients in the chemotherapy control group. This exclusion might narrow the cohort size and affect the robustness of historical comparisons (see Table A3 in the ESM).
Base case: In the base case, PD-L1 levels were not included, allowing for broader patient inclusion.
Scenario: In a separate scenario (2a), PD-L1 levels were included in the PS model, focusing on post-2017 data.
2.4.3 Identifying Therapeutic Alternatives (Choice 3)Context: Clinical guidelines for aNSCLC recommend various platinum-based combination chemotherapies, such as cisplatin or carboplatin with vinorelbine, paclitaxel, docetaxel, gemcitabine, irinotecan, protein-bound paclitaxel, and pemetrexed. There is no standard regimen, leading to preferences for certain combinations in practice. Analyzing each regimen individually is impractical, so commonly used therapies could be grouped into a “market basket” to reflect real-world patterns and to provide a larger cohort size. However, this approach can introduce bias: (1) therapy utilization frequencies have changed over time, which can skew the representation of options and (2) IPW may overrepresent or underrepresent certain treatments in overall results. To explore these issues, two analytical approaches were employed.
Base case: In the base case, the most frequently used chemotherapy regimens during the study period—platinum-based chemotherapy regimens with pemetrexed—were selected as therapeutic alternatives.
Scenario: Separate analyses were conducted for less prevalent chemotherapy combinations (scenarios 3a and 3b). Additionally, scenario 3c included a market basket that encompasses all therapeutic alternatives that met the threshold.
2.4.4 Applying Right Censoring at the Point of Treatment Switching (Choice 4)Context: Outcomes for patients starting on chemotherapy and switching to pembrolizumab therapies in subsequent lines may not reflect the outcomes achievable if pembrolizumab therapies were unavailable. In the context of CMS price negotiations, it is important to simulate a scenario where pembrolizumab therapies are not accessible in the first or subsequent lines of therapy. Additionally, it may also be informative to assess the outcomes when pembrolizumab is available in later lines of treatment (i.e., not considering right censoring at all) to reveal the impact of right censoring.
Base case: In the base case, patients are right censored when they switch to pembrolizumab in subsequent lines, allowing the possibility of switching to other PD-L1-based therapies.
Scenario: In scenario 4a, we assumed that PD-L1 therapies would be unavailable in subsequent lines because of their high cost being comparable to that of pembrolizumab. This isolates the effect of pembrolizumab therapies in comparison to chemotherapy alone. Although right censoring at treatment switching enhances internal validity by isolating the impact of chemotherapy alone (i.e., in the absence of pembrolizumab), it may limit the generalizability to clinical practice, where treatment switching—especially to PD-L1 therapies—is common. To address this limitation, we included a scenario analysis (4b) where no censoring at switching was applied. This simulates a situation in which pembrolizumab is available in subsequent treatment lines, allowing us to better approximate real-world care patterns and assess the robustness of our findings across different assumptions.
Comments (0)