
Remember me
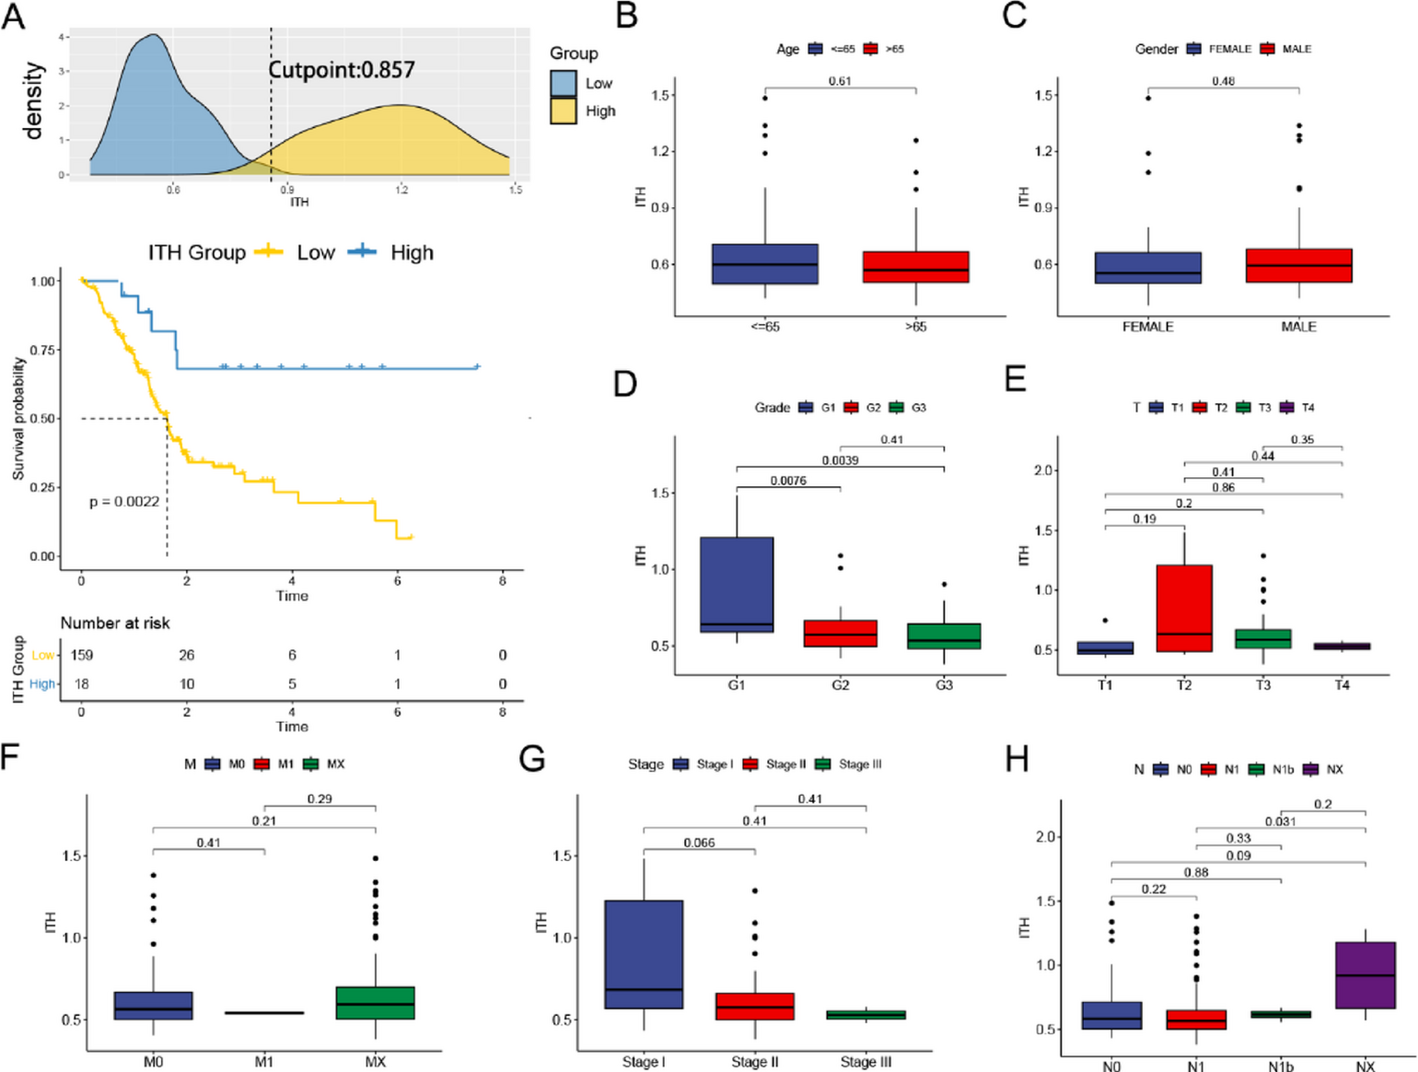

To quantify ITH in pancreatic cancer samples from the TCGA database, we first utilized the DEPTH2 software. Using the surv_cutpoint() function, we established the optimal cutoff for ITH scores and subsequently divided the samples into high-ITH and low-ITH groups with the surv_categorize() function. After performing a distribution analysis, survival curves were generated based on the chosen threshold. As depicted in Fig. 1A, the low-ITH group demonstrated a significantly worse prognosis.
Fig. 1
Correlations between ITH scores and clinicopathological features in PAAD patients. A. Distribution of ITH scores and selection of the optimal cut-off point. Survival analysis for patients with high or low expression of ITH scores. Differences in Age (B), Gender(C), Grade(D), T(E), M (F), Stage(G), and N(H) between high-ITH and low-ITH groups
No statistically significant differences in age, gender, or T/N/M stages were observed when comparing the clinical characteristics of the high- and low-ITH groups (Fig. 1B, C, E, F, H). Patients with higher tumor grades and advanced clinical stages exhibited significantly lower ITH scores (Fig. 1D, G), which aligns with the poorer overall survival observed in the low-ITH group. These results suggest the need for further investigation into the molecular mechanisms and differentially expressed genes related to ITH.
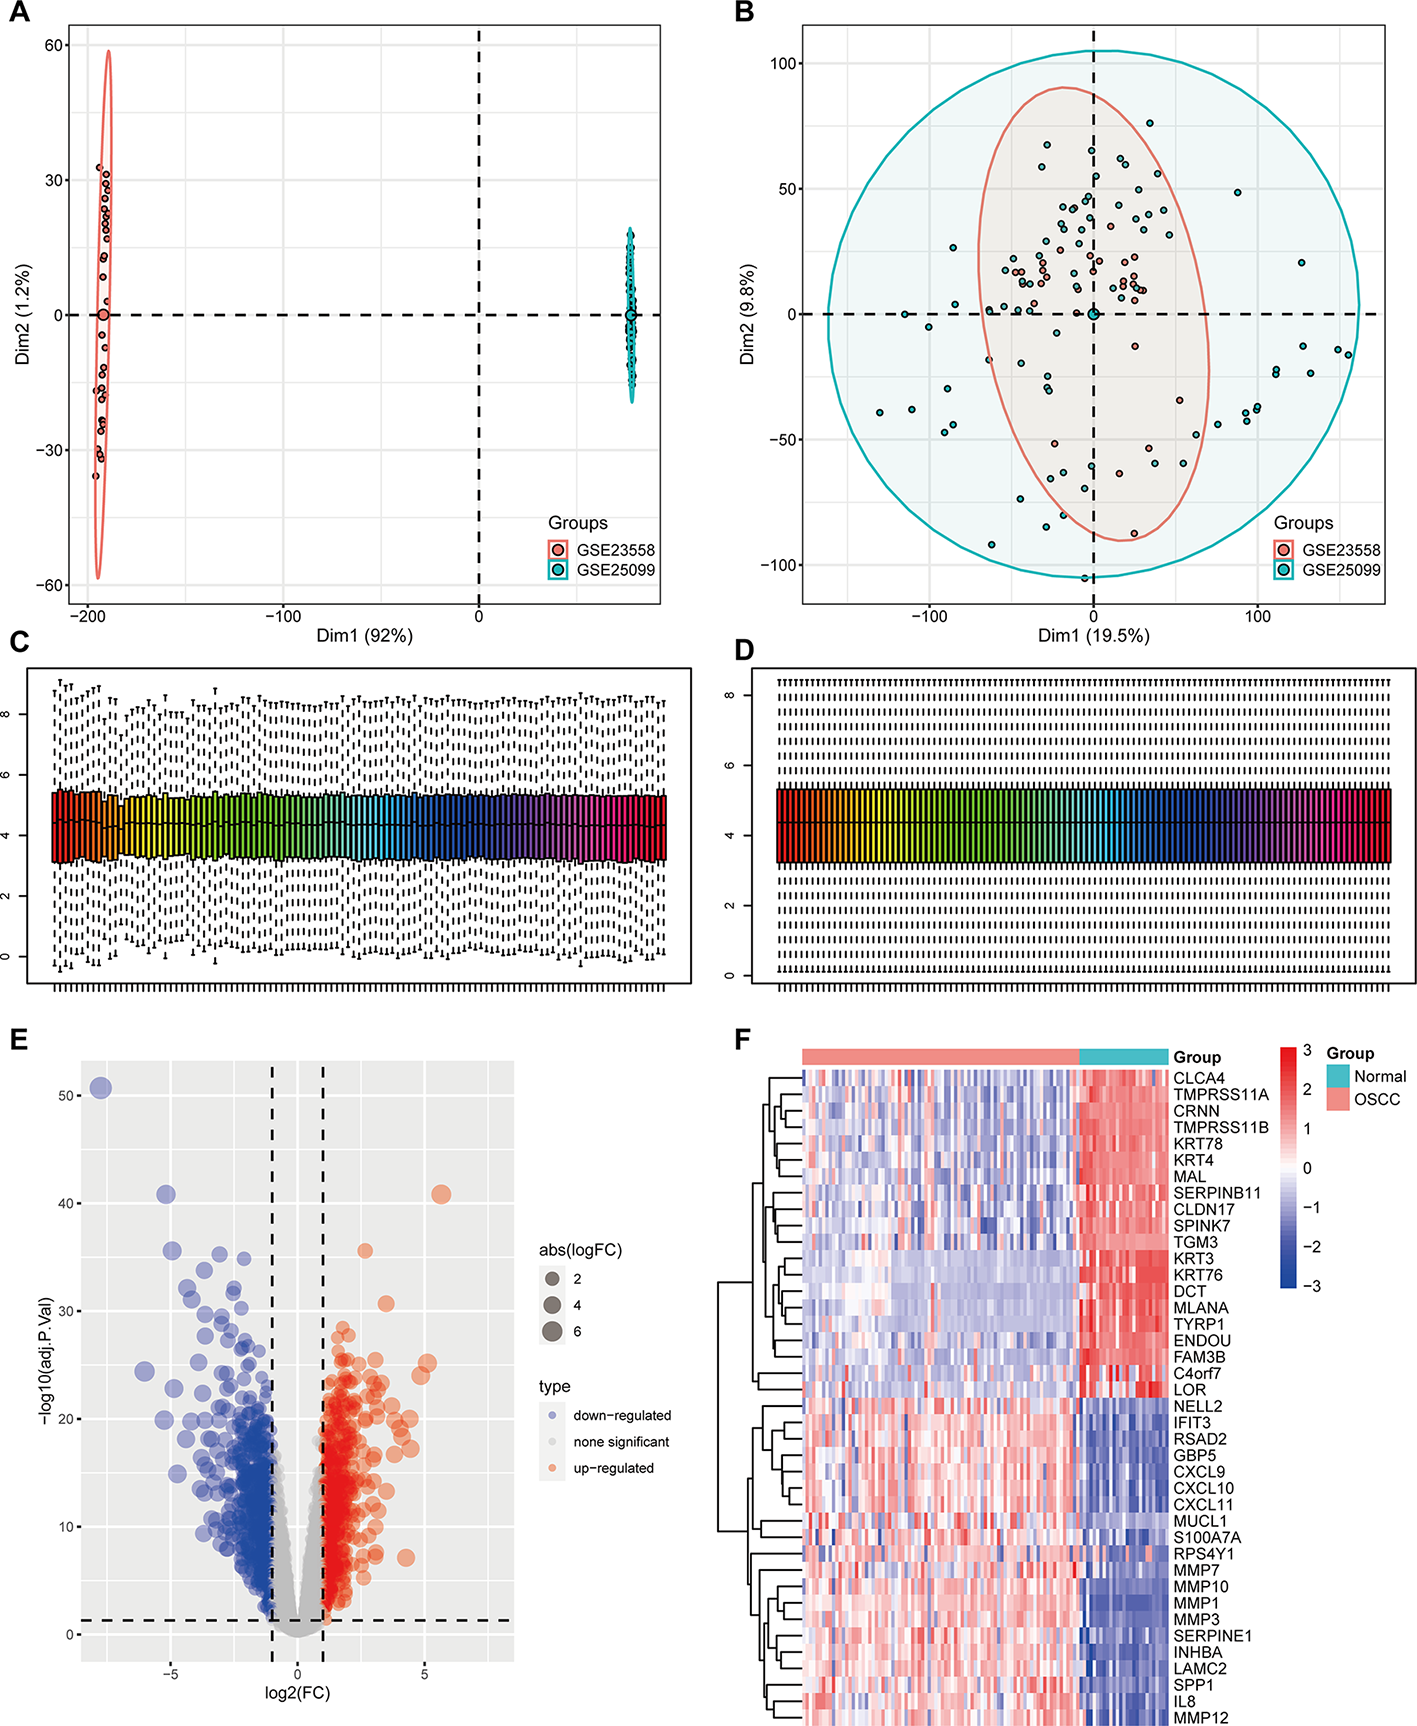
We performed differential gene expression analysis comparing high-ITH and low-ITH samples to investigate further the factors contributing to the poor prognosis observed in the low-ITH group. One thousand eight hundred forty-eight differentially expressed genes (DEGs) were identified, of which 345 were upregulated and 1,503 were downregulated in the low-ITH group. A heatmap depicting the top 50 DEGs is shown in Fig. 2A. A total of 302 genes were identified through univariate Cox regression analysis as significantly associated with overall survival. A forest plot (Fig. 2B) illustrates the top 20 genes. The correlation analysis among these prognostic genes revealed mostly positive associations (Fig. 2C). Twelve genes were classified as risk factors, whereas eight were associated with a favorable prognosis.
Fig. 2
Differential gene expression and functional analysis; (A) The top 50 differentially expressed genes are displayed in a heatmap. (B) Forest plot of the Univariate Cox regression analysis; (C) Displays the correlation analysis between ITH-related differentially expressed genes; (D) GO term enrichment showing biological processes, molecular functions, and cellular components; (E) KEGG pathway mapping
3.2 Biological functions analysesWe conducted enrichment analyses based on KEGG pathways and GO functional annotation to better understand the biological functions of differentially expressed genes (DEGs) in pancreatic cancer progression. The GO analysis categorized the DEGs into three areas: Biological Process (BP), Molecular Function (MF), and Cellular Component (CC). Biological process (BP) analysis revealed significant enrichment of differentially expressed genes (DEGs) in pathways critical to pancreatic cancer progression, including cell migration, extracellular matrix (ECM) remodeling, angiogenesis, and inflammatory regulation. These findings implicate DEGs mediating tumor invasiveness, metastatic dissemination, and immune microenvironment modulation. In the MF category, the most significantly enriched functions included structural molecule activity, protein binding, and integrin binding, reflecting their roles in maintaining cellular structural integrity and mediating signal transduction. Regarding CC, DEGs were predominantly localized to the extracellular region, extracellular matrix, and cytoplasm, indicating their potential involvement in the tumor microenvironment and signal transduction processes(Fig. 2D).
KEGG enrichment analysis showed that DEGs were predominantly mapped to pathways critical for pancreatic cancer biology. Highly enriched terms encompassed structural dynamics (muscle cytoskeleton, ECM-receptor binding) and pro-tumorigenic signaling (PI3K-Akt activation, cytokine networks, and proteoglycan-driven malignancy), reinforcing their roles in stromal remodeling and oncogenic progression (Fig. 2E).
The convergent evidence from KEGG and GO analyses provides a systems-level understanding of pancreatic cancer biology, uncovering canonical and novel disease-relevant pathways. These mechanistic insights create actionable opportunities for targeted drug discovery and personalized therapeutic strategies.
3.3 Construction of an integrated machine Learning-Based prognostic signatureEmploying a multi-algorithmic machine learning framework, we derived the ITH-S prognostic signature from 302 candidate genes initially selected via univariate Cox analysis. This framework incorporated 10 different machine learning algorithms and 101 algorithmic combinations. Patients with PC from the TCGA dataset were randomly assigned to a training set, and an independent GEO dataset was employed for external validation.
We applied 10-fold cross-validation to develop 101 predictive models and assessed their performance by calculating the concordance index (C-index) across training and validation sets (Fig. 3A). Using 10-fold cross-validation, the optimal λ value in the LASSO regression was selected based on the minimum partial likelihood deviance (Fig. 3B, C). A subsequent stepwise multivariate Cox regression analysis of genes with non-zero coefficients identified 11 genes with significant independent prognostic relevance. These 11 identified genes with the most robust prognostic value were used to develop the final risk model. The individual risk score was calculated as the sum of the products of each gene’s expression level and its corresponding Cox regression coefficient (Fig. 3D, E).
Fig. 3
Construction and evaluation of prognostic model. (A) The concordance index(C-index) heatmap of machine learning algorithms; (B) Lasso coefficient profiles of ITH-related prognostic genes; (C) Identification of the lasso optimal parameter (lambda); (D) Bar chart displaying Univariate Cox coefficient profiles; (E) Univariate Cox regression results visualized by forest plot; F.The riskScore distribution and OS status distribution; G. Survival prediction performance of ITH-risk model assessed by time-dependent ROC analysis at three clinical endpoints (1/3/5-year OS); H. Survival Analysis of ITH-risk High and Low Grouping Patients with PAAD in TCGA; I. Survival analysis of high and low ITH-risk subgroups in PAAD patients in GEO
Patients were classified into high- and low-risk groups using the median risk score as a cutoff. Figure 3F demonstrates a clear trend of increasing mortality with higher risk scores, underscoring the prognostic significance of the risk model. The predictive capability of the risk model was validated using Kaplan–Meier analysis and time-dependent ROC curves. In the training cohort, the model yielded AUCs of 0.797, 0.734, and 0.786 for 1-, 3-, and 5-year OS predictions, respectively (Fig. 3G). Significant survival differences were observed between high- and low-risk groups in both the training and external validation sets, with high-risk patients experiencing markedly worse outcomes (Fig. 3H, I).
3.4 Construction and evaluation of the prognostic modelUnivariate and multivariate Cox regression analyses confirmed the risk score as an independent prognostic factor for PC (Fig. 4A, B). To assess the model’s discriminative ability in survival prediction, time-dependent concordance index (C-index) curves were plotted. Analysis showed that, throughout the timeline, the risk model maintained a consistently higher concordance index compared to traditional clinical parameters (Fig. 4C).
Fig. 4
Construction of a nomogram (A) Forest plot of the univariate Cox analysis; (B) Forest plot of the multivariate Cox analysis; (C) concordance index showed the prognostic predictive ability of ITH-risk model and clinical characteristics; D, E. ROC curve of risk score at 1, 3, and 5 years; F The nomogram combined with the variables; G. ROC curve analysis evaluates the prognostic value of risk scoring models and clinical features; H. Calibration curve of the nomogram at 1, 3, and 5 years
Five key variables, including age, sex, tumor grade, stage, and the risk model, were selected through machine learning and logistic regression analyses to construct a comprehensive clinical prognostic model for pancreatic adenocarcinoma (PAAD). A nomogram was then generated to visualize this integrated predictive model (Fig. 4F). Time-dependent receiver operating characteristic (ROC) curve analysis was performed to evaluate the model’s predictive accuracy at 1-, 3-, and 5-year survival intervals(Fig. 4D, G). The study demonstrated that the risk model’s area under the curve (AUC) was consistently higher than other clinical variables, indicating its robust predictive value for patient prognosis (Fig. 4E). The robustness and predictive precision of the nomogram were further confirmed by time-dependent calibration curves, which demonstrated close agreement between predicted and observed survival probabilities (Fig. 4H).
3.5 Immune landscape analysisEmerging evidence has highlighted the critical role of immune cells within the tumor microenvironment in tumor initiation, progression, and patient outcomes. We used a variety of immune deconvolution algorithms, such as CIBERSORT, EPIC, and TIMER, to examine the immune infiltration patterns between risk groups, providing a detailed comparison of immune cell distribution across different risk categories. Immune landscape analysis revealed substantial differences in cell infiltration patterns between risk groups. The high-risk group exhibited a pro-inflammatory yet immunosuppressive microenvironment, characterized by increased neutrophils and M1 macrophages. Still, reduced NK and memory B cells suggest an immune contexture potentially unfavorable for antitumor immunity (Fig. 5A).
Fig. 5
Immune microenvironments Analysis in different groups (A) Various algorithms estimates tumor-infltrating immune cells; (B) Diferences in immune-related functions between two risk groups; (C) Diferences in immune checkpoints between two risk groups; (D) Analysis of the possibility of tumor immune escape by TIDE; (E) Comparison of tumor gene mutation burden between high and low risk groups; (F) Correlation analysis of tumor gene mutation burden in high and low risk groups; (G) Stratified survival analysis based on TMB threshold; (H) Differential survival outcomes by TMB status within each ITH stratum; (I) GSEA analysis for high and low risk groups
The study identified significant immune functional differences between risk groups, particularly highlighting aberrant activity in APC co-inhibition, parainflammation, and type I interferon response pathways among high-risk individuals(Fig. 5B).
We also analyzed immune checkpoint molecule expression and discovered 12 immune checkpoint genes with significant differential expression. Immunocheckpoint analysis revealed distinct expression patterns between risk groups, with seven inhibitory checkpoints (including TNFRSF4, IDO-2, and CD160) showing significantly higher expression in the low-risk group. In comparison, five stimulatory checkpoints (such as CD276, CD274, and VTCN1) were overexpressed in the high-risk group. These findings imply differential immune escape mechanisms and potential responsiveness to immunotherapy in each group(Fig. 5C).
The TIDE algorithm revealed distinct immune evasion profiles, with high-risk patients showing significantly lower composite scores (reflecting dysfunction and exclusion mechanisms) than low-risk counterparts (Fig. 5D). This pattern suggests the high-risk subgroup may exhibit more favorable tumor-immune microenvironments for checkpoint blockade therapy.
While tumor mutation burden (TMB) did not differ significantly between risk groups (p = 0.13, Wilcoxon test; Fig. 5E-F) nor correlate with risk scores (r = 0.15, p = 0.079), survival analysis revealed a synergistic prognostic impact: patients with concurrent high-risk scores and high TMB showed markedly reduced overall survival compared to those with low-risk/low-TMB profiles (Fig. 5G-H), suggesting combined effects of molecular risk signatures and genomic instability.
GSEA revealed distinct pathway activation patterns between risk groups (FDR < 0.05). The high-risk group showed significant enrichment in proliferation-related pathways (Adherens Junction; Cell Cycle) and xenobiotic metabolism (Cytochrome P450). Conversely, the low-risk group exhibited enrichment in immune regulation (Primary Immunodeficiency) and neuroendocrine signaling (Neuroactive Ligand-Receptor Interaction) pathways (Fig. 5I).
These findings highlight the significant differences between high-risk and low-risk groups in immune cell infiltration, immune functions, and underlying biological behaviors. These results emphasize the potential of the risk score as not only a reliable prognostic marker but also a valuable predictor of immunotherapeutic responsiveness in patients with pancreatic adenocarcinoma (PAAD).
3.6 Drug sensitivity analysisTo investigate the risk model’s clinical applicability, we analyzed differential drug sensitivity between high- and low-risk groups using the pRRophetic algorithm. Based on their transcriptomic profiles, this computational approach estimated the half-maximal inhibitory concentration (IC₅₀) of standard chemotherapeutic and targeted therapies for pancreatic adenocarcinoma (PAAD) patients.
Distinct drug response patterns were observed across risk groups, highlighting potential variations in treatment efficacy. High-risk patients showed enhanced sensitivity (reduced IC₅₀) to tyrosine kinase inhibitors (e.g., Erlotinib, Sapitinib). In contrast, low-risk patients responded more to PARP and BCR-ABL inhibitors (Olaparib and Nilotinib, respectively) (Fig. 6A).
Fig. 6
Chemotherapeutic drugs sensitivity analysis. (A) Boxplot visualization of estimated IC50 values for common anti-tumor agents across pancreatic cancer patient subgroups stratified by ITH score; (B) A comparative analysis of drug sensitivity was conducted between the two risk groups
These findings suggest that risk stratification may inform personalized chemotherapy regimens.
3.6.1 Analysis of ITH-Related changes based on Single-Cell transcriptomicsBuilding upon the insights from bulk RNA sequencing, we sought to explore the distribution of ITH across distinct cell populations at the single-cell resolution. To enable downstream analysis, we processed the single-cell RNA-seq dataset GSE212966, which included three pancreatic cancer and three peri-cancerous tissue samples.
After quality control (Figure S1-D), dimensionality reduction via t-SNE and UMAP identified 21 distinct cell clusters manually annotated using established cell-type-specific markers (Figure S2). The spatial distribution of these clusters was visualized using t-SNE (Fig. 7A-B) and UMAP plots (Fig. 7C). To quantify ITH at the single-cell level, we employed the “AddModuleScore” function to score each cell based on a curated set of ITH-related signature genes. The results demonstrated that ITH scores were significantly elevated in tumor tissues (Fig. 7D), particularly in epithelial cells (Fig. 7E-G). Subsequently, we identified 10 distinct epithelial cell subpopulations (Fig. 7H). The first epithelial cluster exhibited the highest ITH score (Fig. 7I). To further explore the dynamic progression of epithelial cells, we constructed developmental trajectories to infer the differentiation states between tumor and adjacent normal tissues. Pseudotime analysis revealed three distinct cellular states across the epithelial subpopulations. Epi2–6 subtypes were predominantly enriched in states 2 and 3, whereas the Epi0 subtype was confined mainly to state 1. Based on pseudotime annotations, state four was considered a potential progenitor/root-like state (Fig. 7J).
Fig. 7
Single-cell analysis of ITH score in PAAD (A) t-SNE plot of normal and tumor cells; (B) t-SNE plot of 21 cell clusters; (C) UMAP of nine cell types; (D) A comparative analysis of ITH score between PAAD and adjacent tissues; (E) Violin plots showing ITH score in different clusters of PAAD; (F) Violin plots showing ITH score in PAAD and adjacent tissues; (G) UMAP projection showing ITH score in different clusters; (H) Display clusters of endothelial cells by t-SNE plot; (I) Display the ITH scores of different endothelial cell clusters; (J) Differentiation trajectory colored for states, pseudotime, tissue types, and clusters
Based on transcriptomic features, endothelial cells were categorized into three ITH levels: high, medium, and low. To investigate intercellular communication, we performed CellChat analysis to examine interaction differences among endothelial subgroups and other cell types. As shown in Fig. 8A, the number of receptor–ligand interactions and the cumulative strength of intercellular communication were quantified across cell types. Thicker lines represent stronger interactions; line colors match the source cell population, while the opposing nodes denote the target population.
Fig. 8
Cell communication analysis of scRNA-seq data. (A) Number of interactions and intensity of action of different cell types in the normal and tumor groups; (B) Bubble diagram of receptor-mediated cellular communication; (C) The contribution of cell populations to all signaling pathways; (D) Visualize the primary signal sender.
(source) and signal receiver (target); E. Display of GALECTIN SIGNALING PATHWAY among different cell types; F. ITH highepithelial cell communication networks with other cell types;
ITH-high endothelial cells exhibited significantly enhanced interaction strength with most other cell types. Ligand–receptor correlation analysis suggested that ITH-associated epithelial cells may influence ductal cells and macrophages through signaling axes such as MIF-(CD74 + CXCR4) and MIF-(CD74 + CD44). (Fig. 8B)
Further analyses highlighted Galectin signaling as the dominant outgoing communication pathway in ITH-high endothelial cells, whereas SPP1-related pathways were identified as major contributors to incoming signals(Fig. 8C). Scatterplots were used to visualize key sender–receiver cell types(Fig. 8D). Compared to other cell populations, ITH-high endothelial cells were identified as significant sources of GALECTIN signaling, which predominantly targeted macrophages. Additionally, GALECTIN pathways mediated interactions between ITH-high endothelial cells and monocytes, T cells, and ductal epithelial cells, suggesting a critical role of this signaling axis in promoting PAAD progression(Figs. 8E-F).
Comments (0)