
Remember me

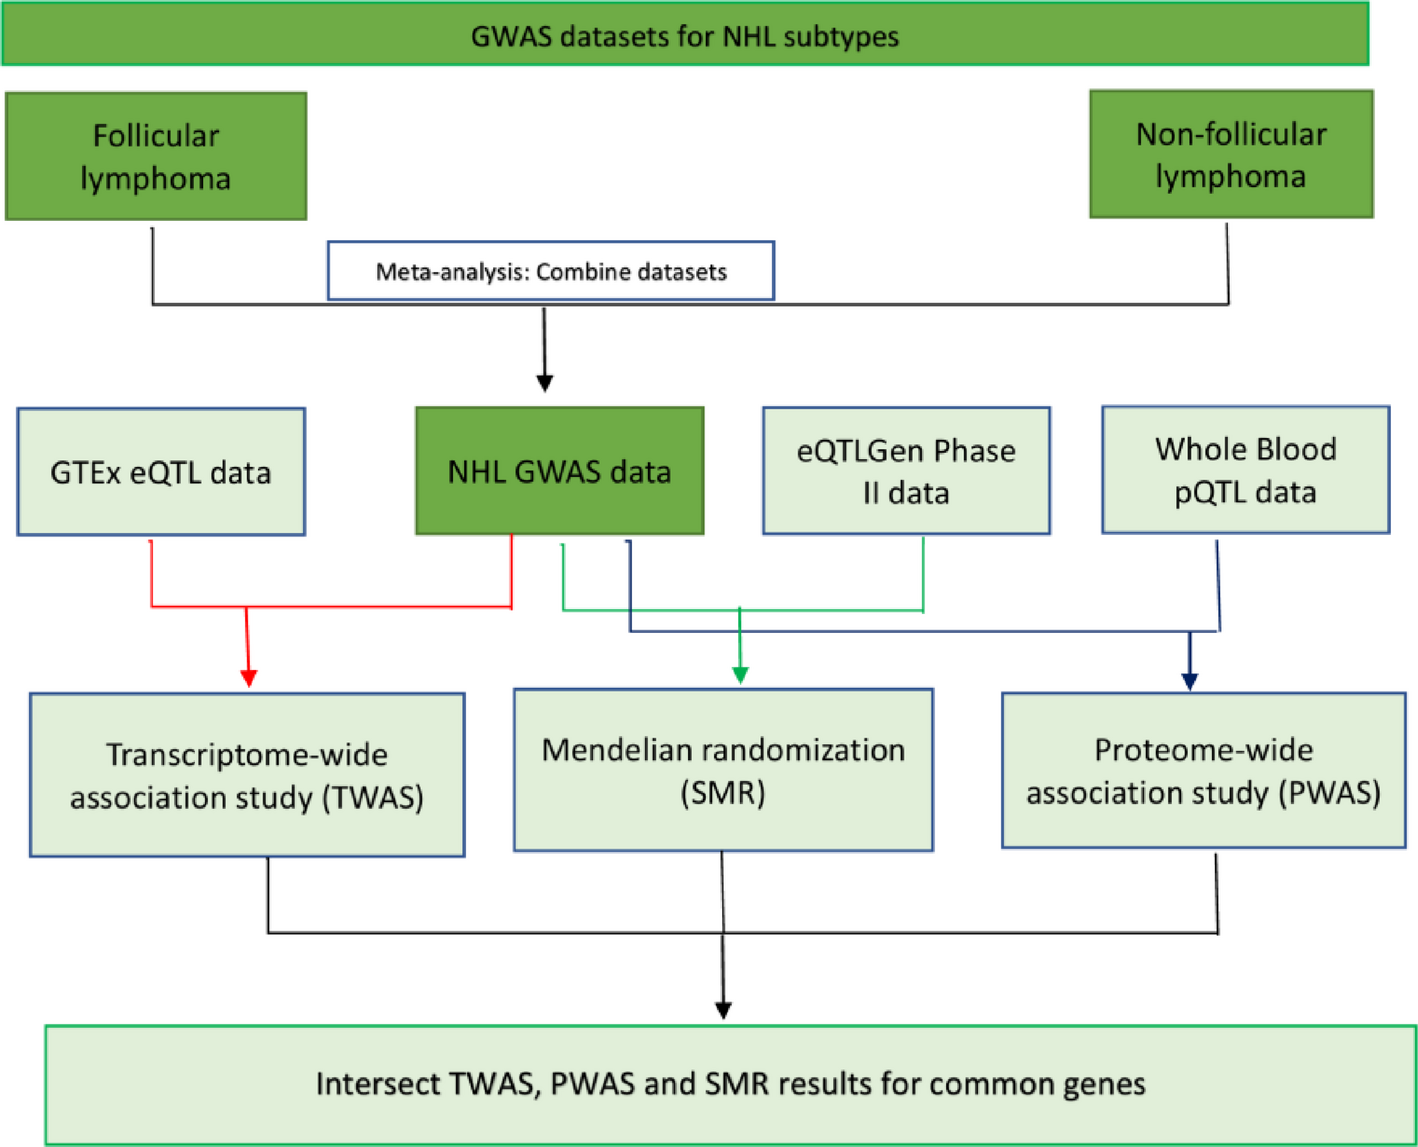

The study design is shown in Fig. 1. To enhance the sample size and statistical efficiency, the two-sample MR design was utilized. Single-nucleotide polymorphisms (SNPs) were used as instrumental variables (IVs). Three fundamental assumptions underpinned the approach: Firstly, the genetic instruments had a relationship with the modifiable risk factors (the exposure); secondly, their impact on EC (the outcome) was exclusively via these modifiable risk factors, without any influence from other routes (namely, pleiotropy); and thirdly, they were not associated with potential confounding variables [12].
Fig. 1
Diagrammatic representation of the study design
2.2 Data sourceAll data were obtained from publicly available source or previously conducted studies. No informed consent was required.
2.2.1 Outcome dataEC GWAS data were obtained from UK Biobank via IEU. UK Biobank (UKB, https://www.ukbiobank.ac.uk/learn-more-about-uk-biobank) is a vast database with comprehensive genetic and health data from over 500,000 participants [13]. The EC outcome dataset comprised 740 cases, 372,016 controls, and 8,970,465 SNPs. Steps followed to determine risk factors regarding the causal relationships and the source of exposure data are described.
2.2.2 Exposure dataSeveral factors likely associated with EC were selected. Next, we divided modifiable risk factors into 4 categories, lifestyle, glycemic traits, lipid profiles and body shape. Modifiable risk factors included 4 lifestyles (alcohol consumption, coffee intake, current tobacco smoking, education duration), 3 glycemic traits (type 2 diabetes, fasting glucose, fasting insulin), 3 lipid profiles (LDL-C, HDL-C, triglycerides) and 4 body shapes (body mass index (BMI), hip circumference, waist circumference, waist-to-hip ratio) [14,15,16,17,18,19,20,21]. All exposure-related GWAS data are of European origin.
Datasets of GWAS results for body mass index and waist-to-hip ratio were sourced from an international consortium, the Genetic Investigation of Anthropometric Traits (GIANT, https://portals.broadinstitute.org/collaboration/giant/index.php/GIANT_consortium) [22].
GWAS data on coffee intake, smoking, hip circumference, and waist circumference were obtained from the Medical Research Council Integrative Epidemiology Unit at the University of Bristol (MRC-IEU, https://www.bristol.ac.uk/integrative-epidemiology/). MRC-IEU conducts cutting-edge population health science research to integrate various data types for identifying causal associations between modifiable exposures and health outcomes [23].
The dataset for Type 2 diabetes was sourced from the FinnGen database (https://finngen.gitbook.io/documentation/), which includes genotype data from both newly collected and legacy samples of Finnish biobanks, alongside digital health record data from Finnish health registries [24].
For education duration, the dataset was obtained from Social Science Genetic Asso-ciation Consortium (SSGAC, https://www.thessgac.org/the-ssgac) used to coordinate genetic association studies for social science outcomes [25].
Fasting glucose data and Fasting insulin data were derived from a previous study [26] involving 281,416 individuals without diabetes (70% European ancestry).
Data on low-density lipoprotein cholesterol (LDL-C), high-density lipoprotein cholesterol (HDL-C), and triglycerides (TG) were obtained from the Global Lipids Genetics Consortium (GLGC, http://www.lipidgenetics.org/#locuszoom) [27]. The meta-analysis statistics in Willer’s study include all studies (i.e., UK biobank is included in the meta-analysis).
GWAS data on alcohol consumption were from GWAS and Sequencing Consortium of Alcohol and Nicotine use (GSCAN, https://genome.psych.umn.edu/index.php/GSCAN), which aggregates genetic associa-tion findings to reveal the etiology of alcohol and nicotine use and addiction [28]. Liu et al. studied the association between alcohol use and SNPs in a dataset of 339,354 samples, including up to 1.2 million individuals [28].
Detailed sources oHandling of Missing Data: The study did not explicitly mention the handling of missing data. Given that all data were obtained from comprehensive, publicly available GWAS datasets with robust quality control procedures, it is likely that any missing data were minimal or already addressed in the original datasets. The extensive use of multiple data sources and stringent inclusion criteria for SNP selection further ensured the reliability and completeness of the data used in the analysis.f exposure data source can be found in Table 1.
2.2.3 Instrumental variables (IV) selectionIn our analysis, we used Single-nucleotide polymorphisms (SNPs) as IVs, sourced from extensive GWASs [29]. To confirm the validity of the selected SNPs, we applied specific inclusion criteria. Initially, SNPs were chosen from the original datasets if they demonstrated genome-wide significance, indicated by a p-value of ≤ 5 × 10⁻⁸. We harmonized all SNPs to guarantee that effect estimates were aligned with the same allele. In dealing with potential weak instrument bias, the strength of the instrumental variables was evaluated using the F statistic. Instrumental variables exhibiting an F statistic lower than 10, indicative of weaker instruments, were excluded from our analysis.
Table 1 Phenotype source and description2.3 Statistical analysisTo ascertain the causal estimate of the relationship between exposure (modifiable risk factors) and outcome (EC), we employed five methods: inverse variance weighting (IVW), MR-Egger, the weighted median (WM), the weighted mode, and the simple mode. The IVW approach is widely used as the primary MR model, as it provides precise estimates when all genetic instruments are valid and there is no horizontal pleiotropy. However, its results can be biased if any instrument has a direct effect on the outcome independent of the exposure. IVW amalgamates the Wald ratio estimates from each study, providing insight into the causal relationship between different modifiable risk factors and EC, the target outcome. To mitigate the impact of potentially invalid IVs, we incorporated four supplementary models, augmenting the robustness of our findings in conjunction with the IVW estimation [30].
The MR-Egger method was employed to adjust for biases arising from pleiotropy [31]. This method assesses directional pleiotropy through regression intercept observation. Weighted-median method yields consistent causal effect estimates if at least 50% weight is from valid IVs. Both model-based estimations (weighted and simple) were employed for result confirmation alongside IVW. Though MR-Egger is less statistically powerful and relies on the Instrument Strength Independent of Direct Effect assumption. By combining these complementary methods, we aimed to provide more robust and reliable causal inference.Next, sensitivity analysis was conducted using the MR leave-one-out approach [30, 32]. Leave-one-out sensitivity tests confirm MR regression robustness for BMI (Fig. S1), coffee intake (Fig. S2), type 2 diabetes (Fig. S3), hip circumference, current tobacco smoking (Fig. S4), education duration (Fig. S5), and LDL cholesterol (Fig. S6). Only a small subset of SNPs linked to coffee intake and hip circumference in the MR analysis exhibited sensitivity bias. In our additional analyses, we assessed heterogeneity using Cochran’s Q test [33]. No significant heterogeneity was observed. Pleiotropy was examined using the intercept value from MR-Egger regression. While all intercepts were small, the coffee intake GWAS data displayed notable pleiotropy. To explore the possibility of gene pleiotropy, we utilized PhenoScanner (http://www.phenoscanner.medschl.cam.ac.uk) to examine the links between specific genes and various other diseases.
The statistical analyses were conducted using R software (version 4.1.0). The following packages were used for the Mendelian Randomization analysis: TwoSampleMR for conducting MR analysis, including inverse variance weighting (IVW), MR-Egger, weighted median, weighted mode, and simple mode methods; MendelianRandomization for additional sensitivity analyses and pleiotropy assessment; dplyr for data manipulation and cleaning; and ggplot2 for data visualization and plotting. The EC GWAS data was obtained from the UK Biobank through IEU. The database contains comprehensive genetic and health data from over 500,000 participants. After applying inclusion and exclusion criteria, the final analysis included 740 cases and 372,016 controls. Reasons for exclusion included “criteria for defining outcome variables,” among others. Figure 1 illustrates the flow diagram of the participant selection process.
Comments (0)