2.1 Data download and processing
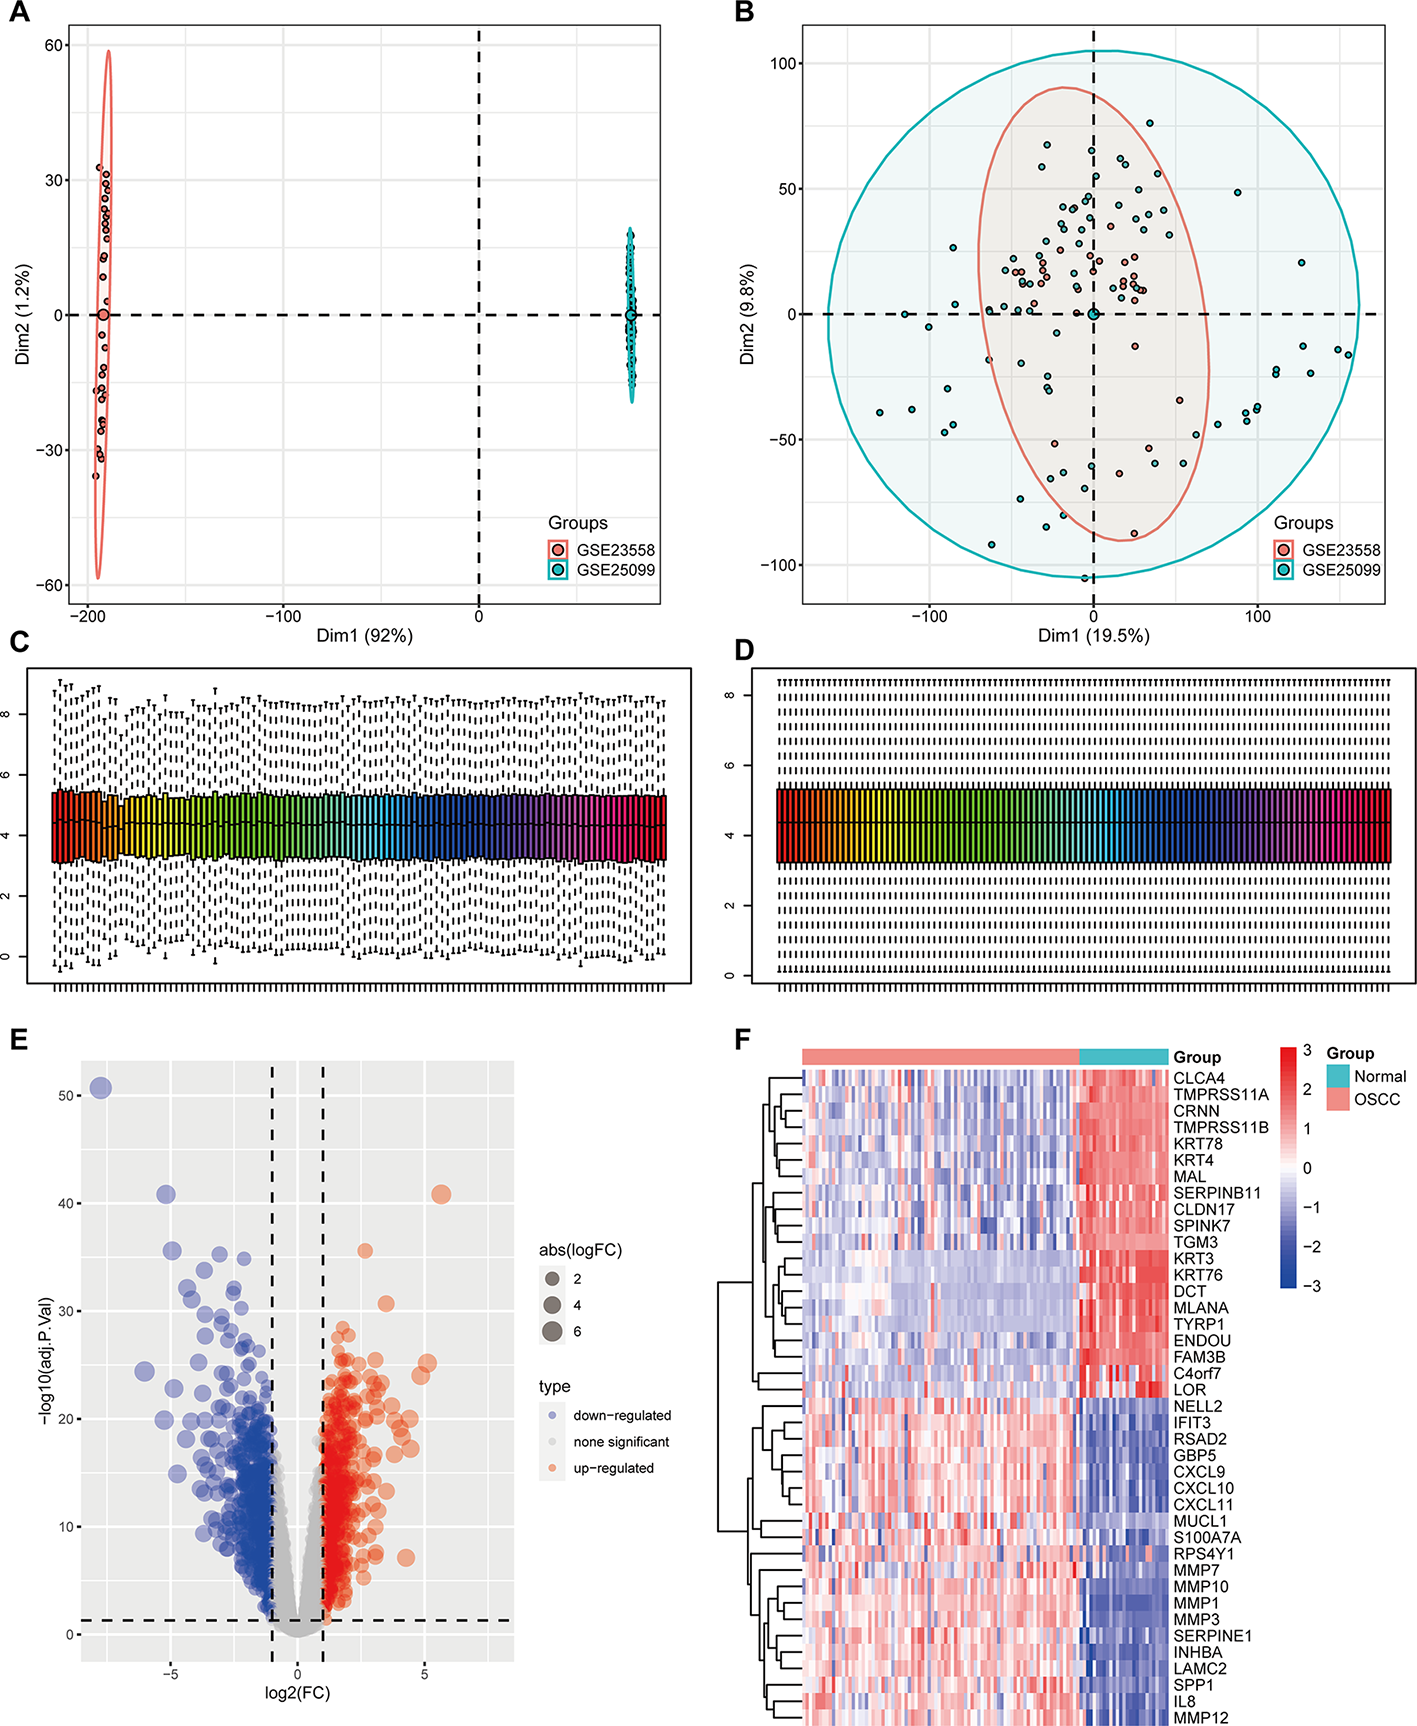
The public available OSCC expression profiles (GSE23558 [9] and GSE25099 [10]) were retrieved from NCBI-GEO database. GSE23558 included RNA profiles derived from 27 OSCC patients and 5 healthy donors. GSE25099 contained 57 OSCC tumor tissues and 22 normal oral tissues. The data sets were pooled and the batch effect was removed by “limma” and “sva” package in R. The pooled data were analyzed by PCA and normalized by preprocessCore package. Differential expression of genes were analyzed by limma package in R 4.2.2 with the cutoff value of |logFC(fold change) |> 1, adj.P.Val < 0.05. The differentially expressed genes (DEGs) were visualized by Volcano Plot and heatmap.
2.2 Function enrichment analysis
To dissect the function and pathways that altered by DEGs, GO (Gene ontology) and KEGG (Kyoto Encyclopedia of Genes and Genomes pathway) pathway analyses were performed. GO project allows gene annotation in three categories of Biological Process (BP), Cellular Component (CC) and Molecular Function (MF). KEGG database provides KEGG pathways for gene mapping [11]. Clusterprofiler is an universal enrichment tool for functional study [12]. DEGs were subjected to GO annotation and pathway analyses using “clusterprofiler” package in R 4.2.2. The significance was defined as p < 0.05.
2.3 O-GlcNAcylation related DEGs analysis
The O-GlcNAcylation related gene sets were retrieved from MsigDB database with GO term of GOBP_PROTEIN_O_LINKED_GLYCOSYLATION (http://www.gsea-msigdb.org/gsea/msigdb/human/geneset/GOBP_PROTEIN_O_LINKED_GLYCOSYLATION) and pathway term of REACTOME_O_LINKED_GLYCOSYLATION (http://www.gsea-msigdb.org/gsea/msigdb/human/geneset/REACTOME_O_LIN.
KED_GLYCOSYLATION). The overlaps between O-GlcNAcylation related genes and DEGs were mined, followed by GO and KEGG pathway enrichment analyses.
2.4 Protein-protein interaction analysis
The protein pairs of overlapped DEGs were retrieved from STRING database (https://string-db.org/). Protein pairs with interaction score ≥ 0.4 were collected. Then, PPI network was built by employing Cytoscape software [13].
2.5 Machine learning models
The key DEGs were filtered by machine learning methods. LASSO (least absolute shrinkage and selection operator) model was constructed to achieve feature selection and reduce number of genes [14]. We used glmnet package [15] to conduct LASSO. Random forest (RF) algorithm as one of the classification methods was run by randomForest in R. Support vector machine (SVM) as another classification algorithm was implemented by using kernlab package in R. The intersection genes of screened genes by the three machine learning models were considered as the key genes. The predictive value of key genes in OSCC was determined by ROC curve with the application of pROC package in R.
2.6 Gene set enrichment analysis (GSEA)
GSEA is a statistical methodology, which is widely used for interpreting a given gene set [16]. Genes with close correlation may share the same biological function. To dissect the potential function of key genes, we utilized Pearson correlation analysis to achieve the list of genes that associated with the key genes. GSEA was performed to explore the reactome pathways that positively or negatively enriched by associated gene sets. ClusterProfiler package in R was applied for GSEA analysis.
2.7 Cell validation and transfection
The normal human oral squamous cells (WSU-HN30) and three OSCC cell lines (CAL27, SSC-25 and HSC-3) were obtained from Chinese cell resource Bank. Cells were routinely incubated with DMEM supplemented with 10% FBS and/or 1% penicillin/streptomycin. The mRNA and protein expressions of GALNT6 were evaluated by RT-qPCR and western blot, respectively. siRNAs targeting GALNT6 (si-GALNT6-#1, si-GALNT6-#2 and si-GALNT6-#3) and their negative control (si-NC) were purchased from GenePhmarma (Shanghai, China). The siRNA sequences were depicted in Table 1. siRNA cell transfection was achieved with the use of Lipo2000. The efficacy of siRNAs delivery was determined with the implementation of RT-qPCR analysis and western blot.
Table 1 Sequences of SiRNA targeting GALNT62.8 Cell counting Kit-8 (CCK8) assay
After siRNA transfection, the changes of cell proliferation were assessed by CCK8 assay kit. As per the manufactory protocols, cell suspension (100 µL) were added in 96-well plate and cultured for indicative time at 37℃ under 5% CO2. Then, Two-hour CCK8 incubation (10µL/each well) was performed. Finally, the changes of cell proliferation were monitored by optical density (OD) detection at 450 nm.
2.9 Colony formation assay
After transfection, single cells were prepared by digesting with 0.25% trypsin, and suspended in DMEM with 10% FBS. Subsequently, single cells were seeded in 6-well plate and maintained for 3 weeks. The cell colonies were fixed with 4% paraformaldehyde, followed by staining with GIMSA.
2.10 Cell scratch and transwell assay
After transfection, cells at logarithmic phase were plated in 6-well plate (6 × 10⁴/well) and maintained at 37℃ under 5% CO2 overnight. When cells grew to 100% confluence, monolayer cells were scratched by 100 µL pipette tips and cultured for 24 h. The scratched areas at 0 h and 24 h were assessed by ImageJ software. The migration area of the scratch site was calculated by Image J software, and the scratch healing rate was calculated. Scratch healing rate = ( initial scratch area-scratch area after migration ) / initial scratch area × 100%. For transwell invasion assay, the digested cells were suspended in serum-free medium and seeded in Matrigel-coated upper chambers of 24-well transwell plate. The lower chambers were filled with medium supplemented with FBS. After incubated for 24 h, cells in the upper surface of members were wiped off and the cells inserted on the lower surface of members were stained with crystal violet and counted.
2.11 Flow cytometry
Cells were placed in 6 well-plate and maintained for 48 h. Then, cells were collected by centrifugation at 200 rpm for 5 min. Cells were washed by PBS twice and the cell pellet was suspended with Annexin V-FITC binding buffer. Then, cells actively undergoing apoptosis were double-labeled with Annexin V-FITC (5 µL) and PI (10 µL) in the dark for 15 min. The percentage of apoptosis cells was determined by flow cytometer.
2.12 Western blot
After treatment, proteins of cell cultures were prepared with the application of RIPA solution. The concentration and quality of protein samples were confirmed by BCA assay. The eligible protein sample was solved by SDS-PAGE system and transferred onto PVDF membranes. Then, immunoreaction was done with the primary antibody against GALNT6 (PA5-52852, rabbit polyclonal antibody, 1:900, Invitrogen), GAPDH (PA1-988, rabbit polyclonal antibody, 1:1000, Invitrogen) at 4℃ overnight, followed by incubating with goat anti-rabbit IgG secondary antibody (31460, 1:1000, Invitrogen) for 2 h at room temperature. Finally, chemiluminescence was produced and detected.
2.13 Real time PCR assay (RT-qPCR)
Cell lysate was prepared by TRIzol regent (Invitrogen). After total RNA was extracted from cells, the reverse transcription was conducted with cDNA synthesis kit (Bio-rad, CA, USA). cDNA (2 µL) was used for real time PCR under BIO-RAD quantitative PCR system. Gene amplification was performed following the conditions of 93°C for 2 min, followed by 40 cycles of 93°C for 10 s, 55°C for 20 s, and 72°C for 20 s. The primers used in PCR assay were: GALNT6, F 5’-AATGCCTGGATGTGGGTGAG-3’, R 5’-CTGGGCCAATTCCCATTCCT-3’; β-actin, F 5’-GCGAGAAGATGACCCAGATC-3’, R 5’-CCAGTGGTACGGCCAGAGG-3’. The mRNA expression of GALNT6 was evaluated relative to β-actin and quantitatively analyzed based on 2^-∆∆Ct method.
2.14 Immunohistochemistry (IHC)
Total 10 pairs of OSCC tumor tissues and adjacent epithelial dysplasia tissues were collected with informed consent. Approval of this study was obtained from the Ethics Committee of our institution and the tissue related study protocols were confirmed to the Declaration of Helsinki. For IHC staining, tissue sections (3 μm) were dewaxed, rehydrated, and sealed with 10% BSA. Immunoreactivity was conducted with the primary antibody to GALNT6 (ab151329, 1:900, abcam) and the horseradish peroxidase-conjugated IgG antibody (ab6721, 1:1000, abcam). Signals were visualized with DAB staining and hematoxylin counterstaining. The expression of GALNT6 was quantitatively analyzed with the implement of Image-Pro Plus 6.0 software based on the average optical density (AOD) values.
2.15 Statistics
SPSS software was applied for statistical analysis. All experiments were repeated three biological times. Two group comparison was performed by t test and multi-group comparison was achieved by one-way ANOVA. Differences with p < 0.05 were considered significant.


Comments (0)