
Remember me
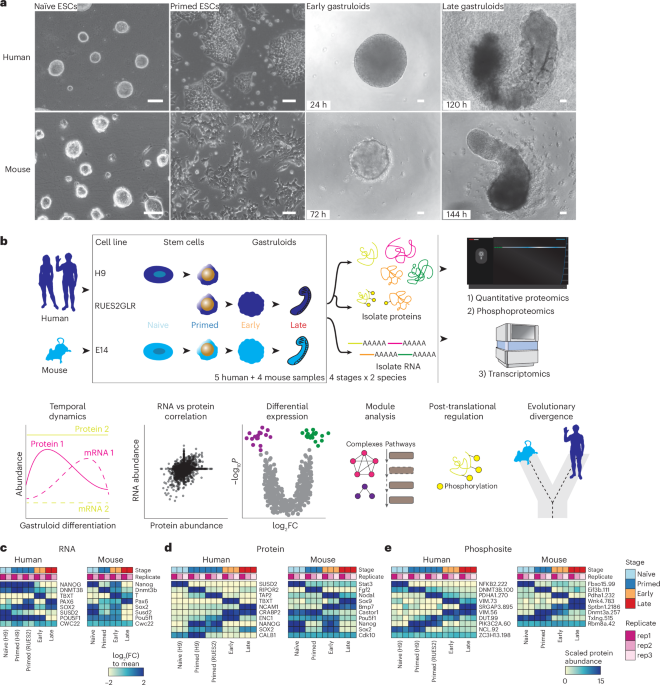
We profiled the dynamics of RNAs, proteins and phosphosites in human RA-gastruloids10 and conventional mouse gastruloids9 corresponding to four stages of gastruloid differentiation: pre-implantation ‘naïve’ ESCs, post-implantation ‘primed’ ESCs, post-symmetry-breaking ‘early’ gastruloids and anterior–posterior elongation/patterning ‘late’ gastruloids (Fig. 1a and Extended Data Fig. 1a). We analysed two human ESC lines (H9 and RUES2-GLR) to assess inter-cell-line variation28,29 (Fig. 1b). All data were analysed in biological duplicate (transcriptomics) or triplicate (proteomics, phosphoproteomics) (Extended Data Fig. 1b–e). Replicates for each data type were also tightly grouped by principal components analysis (PCA). In human gastruloids, generally, PC1 separated naïve H9 ESCs from other samples, and PC2 broadly correlated with developmental progression. In mouse, PC1 generally separated late gastruloids from other samples, and PC2 once again resolved developmental progression (Extended Data Fig. 1f).
Fig. 1: Quantifying the dynamic proteome from ESCs to gastruloids. The alternative text for this image may have been generated using AI.
a, Representative brightfield images of human RA-gastruloids and mouse gastruloids imaged over the course of their development. Scale bars, 10 μm. The experiments were independently reproduced five times with similar results. b, Multi-omics profiling workflow. We sampled two human cell lines (H9 and RUES2-GLR) and one mouse cell line (E14) at the indicated stages. c–e, Representative heatmaps depicting the temporal dynamics of RNAs (c), proteins (d) or phosphosites (e) for selected developmental marker transcripts, proteins or PTMs, respectively, across replicates and stages for both human and mouse. The colour scale for RNAs indicates log2(fold change) relative to the row mean. The colour scale for protein and phosphorylation data indicates scaled TMTpro reporter ion abundance. FC, fold change.
We quantified 7,352 human and 8,699 mouse proteins (Extended Data Fig. 1b and Supplementary Table 1), and measured proteins from all 34 annotated subcellular locations30 (Extended Data Fig. 1g). The pluripotent markers NANOG and POU5F1 were highly abundant in ESCs, while mesendoderm marker TBXT31 and neural tube marker PAX632 were abundant in early- and late-stage gastruloids, respectively (Fig. 1c). Stage specificity was observed for proteins such as naïve epiblast marker SUSD233 in naïve H9 cells, while TBXT and NCAM were specific to early- and late-stage gastruloids, respectively (Fig. 1d). Interestingly, retinoic-acid binding protein CRAPBP234 was detected only in human samples after the addition of retinoic acid35. For mouse Sox2/Sox2, we observed consistent dynamics for messenger RNA (mRNA) and protein abundance (Fig. 1c,d). Protein levels for the pluripotency marker SOX2 dropped in early gastruloids before increasing in late gastruloids. SOX2 endogenously tagged with mCitrine confirmed that this pattern was driven by neural-cell populations (neural progenitors, neural crest and neural tube; Fig. 1c,d and Extended Data Fig. 1h). By quantitative phosphoproteomics17,36, we also mapped the temporal dynamics of human and mouse phosphosignalling (Fig. 1e). Phosphorylation of the methyltransferases DNMT3B (Ser100, human) and Dnmt3a (Thr257, mouse) decreased during gastruloid development, potentially related to previous reports of DNA hypomethylation in ground-state pluripotency and increased methylase activity during differentiation26,37,38,39,40,41. Compared to recent mouse gastruloid datasets42, our work quantified 3,290 additional mouse proteins (65% more) and 2,303 additional homologous human proteins (46% more) (Extended Data Fig. 2a,b). Strong overlap with gastruloid and embryonic proteome datasets42,43,44 support the interpretation that we had sampled biologically relevant temporal protein changes (Extended Data Fig. 2c,d). The increased depth of the proteome sampled over the course of gastruloid differentiation also enabled temporal co-regulatory analysis at the level of proteins, complexes and phosphosignalling.
Time-resolved proteomics reveals coherent shifts across gastruloid developmentTo identify proteins with similar temporal dynamics, we merged the human and mouse proteomic datasets by orthology and subjected them to hierarchical clustering (Fig. 2a). Focusing on ten protein sets with similar dynamics across both species (‘clusters’), Gene Ontology (GO) analyses45 identified significantly enriched cell division and DNA repair (cluster 1), mitochondria and aerobic respiration (cluster 2), RNA biogenesis (cluster 3), cilia and pattern specification (cluster 4), small-molecule metabolism (cluster 6), extracellular matrix (ECM) organization (cluster 7) and tube development (cluster 8) (Fig. 2b and Supplementary Table 2). These enrichments suggest that the proteins that underlie these biological processes are coordinated during gastrulation.
Fig. 2: Time-resolved proteomics reveals biologically coherent shifts across gastruloid development. The alternative text for this image may have been generated using AI.
a, Heatmap depicting the temporal dynamics of protein expression across human and mouse gastruloid differentiation samples and replicates. Labels on the right of the heatmap indicate cluster number. b, Dotplot showing the top GO-terms enrichment across clusters. Clusters 5, 9 and 10 did not have significantly enriched GO terms. Significance was determined using a one-sided hypergeometric test. The colour scale indicates the Benjamini–Hochberg (BH)-adjusted P values (correcting for multiple hypothesis testing). Size of dots corresponds to the number of proteins associated with a particular GO term. c, Volcano plots of the protein expression changes across consecutive stages of human gastruloid differentiation, where the x axes represent the log2(fold change) between two adjacent timepoints and the y axes represents the negative log10 of the BH-adjusted P value (correcting for multiple hypothesis testing). Numbers indicate the counts of differentially abundant proteins in each condition. Significance was calculated using the standard t-test. d, The log2(protein abundance ratio) of early (yellow) or late (red) gastruloids compared to primed human ESCs (RUES2-GLR) for proteins associated with pluripotency and central metabolism including the TCA cycle, the pentose phosphate pathway and oxidative phosphorylation. Mean abundance ratios (from three biological replicates) are indicated with dots, and error bars represent s.d.
Across adjacent timepoints in each species we identified thousands of differentially abundant proteins (DAPs; Extended Data Fig. 3a,b). Owing to cell-line differences, we refrained from directly comparing naïve H9 cells to the other stages. However, naïve H9 cells tended to exhibit a high number of both DAPs (3,499 DAPs comparing naïve and primed states of pluripotency) and differentially expressed transcripts (DETs; Extended Data Fig. 3a). SUSD2, whose expression marks pre-implantation epiblasts in human blastocysts, was detected only in naïve ESCs, and SOX2 and NANOG were enriched in primed ESCs (Fig. 3c). When compared to primed ESCs, DAPs in naïve ESCs were enriched for proteins involved in ECM organization, and primed cells were enriched for proteins involved in nucleotide metabolism. Comparing primed RUES2-GLR ESCs to early human RA-gastruloids, we identified 3,207 DAPs, including SOX2 enrichment in primed ESCs, and TBXT and CDX2 enrichment in early human RA-gastruloids. DAPs upregulated in early gastruloids mapped to actin filament organization and cytoskeletal processes, and DAPs downregulated mapped to mitochondrial processes (Extended Data Fig. 3d). Comparing early versus late human RA-gastruloids, we identified 767 DAPs, including downregulation of TBXT, caudal axial progenitors marker WNT8A and presomitic mesoderm marker TBX6, and upregulation of advanced cell-type markers including PAX3 (dorsal somites and neural tube), SOX1 and SOX2 (neural tube) and cardiomyocytes (MEIS1) (Fig. 2c).
Fig. 3: Co-regulation analysis maps cooperative protein associations to known protein complexes and pathways. The alternative text for this image may have been generated using AI.
a, Scatterplots comparing abundances across selected protein pairs across samples. b, Distribution of rPearson based on observed (top) and permuted (bottom) data. The observed distribution was obtained by calculating rPearson across all possible protein–protein pairs. Permuted distributions were generated by randomly sampling 50,000 protein pairs after randomly shuffling their respective timepoints ten times each before calculating rPearson. Colours indicate strongly correlated (≥0.95; blue) or anticorrelated (≤−0.95; red) edges. c, Distribution of protein edge counts across the trimmed correlation network. On average, each protein in the network participated in 174 edges ± 195 edges. d, Ratio of enrichment for the annotated edges in the correlation network (‘observed network’) compared to the expected edge annotation frequencies across Gene Ontology biological process (GOBP), cellular component (GOCC), molecular function (GOMF), localization, pathways, protein–protein interactions (PPIs, BioPlex) or protein complexes. Specifically, we calculated the enrichment for annotated edges as the fraction of annotated edges per category in the observed correlation network divided by the fraction of annotated edges among all possible edges involving the 5,227 proteins in the correlation network. The expected frequency of annotated edges was calculated by generating all possible pairs from 5,227 human proteins (UniProt, July 2024) and computing the number of pairs explained by each functional category. e, Network analysis identifies known associations between proteins for BMP1 and RPL7A. f,g, Network structure of the 26S proteasome (f) and citric acid cycle pathway (g). Magenta nodes indicate known complex members annotated either from CORUM or EMBL ComplexPortal for protein complexes, or from BioCarta, KEGG, the Protein Interaction Database (PID), Reactome and WikiPathways (WP) for biochemical pathways. Blue edges indicate positive correlations between nodes, and red edges indicate anticorrelations. h,i, Cooperative proteins are highly correlated with members of established protein complexes, including the NuA4 chromatin remodelling complex (h) and the Chaperonin-containing T (TRiC/CCT) complex (i). Magenta nodes indicate subunits of a given complex, and orange nodes indicate cooperative proteins, that is, proteins with profiles correlated to proteins constituting a particular protein complex. Cooperative node sizes indicate the negative log10 of the BH-adjusted P value after computing significance from a one-sided Fisher’s exact test to determine the cooperative association of a protein to a particular module. Blue edges indicate correlated edges, and orange edges link cooperative proteins to members of a particular module. j, Bioplex interaction network of the TRiC/CCT complex. Orange nodes are cooperative proteins with profiles correlated to proteins found in the TRiC/CCT complex. Grey edges indicate BioPlex evidence. k, Histogram of protein complexes (x axis) and their respective numbers of cooperative proteins (y axis). l, Heuristic to identify shared cooperative proteins between complexes. m, Heatmap depicting a subset of shared cooperative proteins across manually curated EMBL ComplexPortal protein complexes, namely exosomes, SWI/SNFs, ATAC remodellers, nucleosome remodellers (NuRDs) and histone acetyltransferase (HAT) and deacetylase (HDAC) complexes. The heatmap is coloured by Jaccard similarity coefficients calculated from overlapping sets of cooperative proteins between protein complex pairs, and clustered using Euclidean distances with average linkage.
To identify the cell types driving bulk proteomic observations, we compared our dataset with existing gastruloid scRNA-seq datasets10. We focused on seven proteins with characteristic upregulation in early gastruloids (TBXT, WNT8A, TBX6, APLNR), late gastruloids (SOX2, PAX3) or both (NEBL) (Extended Data Fig. 5a). In early gastruloids, TBXT was predominantly expressed in neuromesodermal progenitors (NMP) and axial mesoderm, and WNT8A and TBX6 were enriched in NMP, nascent mesoderm and primitive streak populations. APLNR (mesoderm development46) was broadly expressed across mesodermal lineages, suggesting that both nascent and emergent mesoderm populations contribute to its bulk protein profile. In late gastruloids, SOX2 was specifically expressed in neural progenitors and neural tube cells. PAX3 expression was primarily driven by neural and somite populations. Interestingly, NEBL protein levels in late gastruloids tended to reflect expression in cardiac cell populations, whereas in early gastruloids it lacked clear cell-type specificity (Extended Data Fig. 5b,c). SOX2 and ZIC2 were highly correlated at the protein level, and their scRNA-seq profiles suggested both were expressed in neural cell types. Upon immunostaining, ZIC2 was in nuclear bodies as previously reported30, and colocalized with SOX2 to neural cell types. These observations suggest that our data capture at least some cell-type-specific expression patterns for major lineages.
Comparing H9 versus RUES2-GLR human primed ESCs, we detected 3,047 DAPs (Extended Data Fig. 3b). Although both cell lines expressed characteristic primed ESC markers (for example, SOX2 and NANOG), the DAPs largely mapped to mitochondrial processes (respiration, oxidative phosphorylation), which are upregulated in primed RUES2-GLR relative to primed H9 ESCs. Conversely, DAPs upregulated in primed H9 ESCs were enriched for cytoskeletal processes and translation (Extended Data Fig. 3c). This comparison reinforces that substantial differences exist between widely used human ESCs47.
The proteomes of primed RUES2-GLR ESCs were highly enriched for mitochondrial processes relative to RUES2-GLR early gastruloids (Extended Data Fig. 3c,d), suggesting that these processes are downregulated over the course of gastruloid differentiation. To determine whether this downregulation was specific to a subset of mitochondrially mediated metabolic pathways, we compared primed human ESCs with early and late gastruloids (all RUES2-GLR-derived) broken down by pathway. Intriguingly, we observed highly consistent levels of downregulation of mitochondrial proteins involved in the tricarboxylic acid (TCA) cycle and oxidative phosphorylation, and upregulation of proteins involved in the pentose phosphate pathway. Within oxidative phosphorylation, this consistency extended to individual protein complexes (Fig. 2d). Thus, the levels of mitochondrial machinery appear highly coordinated during gastruloid differentiation, consistent with studies of metabolic complexes during mammalian ageing17. Downregulation of mitochondrial activity was also observed in H9 early gastruloids, despite lower OxPhos protein levels in H9 primed ESCs (Extended Data Fig. 3e,f).
Across mouse gastruloid development, we observed similar numbers of DAPs (Extended Data Fig. 3g) with expected stage-specific patterns; for example, pluripotency markers Sox2 and Nanog were enriched in naïve mESCs compared to primed mESCs. Similarly, mesenchymal cell marker Bmp7 was enriched in early mouse gastruloids compared to primed mESCs, and endoderm marker Sox17 was enriched in late gastruloids compared to their early counterparts. To analyse conserved protein expression dynamics, we compared fold changes across stage transitions for orthologous human and mouse proteins. We observed modest positive correlation in the naïve to primed (rPearson = 0.17) and early to late (rPearson = 0.5) transitions, but strong anticorrelation in the primed to early transition (rPearson = −0.8). This anticorrelation was driven by the aforereferenced elevated levels of mitochondrial proteins in primed RUES2-GLR ESCs, whose metabolic state better matches early mouse gastruloids than primed mESCs (Extended Data Fig. 3h).
Despite species-specific protocol differences (for example, the tenfold lower number of starting cells for mouse gastruloids), the downregulation of oxidative phosphorylation primed ESCs to early human gastruloids is mirrored in early to late mouse gastruloids (Extended Data Fig. 4a,b). Furthermore, these trends in early versus late mouse gastruloids reproduce (providing independent confirmation), extend (by showing homologous patterns in human gastruloids) and add resolution to (by profiling more proteins) similar observations by Stelloo and colleagues42 in mouse gastruloids (Extended Data Fig. 4c–e).
Co-regulation analysis maps cooperative protein associations to protein complexes and pathwaysGiven that proteins belonging to shared modules (for example, oxidative phosphorylation) were coherently regulated across gastruloid development (Fig. 2d), we explored co-regulation among members of specific pathways or complexes. Co-regulation analysis, that is, calculating pairwise correlations of protein abundances across samples, can elucidate coordinated protein functions such as macromolecular complexes and biochemical pathways48,49,50,51,52. Correlated and anticorrelated edges within the resulting networks can reveal effects including direct protein interactions53, signalling cascades54,55 and cell-state-specific roles56. Proteome-based coexpression has been shown to outperform transcriptome-based coexpression for predicting gene function57. Consistent with this, pairwise correlations of glycolysis and TCA-cycle genes in our data revealed coherent intra-pathway correlations and inter-pathway anticorrelations at the protein level that were not recapitulated at the RNA level (Extended Data Fig. 6a).
We calculated correlations (rPearson) between all 19.6 million possible pairs of the 6,261 proteins that were successfully quantified in 18 primed ESC or gastruloid samples. Proteins within known complexes were generally highly correlated, for example, TUBG1 and TUBGCP2, which constitute the γ-tubulin ring complex58, while TUBG1 was anticorrelated with the ATPase ATP1A1. Across all pairs, we observed a bimodal distribution of rPearson, but a similar analysis was not seen in permuted control samples (Fig. 3a,b).
We focused on pairs that were either strongly correlated (rPearson ≥ 0.95) or anticorrelated (rPearson ≤ −0.95) at a false discovery rate (FDR) of 1% (Fig. 3c). The resulting network consisted of 5,681 nodes (proteins) and 489,417 significant correlations or edges, of which 62% were positively and 38% negatively correlated (Fig. 3c, Extended Data Fig. 6b,c and Supplementary Table 3). We trimmed our network to 5,227 proteins by retaining only the canonical isoforms detected in our datasets, and validated positively correlated edges by mapping the resulting network onto the databases cataloguing known gene ontologies45, subcellular localizations30, biochemical pathways59,60,61,62,63, protein–protein interactions64 and protein complexes65,66. The proportion of annotated edges that were positively correlated edges varied by database, for example, 73–92% for proteins with shared GO annotations, subcellular localization or pathway databases, but 93% for proteins previously reported to interact, and 97% for proteins belonging to the same complex (Extended Data Fig. 6d and Supplementary Table 4).
In the trimmed network, 37.8% of positively correlated edges were explained by at least one established annotation, a 1.4-fold enrichment over the 26.7% of all possible edges involving these 5,227 proteins that are annotated in these databases (Extended Data Fig. 6e,f). This was consistent with previous studies that attributed 34–42% of protein correlation network edges to previous annotations. Notably, those studies also required 41–375 different cell lines to generate co-regulation networks53,56. Moreover, our network’s edges were only modestly enriched for shared subcellular localization (1.5-fold), but were strongly enriched for annotated protein–protein interactions (4.5-fold) and shared membership in a protein complex (7.4-fold) (Fig. 3d).
We leveraged the untrimmed network to positively map protein pairs to specific developmental genes or protein complexes (Extended Data Fig. 6f,g). Anecdotally, many known protein–protein interactions were recovered. For example, BMP1, a metalloprotease involved in ECM formation and procollagen processing67, was highly correlated with collagens COL1A1 and COL1A2, whereas RPL7A, a large ribosomal subunit member, was highly correlated with other large ribosomal subunit members and transfer RNA synthetases (AARS1, TARS1, YARS1) involved in translation (Fig. 3e).
To investigate whether the correlation network recovered known protein complexes, we focused on 1,357 complexes from CORUM65 or ComplexPortal66 with 3+ subunits represented in our correlation network. An average of 80% of complex members were represented among the 5,681 proteins in the network (Extended Data Fig. 6h). Within the 26S proteasome, 29 of 33 (88%) proteins were represented, with 87% of all possible edges detected, and 100% of edges were positively correlated (Fig. 3h). Similar trends were observed for core metabolic modules, including in the citric acid cycle, for which 90% of edges connecting pathway members were positively correlated (Fig. 3g).
Beyond recovering known protein–protein relationships (37.8% of filtered network, Fig. 3e), we nominated potential developmentally associated relationships. Many of these are potentially driven by cell states unique to gastruloid development relative to common workhorse cell lines53,56. Drawing from previous proteomics studies50,64, we defined a protein cooperativity metric to enrich the first-degree neighbours of complexes and pathways, termed ‘cooperative edges’, connecting cooperative proteins (Methods). We reasoned that if members of a complex were withheld from our analysis, our cooperative edge mapping framework should recover their association to the remaining protein complex network. For example, when ribosomal proteins were divided into 60S and 40S subunits, three large ribosomal subunit members (RPL5, RPL13A, RPL32) were among the top five cooperative hits for the 40S subunit (Extended Data Fig. 6i).
We identified 1,385 cooperative proteins associating with 218 ComplexPortal complexes66 and 1,944 cooperative proteins associating with 524 CORUM complexes65 (Supplementary Table 5). The number of cooperative proteins per complex was not correlated with the number of complex subunits (Fig. 3h–k and Extended Data Fig. 6j) or the number of complexes with which a given protein was cooperatively associated (Extended Data Fig. 6k). When comparing cooperative protein–complex relationships with protein–protein interaction databases64, 1,610 cooperative edges (involving 18.5% of cooperative proteins) were annotated as interactors (Extended Data Fig. 6l). For example, in the Chaperonin-containing T (CCT) complex, five(13%) of the 36 most significantly cooperative proteins were BioPlex interactors, and nine (25%) were BioGrid interactors (Fig. 3i,j).
We reasoned that complexes with shared cooperative proteins might inform these proteins’ functional roles. Jaccard similarity coefficients between pairs of complexes (Fig. 3i) revealed network structures among overlapping cooperative protein sets (Fig. 3m). For example, exosome and histone acetyltransferase complexes each had discrete sets of cooperative proteins that overlapped with one another but not with other complexes. The 40S and 60S ribosomal subunits shared extensive cooperative protein overlap with each other and also with the 26S proteasome and the Chaperonin-containing TCP-1 complex. Additionally, SWItch/Sucrose Non-Fermentable (SWI/SNF) complexes shared cooperative proteins among themselves, with a subset also overlapping with tethering complexes, the ATAC coactivator68, and histone methyltransferase complexes (Fig. 3m and Supplementary Table 6).
Gastruloid stages and gene modules exhibit varying degrees of RNA–protein discordancePrevious studies across biological contexts have reported varying extents of concordance between mRNA and protein levels15,16,18,53,
Comments (0)