
Remember me
Given the nutrient-poor conditions and desmoplasia frequently observed in PDAC, we wanted to assess how nutrient starvation influences patient-derived pancreatic CAFs (Extended Data Fig. 1a, b). Serum and lipid starvation of CAFs significantly enhanced ECM production (Fig. 1a and Extended Data Fig. 1c, d), similar to what has been observed under hypoxic conditions14. Because CAFs are linked to tumour growth and treatment resistance8, we assessed whether the CAF-conditioned medium (CAF-CM) collected from starved fibroblasts could induce treatment resistance. Indeed, CAF-CM increased cancer cell proliferation (Extended Data Fig. 1e, f) and conferred resistance to multiple PDAC chemotherapies, including GEM, SN-38, 5-FU and oxaliplatin (Extended Data Fig. 1g–j).
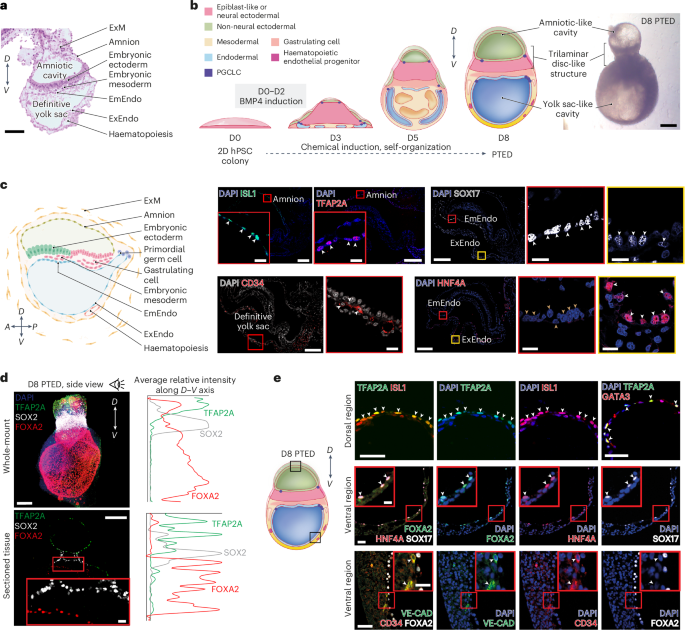
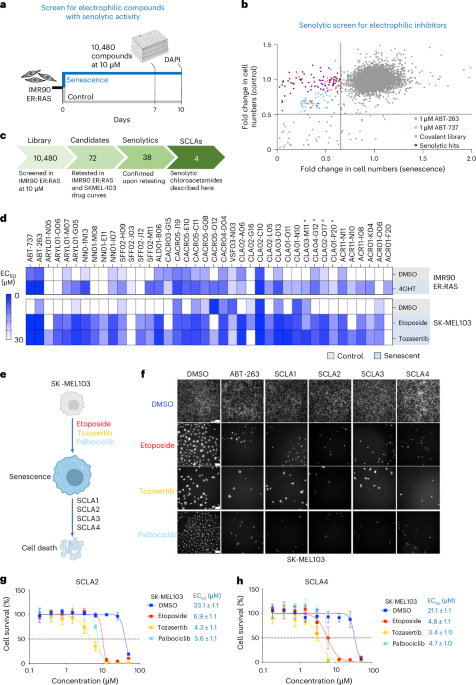
Fig. 1: Conditioned medium from starved CAFs increases tolerance to DNA-damaging agents in pancreatic cancer cells. The alternative text for this image may have been generated using AI.
a, Pancreatic CAFs were grown in DMEM containing 10% FBS or 0% FBS and the media and cells were collected at indicated times. CAF medium was TCA precipitated and immunoblotted for collagen 1, fibronectin and pan-laminin. Whole-cell lysates (WCLs) of the CAFs were probed for vinculin. TCA loading was normalized to the WCL protein amount. The data represents n = 3 biological replicates. b,c, yH2AX foci were used to assess DNA damage. SW1990 were treated with 1 µM GEM, 0.5 µM SN-38, 100 µM 5-FU or 50 µM oxaliplatin for 24 h in NC or CAF-CM. Cells were fixed and immunostained for yH2AX (white) and 4,6-diamidino-2-phenylindole (DAPI) (blue) followed by image acquisition. Images were quantified by CellProfiler; data in c are shown as foci counts per single nucleus, >100 nuclei were counted per condition, n = 3 biological replicates, P values from nested mixed-effects analysis with Holm-corrected pairwise comparisons of replicates are shown. Representative images in b display yH2AX foci formation upon SN-38 treatment. Scale bar, 10 µm. d, SW1990 were analysed for DNA damage by the alkaline Comet assay. Cells were treated with indicated chemotherapies as in b,c for 24 h in NC or CAF-CM, plated on Comet assay slides, DNA was run under alkaline conditions and stained with SyBR-gold. Non-damaged DNA appears as a dense dot, while the loops of the damaged DNA lose their supercoiling and form comet tails, a representative image is shown for GEM (scale bar top, 10 µm, bottom, 100 µm). Images were quantified using CometScore software. OTM, reflecting the intensity of the comet tail relative to the head, was used as a metric for the level of DNA damage. Higher OTM signifies higher levels of DNA damage. Nested mixed-effects analysis with Holm-corrected pairwise comparisons of biological replicates were applied. >200 cells were analysed per condition, n = 3 biological replicates. e–g, Proteins were filtered from CAF-CM using 3 kDa cutoff spin filters. SW1990 cells were treated with 1 µM GEM in the presence of NC, CAF-CM or with filtered CAF-CM (<3 kDa proteins or >3 kDa proteins as indicated). yH2AX (f) or Comet assay (g) was used to analyse DNA damage, DNA damage foci or OTM values were plotted and significance was analysed using nested mixed-effects model with Holm-corrected pairwise comparisons, n = 3 biological replicates. >100 cells were analysed per condition. h, SW1990 cells were plated on coverslips, serum-starved overnight and indicated ECM proteins (Col, collagen 1; FN, fibronectin; Lam, laminin-5), RGD peptides, NC or CAF-CM were added to the cells along with 0.5 µM GEM for 24 h. Cells were fixed and stained for yH2AX and DAPI, and the images were quantified for yH2AX foci/nucleus by CellProfiler, n = 3 biological replicates, analysis was carried out using a nested mixed-effects model with Holm-corrected pairwise comparisons, >150 cells were analysed per condition. Panels a,b,e,h created in BioRender; Muranen, T. https://app.biorender.com/illustrations/699cf91dab1263740cac8434 (2026).
As these agents work by inflicting DNA damage, we examined whether CAF-CM from different lines reduces chemotherapy-induced DNA damage. We analysed DNA damage by yH2AX staining of cells treated with CAF-CM versus non-conditioned medium (NC) in the presence of chemotherapies. yH2AX staining revealed significantly less DNA damage in cells treated with CAF-CM compared with NC (Fig. 1b,c and Extended Data Fig. 2a–e). These findings were confirmed by alkaline Comet assay that measures levels of DNA damage on a single cell level, and used Olive Tail Moment (OTM) as a read-out15, demonstrating that CAF-CM decreases DNA damage (Fig. 1d).
Although cells in the TME, such as CAFs, can promote tumour cell survival through secretion of metabolites and deoxycytidine that competes with GEM16,17, our data indicate broader protection against multiple chemotherapies. Size fractionation of CAF-CM showed that metabolites (<3 kDa) provided some protection against GEM as previously reported, whereas the high molecular weight fraction (>3 kDa) conferred significantly stronger protection (Fig. 1e–g and Extended Data Fig. 2f–h). Boiling abolished this effect (Extended Data Fig. 2f), indicating a protein-mediated resistance mechanism. Overall, these data show that CAF-CM protects PDAC cells from chemotherapy by reducing DNA damage, likely through secreted proteins.
Given that CAFs secrete abundant ECM proteins, we tested whether ECM components are responsible for the increased tolerance towards DNA-damaging agents. Addition of purified collagen I, fibronectin and laminin reduced γH2AX foci following SN-38 or GEM treatment, indicating decreased DNA damage (Fig. 1h and Extended Data Fig. 3a–c). Although most ECM proteins were protective, responses varied, suggesting the effect being mediated by multiple integrin heterodimers. Indeed, integrin expression in PDAC cell lines was heterogeneous and further modulated by CAF-CM (Extended Data Fig. 3d,e). RGD peptides alone were ineffective, indicating that larger or polymerized ECM proteins are required for protection.
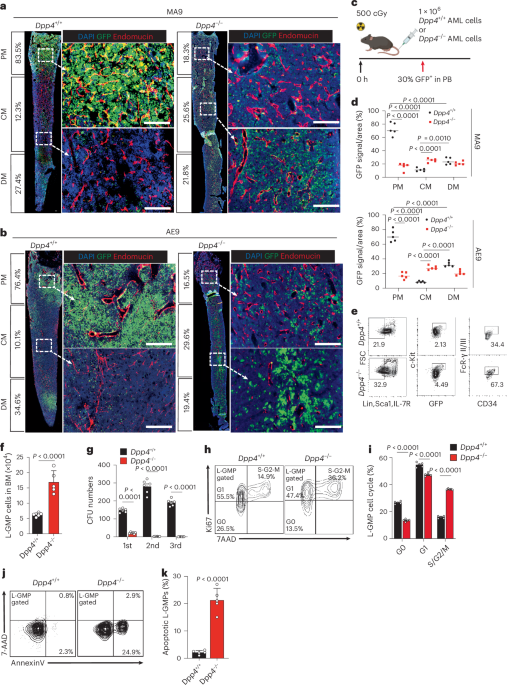
Phospho-N-myc downstream-regulated gene 1 (NDRG1) is upregulated in PDAC cells in response to CAF-CMTo gain more mechanistic insight into how PDAC cells respond to CAF-CM we performed reverse-phase protein array (RPPA) analysis of ~304 proteins and phospho-proteins across major cancer signalling pathways in three PDAC cell lines (BxPC-3, HPAC and SW1990) treated with GEM. CAF-CM induced multiple prosurvival proteins at 72 h, including p-STAT3, EGFR, IGF1R and ECM-responsive proteins p-Src and p-FAK. However, the top upregulated protein was phospho-NDRG1 (Thr346), accompanied by increased total NDRG1 levels (Fig. 2a,b).
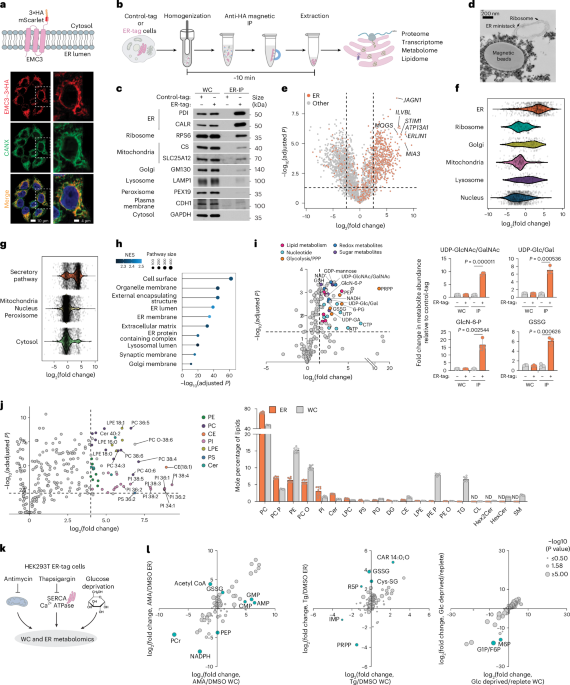
Fig. 2: Phospho-NDRG1 is upregulated by CAF-conditioned medium and is phosphorylated via ECM–integrin–Src–FAK–SGK1 axis. The alternative text for this image may have been generated using AI.
a, RPPA was performed on three pancreatic cancer cell lines (HPAC, SW1990 and BxPC-3), probing for 304 phospho- and total proteins. The cells were treated with 1 µM GEM for 72 h in NC or CAF-CM. The data are shown as CAF-CM normalized over NC medium. Only significantly (P < 0.05) changed proteins are shown. Yellow indicates proteins that were most significantly upregulated in the CAF-CM and blue indicates downregulated proteins (heat-map, log2 fold change). n = 3 biological replicates per cell line. b, Western blot validation of the RPPA. Cells were treated with NC medium or CAF-CM ± 1 µM GEM for 72 h, medium was changed daily, and cells were collected 1 h after the last medium change. Gels were run at least three times with similar results and probed for pNDRG1 (T346), total NDRG1, EGFR, p-FAK (Y397) and actin. The data represent n = 3. c, Purified ECM proteins (laminin-5, fibronectin or collagen 1) were added to serum-starved HPAC or SW1990 cells for 3 h, NC and CAF-CM were used as controls. Cells were lysed and analysed for pNDRG1, total NDRG1 and tubulin. The experiment was repeated three times independently. d, General scheme of ECM-triggered signalling events, and pharmacological inhibition approaches used in experiments e–k. e–g, SW1990 and HPAC cells were treated with integrin β1 or integrin β4 function blocking antibodies or control Mouse IgG1 in CAF-CM. NC medium was used as a control. Experiment was repeated three times with similar results. Mean fluorescence intensities of pNDRG1 signal were quantified in Fiji, plotted, and analysed using two-tailed Mann–Whitney U-test (e,f). n = 73–142 (e) and n = 113–297 (f) cells were analysed per condition. Boxplots for data are shown with line indicating median and whiskers show min and max values, the box denotes the interquartile range, n = 3 biological replicates, pooled data are shown. Cells were immunostained for pNDRG1 T346 (white) and nuclei (DAPI) (g). Scale bar, 100 µm. h,i, Src-family inhibitor saracatinib (2 µM) or FAK inhibitor defactinib (2 µM) was added to serum-starved cells (SW1990, HPAC) 1 h before addition of CAF-CM, the cells were lysed 3 h later and immunoblotted for pNDRG1 T346, NDRG1, p-FAK Y397, p-Src Y418 and tubulin. The data represent n = 3. j,k, SW1990 and HPAC cells were treated with vehicle control (DMSO) or inhibitors targeting AKT (MK-2206 250 nM) or SGK1 (BLU6340 250 nM) and CAF-CM was added for the indicated times. Cells were lysed and probed for pNDRG1, NDRG1, p-AKT S473 and vinculin. The data represent n = 3 biological replicates. Panels b–d created in BioRender; Muranen, T. https://app.biorender.com/illustrations/699cf91dab1263740cac8434 (2026).
NDRG1 is a stress-response protein with context-dependent roles in cancer. Although described as a cell-migration suppressor in prostate and gastric cancers cell lines18,19, it is associated with poor prognosis in several other malignancies such as glioma, inflammatory breast, gallbladder and liver cancer20,21,22,23. Given its strong induction by CAF-CM, we investigated this observation in PDAC.
CAF-CM increased both total and phospho-NDRG1 over time (Extended Data Fig. 4a,b). Because serum-starved CAFs secrete high levels of ECM (Fig. 1a and Extended Data Fig. 1c,d), we tested whether ECM proteins stimulate NDRG1 phosphorylation. Multiple soluble ECM proteins induced pNDRG1 (Fig. 2c). Blocking integrin β1 or β4 reduced pNDRG1 in the presence of CAF-CM, and pharmacological inhibition of major integrin-activated kinases c-Src or FAK prevented NDRG1 phosphorylation (Fig. 2d–i). Conversely, overexpression of Src or FAK reduced chemotherapy-induced DNA damage even without ECM or CAF-CM (Extended Data Fig. 4c–f). These findings identify the integrin–Src–FAK axis as a driver of ECM-induced NDRG1 phosphorylation.
NDRG1 is phosphorylated at its C-terminal Thr346 (and adjacent identical sites Thr356/Thr366) by AGC kinases such as AKT and SGK24,25. Using the AKT inhibitor MK-2206 and a previously unreported, highly selective SGK1-3 inhibitor BLU6340 (Supplementary Figs. 1 and 2 and Supplementary Table 1), we found that SGK inhibition abolished CAF-CM-induced NDRG1 pThr346 phosphorylation, whereas AKT inhibition had no effect (Fig. 2j,k and Extended Data Fig. 4g,h), identifying SGK1-3 as the primary kinases for NDRG1 phosphorylation in PDAC. Notably, NDRG1 phosphorylation correlated with increased total NDRG1 levels (Fig. 2b,c,j,k and Extended Data Fig. 4a,b,g,h). Because both SGK and NDRG1 have been reported to localize to the nucleus and cytoplasm26,27,28,29, we examined NDRG1 distribution following SGK inhibition and observed a reduction in nuclear NDRG1 upon BLU6340 treatment (Extended Data Fig. 4i–k).
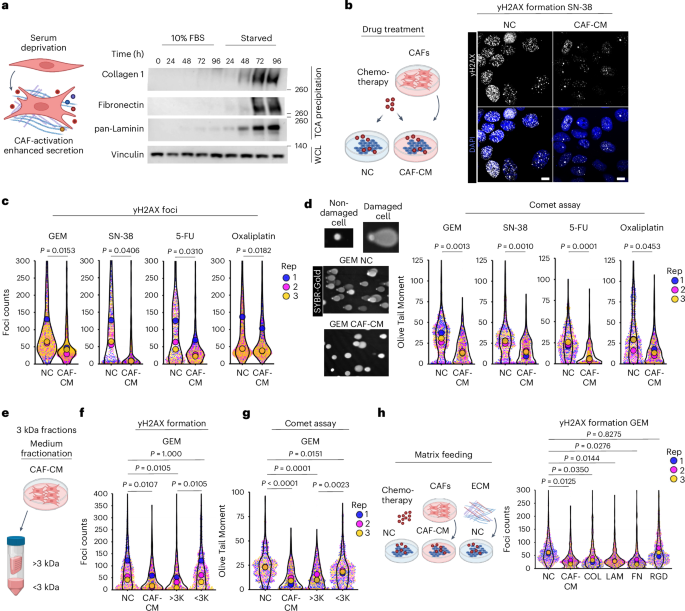
NDRG1 expression correlates negatively with patient survival and efficacy of gemcitabine treatmentBecause ECM proteins stimulated NDRG1 phosphorylation, we examined its role in desmoplastic PDAC. Although NDRG1 has been described as both a metastasis suppressor18,19,30 and as a tumour-promoting protein20,21,22,31, analysis of a human PDAC tissue microarray (TMA) PA805b (58 tumours and 20 healthy pancreas samples) showed significantly elevated phospho- and total NDRG1 in tumours compared with healthy tissue (Fig. 3a–c). We found that 80% of normal samples were negative for phospho-NDRG1, whereas nearly 50% of PDAC cases were phospho-NDRG1 positive. While total NDRG1 was detectable in most tissue sections, 82% of tumours exhibited moderate-to-strong staining (score 2 or 3), significantly higher than normal pancreas (Fig. 3c).
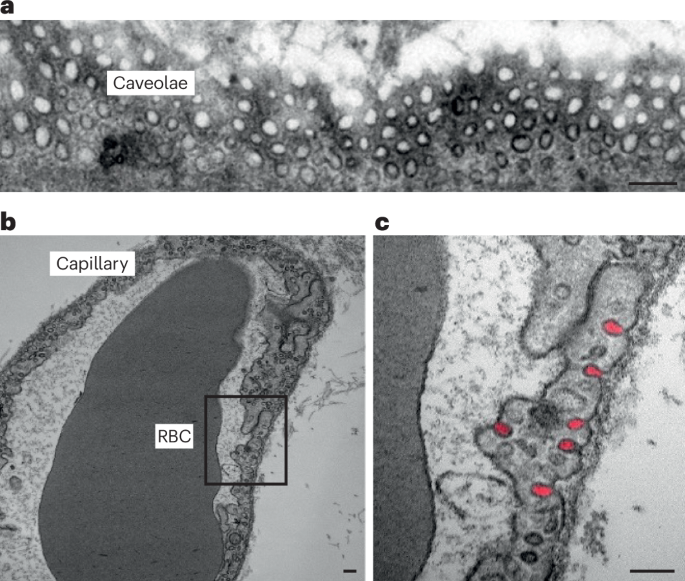
Fig. 3: NDRG1 is highly expressed in PDAC and correlates with poor survival. The alternative text for this image may have been generated using AI.
a, Healthy pancreas and PDAC TMAs (PA805b, 20 healthy and 58 tumours) were stained for phospho- and total NDRG1 expression, analysed for presence or absence of staining and graded by a pathologist. Representative images of immunohistochemistry (IHC) staining showing NDRG1 expression in healthy versus tumour tissue. Scale bar, 500 µm. b,c, p-NDRG1 and tNDRG1 expression/intensity from the tissue microarray from a was analysed by Fisher’s exact test (two-sided). d, PDAC tissue resections of the 59-year-old male patient treated with six cycles of GEM/Abraxane (patient 1) and of the 37-year-old female patient treated with six cycles of FOLFIRINOX and stereotactic body radiation therapy (SBRT) (patient 2) were stained for phospho-NDRG1 expression. Representative images are shown. Two areas of interest per patient are shown. From left to right: panels show pNDRG1 positivity both in the nuclei and the cytoplasm of the neoplastic epithelium surrounded by the stroma. Middle panel shows haematoxylin and eosin stain of the same tissue. Right panel shows Masson’s trichrome staining highlighting the fibrotic stroma (in blue), cytoplasm of the neoplastic epithelium (red) and nuclei (dark red). Arrows point to neoplastic glands. Scale bars, 50 µm (patient 1) and 100 µm (patient 2). e, Representative GEM-treated SW1990 xenograft tumour sections used for high-content spatial image analysis, stained for fibronectin (FN1: magenta), pNDRG1 (yellow) and Ki67 (yellow). White dotted line indicates stroma border. Scale bar, 200 µm. n = 8 tumours. f,g, pNDRG1 and Ki67-positive/high intensity cells are localized in close proximity to the stromal border. Spatial analysis of pNDRG1 and Ki67 signal intensity in xenograft tumours (n = 8) in the tumour cells based on their signed distance to the closest stromal border (Distance in µm is on x axis). Graphs zoom on events at a −50 to 200 µm distance to signed stromal border. Negative distance indicates cells located within stromal regions, whereas positive distances show cells located outside these regions. Cells positive for pNDRG1 or Ki67 were grouped into bins (in violet) based on distance from signed stroma border and cell number per bin is plotted on the left y axis, bin size is 10 µm. Purple sensogram represents average maximum cellular signal intensity of pNDRG1 or Ki67-positive cells (black dots; s.e.m. indicated as purple overlays) per bin and values are plotted on the left y axis. n = 8 tumours were analysed. h, Analysis of NDRG1 expression in the ICGC cohort of RNA-seq samples of non-treated bulk resected PDAC samples stratified by squamous, pancreatic progenitor, immunogenic and aberrantly differentiated endocrine exocrine (ADEX) subtypes. A Kruskal–Wallis test was used to assess significance. n = 96. Data are shown as boxplots; line represents median, whiskers indicate 1.5 × interquartile range (IQR) values, the box denotes the IQR, and points located outside the whiskers are considered outliers. i, Disease-specific survival probability of patients treated with adjuvant GEM therapy stratified based on NDRG1 mRNA expression status (high versus low). mDSS was calculated, numbers indicate individual patients. Kaplan–Meier survival analysis and log-rank test (two-sided) were used to analyse disease-specific survival.
Analysis of The Cancer Genome Atlas (TCGA) dataset revealed NDRG1 locus amplification in 11% of PDAC cases (Extended Data Fig. 5a). Patients with NDRG1 amplification had significantly reduced overall survival (Extended Data Fig. 5b). In addition, high phospho-NDRG1 levels in tumour samples were associated with shorter median overall survival (Extended Data Fig. 5c).
In PDAC resections from patients treated with standard-of-care regimens (GEM/Abraxane or FOLFIRINOX and stereotactic body radiation therapy), pNDRG1–positive lesions were surrounded by fibrotic stroma (Fig. 3d). Given that NDRG1 phosphorylation is induced by the ECM–integrin–FAK–SGK1 pathway (Fig. 2), we hypothesized that phosphorylation depends on proximity to ECM. Because human PDAC resections do not have a defined ‘tumour edge’ but rather present as clusters of neoplastic glands (often comprising at about 10% or less of the resection specimen) dispersed in a fibrotic stroma, we assessed GEM-treated SW1990 mouse xenografts (Fig. 3e). Quantitative spatial analysis showed that tumour regions adjacent to stroma border had the highest phospho-NDRG1 signal and were highly proliferative, as indicated by Ki67 positivity (Fig. 3e–g and Extended Data Fig. 5d–h).
Interrogation of International Cancer Genome Consortium (ICGC) data32 showed that NDRG1 expression is enriched in the squamous (basal-like) PDAC molecular subtype (Fig. 3h), known to be associated with the worst PDAC prognosis33. Among 237 post-surgical PDAC patients treated with adjuvant GEM, high NDRG1 expression correlated with shorter median disease-specific survival (mDSS, 15.9 versus 25 months) (Extended Data Fig. 5i). To determine whether NDRG1 expression might be indicative of clinical response to GEM, patients who received GEM in the adjuvant setting were stratified into high- and low-NDRG1-expressing groups. GEM-treated patients with high NDRG1 expression had significantly shorter disease-specific survival than those with low NDRG1 expression (mDSS 17 versus 34 months, respectively) (Fig. 3i).
Overall, the analyses of the two PDAC patient cohorts TCGA and ICGC (187 and 237 patients, respectively), together with protein data from patient issues, suggest that high NDRG1 expression is prognostic for worse survival and may predict therapeutic response to GEM.
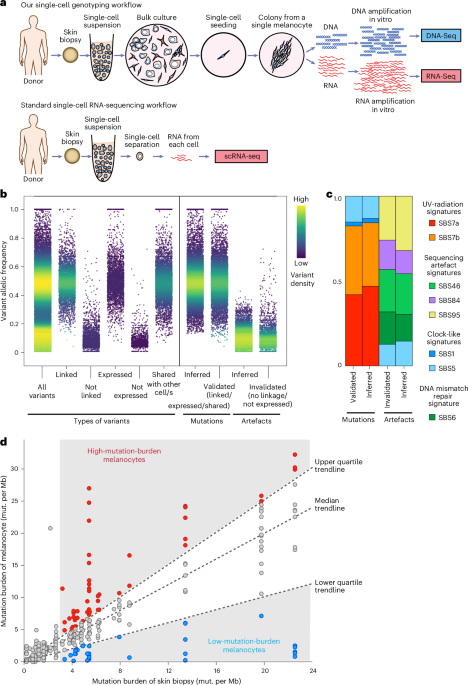
Loss of NDRG1 increases DNA damage and impairs tumour growthGiven the association between high NDRG1 expression and poor GEM-treated patient survival, we examined whether NDRG1 expression or its phosphorylation contributes to PDAC tumour growth. Inhibition of SGKs with BLU6340 or SGK1-3 knockdown reduced CAF-mediated protection and increased DNA damage in GEM- and SN-38-treated PDAC cells (Fig. 4a and Extended Data Fig. 6a,b). Similarly, NDRG1 knockdown increased γH2AX foci and DNA damage in response to GEM and SN-38, but not 5-FU (Fig. 4b–d, Extended Data Fig. 6c). In addition, NDRG1 depletion also elevated basal DNA damage, which was further exacerbated by chemotherapy (Fig. 4b,d).
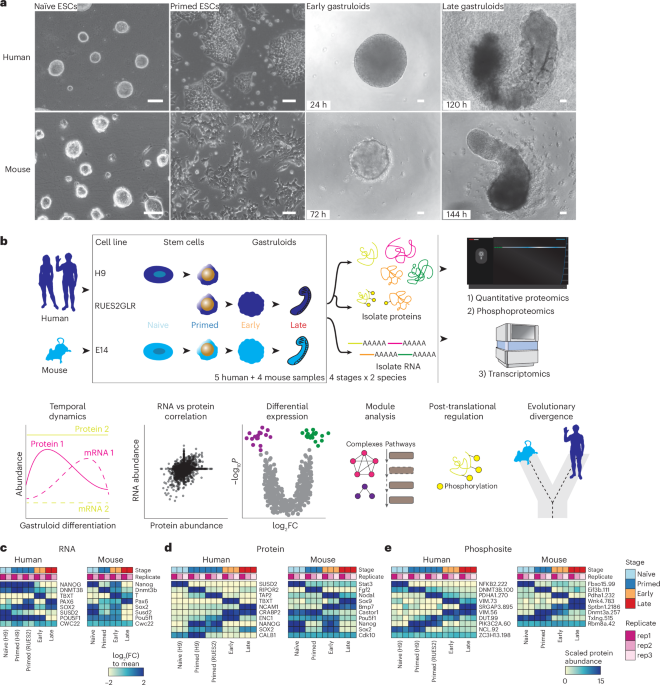
Fig. 4: Loss of NDRG1 increases DNA damage and impairs tumour growth. The alternative text for this image may have been generated using AI.
a, SW1990 cells were treated with 1 µM GEM, 0.5 µM SN-38 or 100 µM 5-FU in CAF-CM ± 250 nM SGK1 inhibitor BLU6340. After 24 h, the cells were subjected to Comet assay. OTM values were analysed using a nested mixed-effects model with Holm-corrected pairwise comparisons of biological replicates, >190 cells were analysed per condition. n = 3 biological replicates. b, SW1990 cells were transfected with short interfering RNA (siRNA) against LUC or NDRG1 and probed for NDRG1 and vinculin. The cells were also treated with DMSO, 1 µM GEM or 0.5 µM SN-38, and immunostained for yH2AX (white) and DAPI (blue). Scale bar, 5 µm. Similar data were obtained in three independent experiments (see quantification in d). c, siLUC and siNDRG1 cells were treated with 1 µM GEM, 0.5 µM SN-38 or 100 µM 5-FU in CAF-CM, and analysed by Comet assay. OTM values were plotted and analysed as in a, n = 3 biological replicates, >190 cells were analysed per condition. d, yH2AX foci formation image quantification for b was performed using CellProfiler, foci numbers per single nucleus were plotted and nested mixed-effects model with Holm-corrected pairwise comparisons was used for analysis. n = 3 biological replicates, >100 cells were analysed per condition. NT, non-treated. e, SW1990 cells expressing doxycycline-inducible shRNA against NDRG1 and CNTR cells expressing scrambled shRNA were injected into nude mice. NDRG1 knockdown was induced by feeding the mice doxycycline chow until the experimental end point. Tumours were allowed to grow until palpable and treated with 25 mg kg−1 GEM twice a week for 50 days. Tumours were collected and imaged on day 80. f, SW1990 NDRG1 KD and CNTR IHC sections of the tumours were stained for NDRG1 expression. Scale bar, 5 mm. Red asterisks indicate the NDRG1 KD tumours with low knockdown efficiency excluded from further analyses in g–k. g, Growth curve of the tumours shown over time (NDRG1 KD, pink; CNTR, blue). log-transformed values of the tumour volumes were analysed using a mixed-effects model. h, Tumour volumes were measured by calipers at the experimental end point and plotted, two-tailed Mann–Whitney U-test was used for analysis. n = 8. i, Tumour weight was measured at the experimental end point and plotted, two-tailed Mann–Whitney U-test was used for analysis. n = 8 tumours. j,k, Tumour sections were stained for pan-cytokeratin to define cancer cells, Ki67 to define proliferative cells, yH2AX to assess DNA damage and the nuclei were counterstained by DAPI. Whole-slide image analysis was performed in QuPath by applying appropriate thresholds to define pan-cytokeratin, Ki67 and yH2AX positivity. Percentage of the Ki67- and yH2AX-positive cells in relation to pan-cytokeratin-positive cells within each tumour is plotted. Two-tailed Mann–Whitney U-tests were used for analysis, error bars show s.e.m. Data points in red refer to the NDRG1 KD tumours with low knockdown efficiency marked with red asterisk in f and were excluded from statistical analyses. n = 8 tumours. Panels a,e created in BioRender; Muranen, T. https://app.biorender.com/illustrations/699cf91dab1263740cac8434 (2026).
Additionally, CRISPR/Cas9-mediated NDRG1 knockout (KO) reduced PDAC cell proliferation and sensitized CAF-CM–treated cells to GEM and SN-38 (Extended Data Fig. 6d–j). Although SGK inhibition increased DNA damage, BLU6340-treated cells maintained normal proliferation rates (Extended Data Fig. 6k) and showed only modest GEM sensitization compared with NDRG1 knockout (KO) cells, which displayed markedly higher γH2AX levels (Extended Data Fig. 6l,m). These findings suggest that NDRG1 loss has a stronger impact than pharmacological SGK inhibition.
Because DNA damage predominantly occurs during S phase, we analysed cell cycle dynamics upon SGK inhibition or NDRG1 deficiency (Extended Data Fig. 7). We also synchronized cells at the G1/S border and monitored cell cycle progression through S phase. Both BLU6340 treatment and NDRG1 deficiency led to a slower S phase entry and an inability of cells to progress through S phase at the same pace as the CNTR cells (Extended Data Fig. 7a–d). However, BLU6340-treated cells exited S phase similarly to controls, while NDRG1 KO cells accumulated in late S phase and progressed more slowly to G2/M. Because the KO cells spent longer in S phase, this might explain the heightened sensitivity of NDRG1 KO cells to DNA-damaging agents compared with BLU6340-treated ones.
Finally, we wanted to assess the role of NDRG1 in tumour formation in vivo. While control cells (CNTR) formed distinct tumours (eight of ten), NDRG1 KO cells were less tumourigenic (six of ten) and significantly smaller (Extended Data Fig. 8a–c). In doxycycline-inducible NDRG1 knockdown and KO models treated with GEM, NDRG1-deficient tumours exhibited reduced growth, decreased Ki67 positivity, and increased γH2AX compared with controls (Fig. 4e–k and Extended Data Fig. 8d–i).
Collectively, these data indicate that NDRG1 expression leads to overall higher tumour growth rate and reduces DNA damage in the presence of DNA-damaging agents.
NDRG1 has a direct role in DNA replication and repairGEM and SN-38 induce replication stress by stalling replication forks and generating double-strand breaks (DSBs)34. Because NDRG1 loss sensitized PDAC cells specifically to these agents and led to S phase defects, we investigated whether NDRG1 plays a direct role in DNA replication, repair or in the protection of replication forks. Using mass spectrometry-coupled isolation of proteins on nascent DNA (iPOND), we detected both total and phosphorylated NDRG1 at active and stalled replication forks (Fig. 5a). This is consistent with previous report that detected NDRG1 at active replication forks in HCT-116 cells35. These data also support another previous report, which showed and interaction between NDRG1 and PCNA, the DNA polymerase clamp, a marker of active replication forks36.
Fig. 5: NDRG1 is found at the replication fork and regulates stalled fork recovery. The alternative text for this image may have been generated using AI.
a, Isolation of proteins on nascent DNA (iPOND). HPAC cells were used to assess proteins present at active replication fork, during chromatin maturation and at stalled replication forks. EdU pulse without biotin azide was used as a negative control. iPOND fractions were run on SDS-PAGE and immunoblotted for pNDRG1 T346 and total NDRG1. PCNA, H3 and yH2AX were used as controls for replication fork progression/maturation. n = 8 biological replicates were pooled and used in the assay. b, Schematic of human NDRG1 where His194 (green) and the three phospho-residues in the C-terminal tandem repeats (TRs) are marked. H194A mutation was introduced, and constructs expressing V5-tagged WT or H194A NDRG1 were used for rescuing the NDRG1 KO in SW1990 cells. Protein expression was probed by immunoblotting for V5-tag and NDRG1, similar data was obtained in three independent experiments. c, Live cell proliferation analysis of CNTR (blue), NDRG1 KO mix (yellow) and NDRG1 rescue cells (WT red, H194A orange) in 10% FBS. Data are presented as mean ± s.e.m., log-transformed data were analysed with two-way repeated-measures (RM) analysis of variance (ANOVA), no significant differences were found between NDRG1 KO and H194A NDRG1 cells. Similar data were obtained in n = 3 biological replicates using orthogonal approaches. d, SW1990 NDRG1 KO and rescue cells (WT and H194A) were plated on coverslips, treated with 2 mM HU for 24 h, fixed and immunostained for yH2AX (white). Representative images of non-treated cells and HU-treated cells are shown, scale bar, 5 µm. Similar data were obtained in n = 3 biological replicates. e, Quantification of yH2AX formation in SW1990 CNTR, NDRG1 KO, and rescue (WT, H194A) cells after 1 µM GEM or 0.5 µM SN-38 treatment (24 h). yH2AX foci quantification was analysed using CellProfiler, foci numbers per single nucleus were plotted and nested mixed-effects model with Holm-corrected pairwise comparisons was used to assess significance. n = 3 biological replicates, >100 cells were analysed per condition. f, Replication fork dynamics were analysed by DNA Fibre Assay. CNTR, NDRG1 KO and NDRG1 rescue cells (WT and H194A) were labelled with CldU followed by IdU as indicated. Median IdU track lengths (µm) of >250 double-labelled fibres are shown in red. Two-tailed Mann–Whitney U-test was applied to test significance, n = 6 biological replicates, pooled data from n = 2 are shown. Representative images are shown, scale bar, 10 µm. g, To assess fork recovery after stalling, CNTR, NDRG1 KO and NDRG1 rescue cells (WT and H194A) were labelled with CldU, treated with 2 mM HU for 1 h to stall the replication fork, washed and IdU pulsed as indicated. Median IdU track lengths (µm) of n > 260 double-labelled DNA fibres are indicated in red, n = 3 biological replicates, pooled data from n = 2 biological replicates are shown. Two-tailed Mann–Whitney U-test was applied to test significance. Representative images are shown, scale bar, 5 µm. h, To analyse the effect of SGK1 inhibition on replication fork dynamics, SW1990 CNTR, NDRG1 KO mix and NDRG1 rescue cells (WT and H194A) were labelled with CldU and IdU as indicated in the presence of SGK1 inhibitor BLU6340 (250 nM, 24 h). IdU tracks were measured (µm) and medians of >250 fibres indicated in red. Mann–Whitney U-test was used for significance, n = 3 biological replicates, pooled data of n = 2 are shown. i, To assess how SGK1 inhibition influences fork restart after stalling, cells were treated with 2 mM HU in the presence of SGK1 inhibitor BLU6340 (250 nM), IdU track were measured and plotted. Scale bar, 5 µm. Medians indicated in red of >240 fibres. Mann–Whitney U-test was used for significance, n = 3 biological replicates, pooled data from n = 2 are shown. j, To analyse the effect of short-term versus long-term SGK1 inhibition on replication fork dynamics SW1990 cells were pulsed with CldU and IdU as described in f and treated with vehicle control (DMSO), 250 nM BLU6340 (24 h) or pre-treated with BLU6340 for only 0.5 h, after which the DNA fibres were analysed. Mann–Whitney U-test was applied to test significance, red line indicates median of >150 fibres, n = 5 biological replicates, pooled data from n = 2 are shown.
Next, to assess NDRG1 role more specifically in DNA replication, we performed reporter assays distinguishing DSB-induced homologous recombination (HR) from stalled fork–associated HR in mouse embryonic stem cells that carry an HR reporter system (6xTer-I-SceI-GFP) at the Rosa26 locus37 (Extended Data Fig. 9a–c). NDRG1 knockdown reduced HR efficiency at stalled forks by ~50% but did not significantly affect classical DSB-induced HR, indicating a specific role for NDRG1 in resolving replication-associated lesions rather than canonical DSB repair.
Although NDRG1 is considered to be a potentially inactive member of the α/β hydrolase enzyme family38, the crystal structure of the NDRG1 hydrolase fold (aa 31–319) revealed putative enzyme active site residues, Asp64 and His194, located near the position of the canonical α/β hydrolase catalytic triad (Ser-His-Asp)39. To test its relevance, we re-expressed wild-type (WT) NDRG1 or an H194A mutant in NDRG1-null cells (Fig. 5b). While wt NDRG1 expression restored proliferation and relieved DNA damage, the proliferation rate and DNA damage levels of the H194A NDRG1 expressing cells phenocopied the NDRG1 KO (Fig. 5b–e and Extended Data Fig. 9d).
Next, to assess NDRG1 role on replication fork progression we used the DNA fibre spreading technique40 (Fig. 5f and Extended Data Fig. 9e). SW1990 and AsPC CNTR, NDRG1 KO and KO add-back cells (WT or H194A), were pulsed successively with two thymidine analogues (CldU and IdU) and the IdU-labelled DNA fibre tracks were measured. NDRG1 KO and the H194A add-back both led to shorter IdU fibre track length further confirming that NDRG1 loss, or the H194A mutation causes replication defects. Later, we stalled the replication fork after the CldU pulse by adding hydroxyurea (HU) for 1 h, followed by release from HU into IdU pulse. Similarly, NDRG1 KO and the H194A mutant impaired fork restart (Fig. 5g and Extended Data Fig. 9e), whereas WT NDRG1 rescue restored normal fork dynamics.
SGK inhibition led to shorter fibre lengths and impaired replication fork recovery in CNTR cells and WT NDRG1-rescued cells but had very little effect on NDRG1 KO cells or H194A cells (Fig. 5h,i). Of note, both short- and long-term SGK inhibition slowed replication, indicating that SGK-dependent phosphorylation of NDRG1 is required for maintaining replication fork homeostasis (Fig. 5j and Extended Data Fig.
Comments (0)