
Remember me
A total of 55 skin biopsies were collected from 31 donors across multiple anatomical sites at the University of California, San Francisco (UCSF) and Northwestern University. At UCSF, biopsies were obtained from donor cadavers enroled in the UCSF Willed Body Program for research purposes. Living patients consented to participating in this study through approved protocols from the Institutional Review Board (IRB) of the University of California, San Francisco (22-36678) and the IRB of Northwestern University (STU00211546).
Cadaver tissues were obtained from donors who had provided broad pre-mortem consent, through their living will, permitting the use of their tissues for medical research and/or educational purposes. Donor demographic information, including age, sex and gender, was obtained from preapproved Vital Statistics Information Sheets. The living donors provided self-reported information and consent, in accordance with their IRBs, to publish data on their UV-radiation exposure and various risk factors for skin cancer, including age, sex, ancestry, sun exposure, sunscreen use and tanning-bed use, by completing a questionnaire. Comparable information for UCSF Willed Body Program donors was obtained from their consented Vital Statistics Information Sheets.
The biopsies were collected as either punch or shave biopsies, with diameters of 3 mm or 5 mm. Tissue samples (buccal mucosa, blood or skin biopsies from distinct anatomical sites) were also collected to establish the genome for each donor.
Tissue culture and clonal expansion of skin cellsEach skin biopsy was first trimmed to remove excess subcutaneous tissue, then incubated in 10 mg ml−1 dispase II for 16–18 h at 4 °C. After incubation, the epidermis was separated from the dermis. Melanocytes or MSCs residing in the hair follicle bulge/outer root sheath are not included in the epidermal fraction when a clean dispase-based epidermis and dermis separation is performed, as the bulge region lies below the basement membrane at the dermal interface. A single-cell suspension of the epidermal layer was obtained by incubating the tissue in 0.05% trypsin for 3 min, with intermittent vortexing every 10–15 s.
The resulting single-cell suspension was seeded in CNT40 medium (CELLnTEC) supplemented with 5% antibiotic–antimycotic and cultured at 37 °C with 5% CO2 to establish a bulk culture of keratinocytes and melanocytes over the course of a week. Melanocytes were then selectively isolated through limited trypsinization for 3 min, which detaches only the melanocytes, leaving the keratinocytes adhered.
The melanocytes were manually seeded as single cells into 96-well plates using serial dilution, and cultured in melanocyte medium (CNT40) to grow into clonal colonies of ~230 cells. Manual seeding was preferred over fluorescence-activated cell sorting, as it was less abrasive to primary cells and yielded more clonal expansions.
Colonies were monitored daily. Wells containing two or more cells on day 1 were marked as doublets and excluded from further analysis. Similarly, wells in which two physically separate colonies emerged (for example, on opposite sides of the well) were also classified as doublets and not processed. If a doublet was missed during screening, it became evident during mutational analysis, as somatic mutations in those wells showed allele frequencies consistently below 50%. Regular monitoring also allowed us to determine the optimal harvest time—when proliferation began to slow but before cells stopped dividing and underwent growth arrest. The replicative lifespan of melanocytes varied across samples, reflecting differences in intrinsic cell state, biopsy quality, donor age and other factors. Accordingly, colony sizes also varied. These findings align with previous reports showing that telomere shortening, donor characteristics and environmental exposures contribute to differences in melanocyte proliferative capacity30,31. Finally, monitoring cell growth also enabled us to confirm cell type by assessing cell morphology.
Genomic and transcriptomic sequencing of individual melanocytesThe colonies of melanocytes were collected in RLT buffer (Qiagen, 79216). DNA and mRNA were extracted, separated and amplified using the G&T sequencing protocol32,33. With this method, the DNA was amplified using either multiple displacement amplification (MDA, Qiagen, 150345) or primary template-directed amplification (PTA) protocol34 (BioSkryb, 100136). The mRNA was amplified using the SMART-Seq2 protocol32,33. Complementary DNA (cDNA) amplification was achieved using a KAPA HiFi HotStart ReadyMix kit (Roche, KK2502) followed by purification using KAPA HyperPure beads (Roche, 8963843001).
For the reference DNA, bulk DNA was isolated from buccal swabs using the prepIT.L2P method (DNA Genotek, PT-L2P-5) or from unrelated skin biopsies, extracted using the DNeasy Blood & Tissue Kit (Qiagen, 69504).
For library preparation, bulk DNA, melanocyte DNA or cDNA was sheared using a Covaris LE220 instrument to an average fragment size of 350 base pairs. This was followed by end repair, ligation with IDT8 or IDT10 dual index adaptors, and amplification using the KAPA HyperPrep Kit (Roche, KK8504). DNA libraries were then enriched using the KAPA HyperCapture Reagent Kit (Roche, 09075828001).
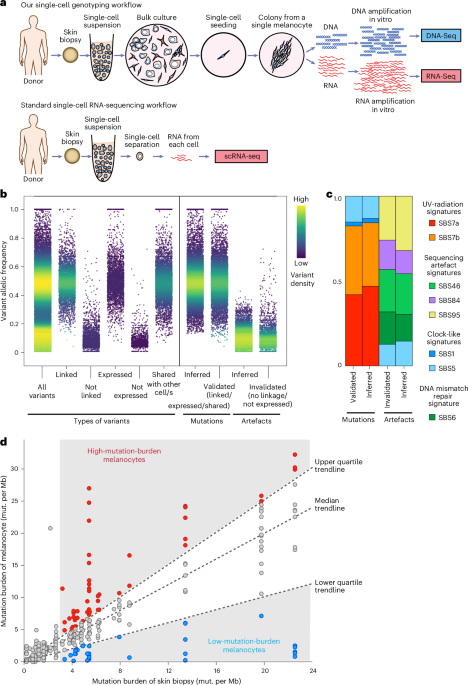
During the enrichment/hybridization step, probes were used from either the UCSF500 targeted cancer gene panel (developed and validated by UCSF Clinical Cancer Genomics Laboratory, Roche), the NimbleGen SeqCap EZ Exome + UTR panel (Roche, 06740294001) or the KAPA HyperExome V1 panel (Roche, 09062556001). The specific exome probe used for each melanocyte is identified in Supplementary Table 2. Samples were then subjected to paired-end sequencing (100 bp) on either an Illumina HiSeq 2500 or NovaSeq 6000 system, with a total of 297 melanocytes sequenced. For samples with low read counts, rehybridization and additional exome sequencing were performed as needed. A graphical summary of this method is shown in Fig. 1a.
All the nucleic-acid inputs and outputs involving G&T-Seq, library preparation, hybridization and sequencing were quantified using Qubit (dsDNA High Sensitivity quantification), an Agilent Bioanalyzer 2100 (High Sensitivity DNA run) and/or QuantStudio 5 real-time polymerase chain reaction (PCR) system (qPCR with the KAPA Quantification Kit, Roche, KK4854).
Workflow for sequencing-data analysis and variant callingDNA-sequencing data were aligned to the hg19 version of the human genome using the BWA-MEM algorithm (v2.0.5)35. Following alignment, Picard (v4.1.2.0) (https://broadinstitute.github.io/picard/) was used to deduplicate the genomic reads. The aligned reads were then realigned around indels and recalibrated using the Genome Analysis Toolkit (GATK v4.1.2.0)36. For RNA samples, sequencing reads were aligned to both the genome and transcriptome using STAR align (v2.1.0)37. Deduplication of RNA reads was performed using Picard (v4.1.2.0). Read counts for each gene were quantified with RSEM (v1.2.0)38. Different versions of some of these software programs were tested (https://github.com/ShainLab/Single_Cell_Somatic_Mutation_Caller/tree/main/benchmarking_data) and had little impact on the results.
To identify germline heterozygous single nucleotide polymorphisms (SNPs), FreeBayes (v1.3.1)39 was used, and the SNPs were filtered to include only those overlapping with known SNPs in the 1000 Genomes Project40 and with allelic frequencies between 40 and 60%. Among other uses, this information was utilized to detect allelic dropout, assisting in the removal of samples with low coverage or amplification biases. A DNAnexus app is available to perform these operations (https://github.com/ShainLab/HaploPrep/tree/main). We also include benchmarking data comparing FreeBayes to another SNP caller (https://github.com/ShainLab/HaploPrep/tree/main/benchmarking_data/VariantCaller_test).
CNVkit (v0.9.6.2) was used to infer copy-number alterations from both DNA- and RNA-sequencing data41,42. A reference was used in both modes. When running CNVkit in DNA mode, each cell was compared to a panel of normals from the same sequencing batch. When running in RNA mode, all other cells from the same sequencing batch were used as a reference. Other CNVkit parameters were set to default. As described in greater detail in the documentation, for DNA copy-number inference, CNVkit accepts an interval file of baits and automatically generates ‘bins’ for both on-target and off-target reads. The bin size depends on the bed file of baits. For this study, CNVkit automatically generated bins, resulting in ~250-bp on-target bins and 20-kb off-target bins. For RNA copy-number inference, each gene is treated as its own bin. CNVkit uses circular binary segmentation to segment files by default, producing .cns files of copy-number segments. Heatmaps showing copy-number inferences are available on figshare for each cell (https://doi.org/10.6084/m9.figshare.28700804.v2)43. Copy-number alterations were rare and therefore not a focus of the present study.
Additionally, a candidate list of short insertions and deletions was generated using Pindel44. We elected to use Pindel because it was the choice of the Pan-Cancer Analysis Working Group (PCAWG)45. We also benchmarked it against Mutect2, and for calling indels from DNA that had undergone whole-genome amplification we concluded the specificity was superior to Mutect2. The candidate indels were further filtered for a minimum of four reads and variant allelic frequency of 15% or higher. These candidates were visually inspected in an integrative genomics viewer to further remove (1) insertions within homopolymer tracts, which could theoretically be assigned to multiple positions within the tract, and (2) indels occurring adjacent to a germline SNP. These types of false positive indel were previously reported by the PCAWG45. The median number of indels per exome was 2, a small proportion of the overall mutation burden, and an extremely small proportion of mutations in this study.
For identifying somatic point mutations13, the initial candidate point mutations were called using Mutect2 (v4.1.2.0)46. The mutations were further filtered to remove artefacts that arose during whole-genome amplification (https://github.com/ShainLab/Single_Cell_Somatic_Mutation_Caller). The app uses phasing and expression information to validate somatic mutations. True mutations were expected to show linkage to these nearby SNPs, whereas artefacts typically displayed incomplete or no linkage.
For phasing, we begin by using the GATK ReadBackedPhasing function using the patient’s normal BAM file, a VCF of germline heterozygous SNPs (stringently filtered for high specificity), and an annotated VCF file as input. This generated a phased VCF file, which was then used as input for our ‘Single_Cell_Somatic_Mutation_Caller’ custom software application (https://github.com/ShainLab/Single_Cell_Somatic_Mutation_Caller). Within the application, custom scripts split tumour BAM reads into haplotype-specific BAM files. Candidate somatic mutations were then counted in the BAM files corresponding to each haplotype using the samtools mpileup function. These counts were compiled into a summary table, and our app categorized each variant as either clonal (that is, in complete linkage with the nearest germline SNP) or subclonal (not in linkage), or made no call if there were no nearby SNPs and/or coverage was low in the haplotype BAM files.
Second, RNA validation was conducted by verifying the presence of somatic mutations in the RNA-sequencing data, as artefacts were not anticipated to be present in either the genomic or transcriptomic datasets. This approach considers only mutations with sufficient RNA-sequencing coverage and excludes those introducing premature stop codons, which could trigger nonsense-mediated decay. This strategy also does not consider expression of X-chromosome mutations in females, because there is a 50% chance the mutation resides on the silenced allele. After counting the number of reference and mutant reads in matching RNA-sequencing data, our app calls each mutation either ‘expressed’ or ‘not expressed’, or it makes no call if coverage is insufficient, the mutation is truncating, and/or the mutation is on the X chromosome of a female sample.
After validating (or invalidating) candidate mutations within the expressed and phase-able portions of the genome, candidate mutations that do not reside in regions (for example, variants in genes that are not expressed and far away from germline heterozygous SNPs) were inferred to be mutations or artefacts based on their variant allele frequency (VAF). True mutations exhibited a normal distribution centred around 50%, whereas artefacts typically had lower allelic frequencies and fewer overall reads. Cutoff thresholds were set using receiver operating characteristic curves, trained on known mutations/artefacts from each sample, to maximize both sensitivity and specificity (Fig. 1b).
The specificity of mutation calls was benchmarked in several ways, as shown in Fig. 1b. The allele frequencies of mutations were bimodal, with most centred at 50% and a smaller subset at 100%. This pattern is exactly what one would expect for heterozygous and homozygous mutations in cells where copy-number alterations are exceedingly rare. Artefacts tended to have much lower allele frequencies, consistent with their origins in later rounds of whole-genome amplification. Moreover, mutations had expected mutational signatures (ageing or UV radiation), whereas artefacts had known artefactual signatures (Extended Data Fig. 1). These patterns held true whether mutations were inferred from their allele frequencies or validated based on their haplotype distribution, gene expression or presence in other cells.
Once mutations were called, mutation burdens were calculated as mutations per megabase. The total megabases of coverage is denoted the footprint of the genome covered. This was calculated using Footprints software13 and includes only nucleotide base pairs with a minimum of 10x or greater coverage.
Distinguishing melanocyte subpopulations with high and low mutation burdenTo identify melanocyte subpopulations with high and low mutation burden (Fig. 1 and Extended Data Fig. 2), we plotted the mutation burden of individual melanocytes versus the mutation burden of the skin biopsy from which they were derived. For this analysis, the median mutation burden of all sequenced melanocytes from each biopsy was considered the biopsy’s overall mutation burden. Linear regression was performed to fit trendlines through the upper and lower quartiles of mutation burdens. Melanocytes falling into the top quartile (Q1) were classified as having a high mutation burden, and those in the bottom quartile (Q4) were classified as having a low mutation burden (Fig. 1d). Only biopsies with a minimum mutation burden of 3 or higher were included, as it is difficult to distinguish subpopulations from biopsies with minimal DNA damage. We considered other definitions of low- and high-mutation-burden melanocytes (Extended Data Fig. 2). Encouragingly, a common set of genes was differentially expressed with the alternate definitions of low- and high-mutation-burden melanocytes.
Mutation signature analysis between melanocyte subpopulations and variant typesMutation signatures were inferred for all the cells with a minimum of ten mutations (Supplementary Table 3). The mutations from each melanocyte were compiled to create a mutational profile in the trinucleotide context of single base substitutions (SBSs), with the Bioconductor library BSgenome.Hsapiens.UCSC.hg19 (v1.4.3) using the DeconstructSigs R package (v1.9.0)47. Alexandrov and colleagues previously used non-negative matrix factorization to derive 78 unique mutation signatures from 2,780 whole-genome variant calls20, which have been widely used in other studies. These signatures, curated by the Wellcome Sanger Institute, are available in the Catalogue of Somatic Mutations in Cancer (COSMIC) database (https://cancer.sanger.ac.uk/signatures/sbs/).
We utilized the SigProfilerAssignment (v0.1.8), which applies a custom forward stagewise algorithm to assign the mutational profile of each cell based on these predefined COSMIC signatures (v3.4)48. Figure 2a shows the top eight mutation signatures observed across all cells, including UV-induced signatures. All remaining mutation signatures present in fewer than 10% of the cells were grouped as ‘others’. The overall SBS7 fraction for each melanocyte (Fig. 2d) was calculated by summing all four SBS7 signatures (SBS7a–d).
Mutation signature analysis was also performed to evaluate the quality of mutation calls. In Fig. 1c and Extended Data Fig. 1, we combine variants from all cells that we considered to be mutations or artefacts. Mutations and artefacts were further subdivided into those that were ‘validated’ (by their haplotype distribution and expression patterns) or ‘inferred’ (by their allele frequency). In general, somatic mutations were characterized by signatures expected to operate in skin, namely aging (SBS1 and SBS5) and UV radiation (SBS7a,b) (Fig. 1c). By contrast, artefacts had mutational signatures corresponding to known artefactual signatures (SBS46, 84 and 95) (Fig. 1c). When looking at the 96 bar plots, validated and inferred mutations occur in nearly identical trinucleotide contexts (Extended Data Fig. 1).
Analysis of gene-expression profiles between melanocyte subpopulationsDifferential gene-expression analysis was conducted using the DESeq2 R package (v1.38.3)11. RNA reads from the RSEM file were first normalized and transformed using variance-stabilizing transformation. A significance threshold of 10% adjusted P value (Benjamini–Hochberg) and a log2(fold change) greater than 0 was applied to identify differentially expressed genes. To visualize these genes, a volcano plot (Fig. 3a) and a heatmap (Fig. 3b) were generated. Additionally, gene expression in the two melanocyte subpopulations was compared to that of keratinocytes and fibroblasts using cell type-specific markers (PMEL, TYRP1 and MLANA for melanocytes, KRT14, KRT17 and KRT5 for keratinocytes and LUM, COL1A1 and S100A4 for fibroblasts; Fig. 3b) to confirm cell identity.
Genes enriched in melanocytes with high and low mutation burdens, as identified through differential expression analysis, were compared to enriched genes from three additional datasets: (1) adult melanocytes versus MSCs, (2) volar versus non-volar melanocytes and (3) foreskin versus trunk melanocytes. Datasets 1 and 2 were obtained from ref. 6, and dataset 3 from ref. 23. The hypergeometric test was performed on overlapping genes (Supplementary Table 7) in R using the phyper function as follows:
\(}\,}(},},},},}.}=},\log .}=})\)
Here, ‘o’ represents the number of overlapping genes, ‘a’ is the number of enriched genes in the first set, ‘b’ is the number in the second set, and ‘x’ is the number of remaining genes from the total platform of 18,000 genes. Statistical significance was based on the upper tail of the distribution (lower.tail = FALSE). The overlaps were shown as Venn diagrams (Fig. 3c, Extended Data Fig. 5a and Extended Data Fig. 5b).
We further analysed the overlap between the enriched gene sets from (1) high-mutation-burden melanocytes and (2) low-mutation-burden melanocytes with the annotated gene sets in the Molecular Signatures Database (MSigDB) using the Gene Set Enrichment Analysis (GSEA)22 tool. Specifically, we compared these overlaps with the following annotated human gene sets: H (hallmark gene sets), C1 (positional gene sets), C2 (curated gene sets), C3 (regulatory target gene sets), C4 (computational gene sets), C5 (ontology gene sets), C6 (oncogenic signature gene sets), C7 (immunologic signature gene sets) and C8 (cell type signature gene sets)22,49. Overall, our gene sets were compared to 33,591 MSigDB gene sets, comprising 42,499 genes. The results are presented as the number of overlapping genes per gene set, with statistical significance indicated by P values and Q values (false discovery rate). All gene sets that showed significant overlap with either the high- or low-mutation-burden melanocyte subsets are listed in Supplementary Table 5.
Validation of the gene-expression profiles of the melanocyte subpopulationsTo validate the gene-expression profiles of HighMut and LowMut melanocytes, we collected additional biopsies (n = 3) from the shoulders of three new donors (details are provided in Supplementary Table 2). From these biopsies, 15 melanocytes were sequenced using the same approach as for the main (discovery) cohort. Applying identical cutoff thresholds and selection criteria, melanocytes with high and low mutation burdens were identified (Extended Data Fig. 3a). Enrichment of HighMut- and LowMut-associated genes from the discovery cohort was assessed in the validation cohort by uniform manifold approximation and projection (UMAP) clustering of differentially expressed genes (Extended Data Fig. 3b) and heatmap comparison (Extended Data Fig. 3c).
The robustness of the gene signature was further assessed using repeated fivefold cross-validation with ten repetitions. In each training fold (80% of the cells) of every cross-validation split, we performed differential gene-expression analysis with DESeq2 and identified the significant genes, using the same settings and significance threshold (Benjamini–Hochberg false discovery rate-adjusted P < 0.1) applied to derive the final gene signature. To reduce variability due to a single cross-validation split, the entire fivefold cross-validation procedure was repeated ten times, resulting in 50 separate differential expression analyses (10 repetitions × 5 folds). We then plotted the percentage of training folds in which each gene was deemed significant. Of 9,989 genes, 300 were significant in at least one training fold. The 42 genes that we defined as HighMut and LowMut genes, based on a one-time differential gene-expression analysis of all cells, were all among the top 48 genes most frequently discovered across cross-validation training folds (Extended Data Fig. 4).
Comparing cell morphology between melanocyte subsetsCell images were captured using either a Zeiss Axiovert 40 CFL instrument or the Invitrogen EVOS FL system. Greyscale images were extracted with Fiji, and brightness and contrast were adjusted to enhance cell visibility (Fig. 4). The ‘rolling ball’ algorithm-based background subtraction was used to correct unevenly illuminated background.
Cell segmentation and analysisRaw in-focus images were processed by researchers blinded to mutational status. Briefly, brightfield images were imported into QuPath. The cells that could be distinguished from their neighbours were manually segmented using the polygon tool (4–15 cells per field of view). Annotation measurements were exported, and complexity was calculated from a perimeter-to-area ratio following the method from ref. 50. Additionally, the number of dendrites, or projections from the cell body, were manually counted for each segmented object. Measurements were analysed in GraphPad Prism. A representative selection of regions of interest (ROIs) was exported to Fiji and arranged using the ROI manager. The masks of the cells were filled and sorted based on high and low mutation. The complexity and dendrite count of representative melanocytes from clonal expansions of melanocytes with high and low mutation burdens were visualized in a box-and-whisker plot using Tukey’s method, with significance calculated by the two-sided Wilcoxon rank-sum test (Fig. 4c,d).
Spatial transcriptomic profiling using the Xenium platformSample selection and sectioningWe obtained FFPE skin samples from three different donors (detailed in Supplementary Table 8). The skin samples were each adjacent to melanoma. Regions containing only normal skin were identified by a dermatopathologist and used for downstream analyses.
A 5-µm section of the skin was mounted on a Xenium slide, with the skin sections positioned within the sample area (10.45 mm × 22.45 mm). Care was taken to ensure that none of the fiducial markers were covered, and any obstructions were manually removed to expose all markers correctly.
Before mounting sections on the Xenium slides, some were first mounted on standard slides and stained with haematoxylin and eosin (H&E) to verify the integrity of the tissue. Sections were also subjected to high-sensitivity eukaryotic Pico RNA analysis (Agilent, 5067-1513) using an Agilent Bioanalyzer 2100. The DV200 score was confirmed to be within the acceptable range for the Xenium run (50–70%).
Gene panel designThe targeted gene panel was based on the predesigned human skin panel (v1), which was composed of 260 genes. An additional 100 genes were incorporated to create a custom panel. These additional genes include those enriched in high-mutation melanocytes (n = 20), low-mutation melanocytes (n = 15), adult melanocytes (from ref. 6; n = 12), neonatal melanocytes (from ref. 6; n = 9), fetal melanocytes (from ref. 6; n = 3), MSCs (from ref. 6 and other reports; n = 12), differentiated melanocytes (n = 6), transitional melanocytes (n = 3), neural crest cells (n = 17)51,52,53,54,55,56,57,58,59,60,61,62,63, hair follicle bulge cells (n = 2)26,64 and Schwann cells (n = 1)65. Of the 23 genes enriched in high-mutation melanocytes and 19 genes in low-mutation melanocytes, some of them were already included in the predesigned skin panel. The genes FRG2DP and FTH1P10 were excluded due to the lack of suitable probes. The genes are listed in Supplementary Table 6.
Although most custom-added genes had the maximum probe set coverage (up to eight probes), some were reduced to prevent optical crowding. Additionally, the panel includes 40 negative control codewords to assess the specificity of the decoding algorithm and 20 negative control targets to evaluate the assay’s specificity.
Sample preparation for the Xenium assayThe slides were processed according to the 10X Genomics recommended protocol. Both slides were handled concurrently using the Xenium slides and sample prep reagents (10X Genomics, PN-1000460). First, the slides were assembled into cassettes (10X Genomics, PN-1000566). Next, the paraffin was removed from the slides, followed by rehydration and decrosslinking of the tissue sections to release sequestered mRNA. Subsequently, probes were hybridized to the target mRNA in the skin sections at 50 °C for 16–24 h. After hybridization, excess probes were washed off during a post-hybridization wash for 30 min at 37 °C. The probes consist of three regions: two regions at the ends that hybridize to the target RNA, and a middle region that encodes the gene-specific barcode.
Ligation of the probes to the target RNA forms a circular DNA probe structure. This is accomplished with a 2-h incubation at 37 °C. Following this, rolling circle amplification is performed for 2 h at 30 °C, generating multiple copies of the gene-specific barcode for each RNA target.
Cell segmentation stainingTo accurately identify the borders of each cell, immunofluorescence staining was performed using various cell structure markers, including nuclear stain (4′,6-diamidino-2-phenylindole, DAPI), boundary stains (ATP1A1, CD45, E-cadherin) and interior stains (α-SMA, vimentin,18S RNA) (Fig. 5a,b). The staining was carried out by incubating the slides at 4 °C for 16–24 h using Xenium cell segmentation staining reagents (10X Genomics, PN-1000661). After incubation, the stain was enhanced by adding the Xenium staining enhancer reagent, followed by washing to remove excess staining reagents. Autofluorescence was then quenched to reduce background noise. The final step in the staining process involved nuclear staining with DAPI (Supplementary Table 8).
Xenium onboard analysisThe slides were processed using the fully automated Xenium Analyzer. The skin samples were imaged over 15 cycles, with fluorescent probes targeting mRNA sequences and other reagents added, imaged and removed during each cycle. The image sensor captured three-dimensional data across four fluorescence channels and multiple fields of view (FOVs) throughout these cycles. The resulting images were stitched together to create a comprehensive spatial dataset for Xenium analysis.
The Xenium Analyzer then processed and decoded the transcript data using its onboard probabilistic model via the Xenium onboard analysis (XOA) pipeline (v3.0.2.0). This decoding utilized predefined fluorescent signal patterns, or codewords, to identify transcripts, with negative codewords included to ensure specificity. Once decoded, the transcripts were deduplicated, and the final data underwent secondary analysis to produce the XOA output. The analysis summary provided information on decoding accuracy, cell segmentation, gene expression and image quality control (QC). All the outputs were visualized using Xenium Explorer (3.1.0).
Post Xenium H&E staining of skin samplesTaking advantage of the non-destructive Xenium workflow, the skin-sample slides were H&E-stained post the analysis run. During cell segmentation staining, the autofluorescence quenching leaves behind a purple stain. The slides were therefore first removed from their cassettes, and quencher removal was performed using 10 mM sodium hydrosulfite (Sigma-Aldrich, 157953-5G). The skin sections were then stained with H&E, dehydrated and coverslipped for imaging. The samples were scanned at ×20 magnification using a Leica Aperio CS2 scanner. The output was processed using QuPath bioimage analysis software to extract a pyramidal, tiled ‘OME.TIF’ image file. This image was then imported into Xenium Explorer and manually aligned using a best similarity transformation method. The alignment relies on key points identified from both the XOA spatial output and the H&E-stained image.
Spatial analysis of high- and low-mutation melanocytesXenium was performed on four sections of skin (sequential sections of donor 1 and one section each from donors 2 and 3). Decoding of the four skin sections yielded 84.4% (48,418,166), 84.9% (46,940,134), 93.1% (62,571,678) and 88.2% (58,915,793) high-quality gene transcripts, with cell segmentation detecting 145,489 to 305,349 cells. Segmentation was performed with the Xenium Analyzer based on boundary staining, RNA abundance and by nuclear (DAPI) expansion. QC values for all the sections analysed by Xenium spatial transcriptomics are listed in Supplementary Table 8.
The XOA pipeline identified distinct clusters in the skin samples based on gene-expression profiles. We categorized the clusters more broadly into five groups after consulting with dermatopathologists and confirming their lineages from gene-expression profiling. The five broad categories include melanocytes, keratinocytes, immune cells, adnexal cells, fibroblasts and an ‘others’ category. The ‘other’ category includes rare cell populations that do not neatly fit into the other categories but may also include apoptotic cells and unevenly segmented cells. The reannotated clusters were visualized using a UMAP projection (Extended Data Figs. 7–9). A total of 5,340 melanocytes were detected in all sections (Supplementary Table 8).
Differential gene-expression analysis was performed, comparing the six categories of cells, outlined above, using the Seurat R toolkit (v5.1.0)66 (Extended Data Figs. 7–9). The thresholds for this analysis were an adjusted P value (Benjamini–Hochberg) of 0.05 and a log2(fold change) greater than 1. The top ten genes enriched in each cell type cluster were visualized as a dotplot heatmap, with upregulated genes marked in red, and the size of the dot indicating the fraction of cells expressing the gene.
To identify melanocytes with high and low mutation burdens, a read count matrix for all genes in the melanocyte clusters was generated from XOA outputs (matrix.mtx.gz, barcodes.tsv.gz and features.tsv.gz). A delta count (the difference between the sum of reads for genes enriched in high-mutation melanocytes and those enriched in low-mutation melanocytes) was calculated for each cell, and cells were rank-ordered based on their relative expression of ‘HighMut’ versus ‘LowMut’ genes. The top 15th percentile of cells were classified as high-mutation melanocytes, and the bottom 15th percentile as low-mutation melanocytes. Using this approach, 821 high-mutation melanocytes and 846 low-mutation melanocytes were identified in all samples (Supplementary Table 8).
After identifying the two melanocyte subpopulations spatially, we quantified their counts in four distinct regions of the skin sample based on proximity to hair follicles: follicular, near-follicle, interfollicular regions and hair bulb (Fig. 5). Two melanocytes (two of 1,648 cells) that did not fall within the defined regions were excluded from the cell-distribution analysis. The results are presented as a bar graph with a 95% confidence interval, and significance was determined using the Poisson test. We also measured the surface area of each melanocyte in the two subpopulations. The surface area data were visualized in a box-and-whisker plot using Tukey’s method, with significance calculated using Tukey’s post-hoc honest significant difference test.
Statistics and reproducibilityThe initial discovery cohort comprised 297 melanocytes derived from 55 skin biopsies collected from 31 donors across multiple anatomical sites, which provided sufficient power to define melanocyte subpopulations and associated gene-expression signatures. All melanocytes meeting predefined QC criteria (including sequencing coverage thresholds and allelic dropout assessment) were included in downstream analyses. No data were excluded. No statistical methods were used to predetermine sample sizes, but our sample sizes are similar or larger than those reported in previous publications11,12,
Comments (0)