Ethics statement
This study adheres to the ethical guidelines established by Sun Yat-sen University Cancer Center. Approval for all animal protocols was granted by the Sun Yat-sen University Animal Care and Use Committee (approval code L102012023040D). The collection of cancer patient samples was approved by the Institutional Review Board of Sun Yat-sen University Cancer Center (approval code SL-G2024-180-01).
Cell culture
U2OS (HTB-96, female), HeLa (CCL-2, female) and HEK-293T (CRL-1573, female) cells were cultured in Dulbecco’s modified Eagle medium supplemented with 10% foetal bovine serum (Gibco) and 1% penicillin–streptomycin. DLD-1 (CCL-221, male) and HCT116 (CCL-247, female) cells were cultured in Roswell Park Memorial Institute 1640 medium with 10% foetal bovine serum (Gibco). The cell lines, obtained from the American Type Culture Collection in 2017, were consistently maintained in an incubator at 37 °C (Thermo Fisher Scientific) with 5% CO2 in culture dishes (JET BIOFIL), and regular mycoplasma contamination tests were conducted.
siRNA and plasmids
The specific oligonucleotide sequences for small interfering RNAs (siRNAs) are detailed in Supplementary Table 4.
All constructs—including WT and mutants of ERCC6L2, CtIP and RNF138—were cloned into either the pLVX-Puro lentiviral vector or pcDNA3.1 vector. The WT and mutants of Ub were kindly provided by Professor Xiao-feng Zhu (Sun Yat-sen University Cancer Center). EGFP-tagged ERCC6L2 variants (full-length, ER-C and ER-N) and mCherry-tagged CtIP (WT and truncation mutants) were subcloned into the pcDNA3.1 vector.
Generation of KO cell lines with CRISPR–Cas9
KO cells expressing the specified sgRNAs were generated in DLD-1, HCT116, HeLa and U2OS cell lines by cloning the oligonucleotides detailed in Supplementary Table 4 into the pLenti-CRISPR V2 viral vector. After transfection with Cas9-gRNA plasmids, cells were subjected to puromycin selection 48 h later and subsequently cultured for approximately 3 weeks to allow colony formation. KO efficiency in selected clones was validated by Sanger sequencing and western blotting.
Antibodies and chemicals
The antibodies used in this study include: ERCC6L2 (Sigma-Aldrich HPA022422, used for IF and IHC at 1:100, immunoblotting (IB) at 1:800), CtIP (Active Motif 61942, used for IB at 1:1,000, IP at 1:100, IF at 1:200 and IHC at 1:100), γ-H2AX (Cell Signaling Technology (CST) 9718S, used for IB at 1:1,000, IF at 1:200 and IHC at 1:200), RAD51 (Abcam ab133534, used for IF at 1:200, and IB at 1:1,000 or Proteintech 67024, used for IF at 1:100), RPA2 (CST 2208S, used for IB at 1:1,000, IF at 1:200), BRCA1 (CST 9010S, used for IB at 1:1,000; Santa Cruz sc-6954, used for IF at 1:50), MRE11 (Abcam ab154480, used for IB at 1:1,000), RAD50 (CST 3427, used for IB at 1:1,000), Abraxas (Abcam ab139191, used for IB at 1:1,000), BRCC36 (Abcam ab108411, used for IB at 1:1,000), NBS1 (Proteintech 55025, used for IB at 1:1,000), EXO1 (Proteintech 16253, used for IB at 1:1,000), DNA2 (Proteintech 18727-1-AP, used for IB at 1:1,000), RNF138 (Abclonal A10304, used for IB at 1:1,000 or Abmart PH11971, used for IF at 1:100), 53BP1 (CST 4937S, used for IB at 1:1,000), BrdU (BD 347580, used for IF at 1:100), H3 (Abcam ab1791, used for IB at 1:1,000), Lamin B1 (Abcam ab16048, used for IB at 1:1,000), Flag (Sigma-Aldrich F1804, used for IB at 1:1,000), Myc (CST 2276S, used for IB at 1:1,000), HA (Proteintech 51064, used for IB at 1:1,000), His (CST 12698S, used for IB at 1:1,000), cleaved Caspase-3 (CST 9661T, used for IHC at 1:200), GAPDH (Proteintech 60004, used for IB at 1:1,000), β-actin (Proteintech 60008, used for IB at 1:1,000), GFP (Proteintech 50430, used for IB at 1:1,000, and IP at 1:200), SIAH1 (Proteintech 13886, used for IB at 1:1,000), RNF4 (Proteintech 17810, used for IB at 1:1,000), KLHL15 (Abclonal A16574, used for IB at 1:1,000), FZR1 (Proteintech 16368, used for IB at 1:1,000), ZMYND11 (Abclonal A6327, used for IB at 1:1,000), ZEB2 (Proteintech 14026, used for IB at 1:1,000), TOPORS (Abclonal A18526, used for IB at 1:1,000), UHRF2 (Proteintech 25710, used for IB at 1:1,000), ZMYND8 (Proteintech 11633, used for IB at 1:1,000), RBX1 (Proteintech 14895, used for IB at 1:1,000) and RLIM (Proteintech 16121, used for IB at 1:1,000). The ATMi KU-60019 and KU-55933 used in this study were obtained from Selleck Chemicals.
Colony formation assay
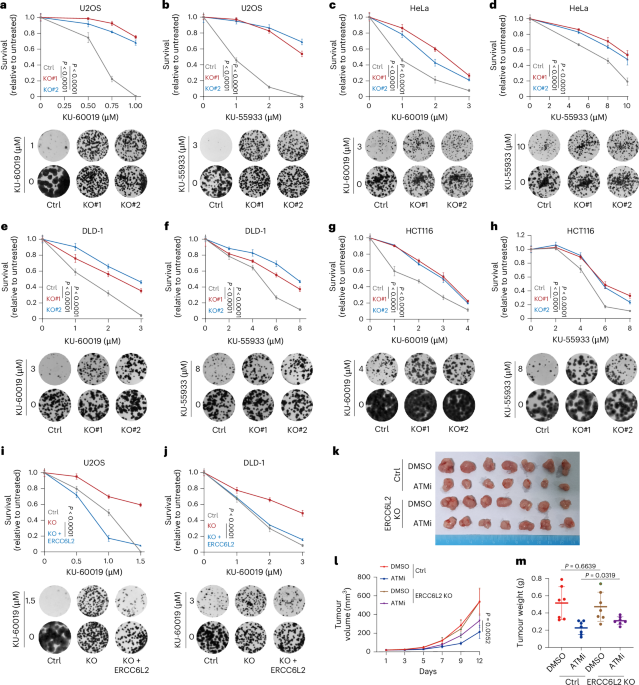
Cells were seeded at a concentration of 500–1,000 cells per well into 6-well plates or 100–300 cells per well into 24-well plates. After a 24-h incubation, tumour cell lines were subjected to continuous treatment with specified compounds for a duration of 10–14 days, tailored to their individual growth characteristics. Colonies were subsequently fixed using a fixation solution (methanol:acetic acid = 5:1 v/v) at room temperature for 25 min and then stained with a 0.5% crystal violet solution in methanol for a period of 2 h. The colony counts were based on the area of the colonies using ImageJ.
Xenograft models
The study complies with all relevant ethical regulations regarding animal research and was approved by the Sun Yat-sen University Animal Care and Use Committee. All animals were housed in standard conditions at the Center of Experimental Animal of Sun Yat-sen University. For the subcutaneous xenograft model, control and experimental DLD-1 cells resuspended in phosphate-buffered saline (PBS) were subcutaneously injected into the flanks of 4-week-old female BALB/c nude mice (Vital River Laboratories; n = 7 per group, randomly assigned to groups). When tumours reached 3–4 mm in diameter, mice were administered KU-55933 (10 mg kg−1) via intraperitoneal injection every 3 days. Tumour growth was monitored at 3-day intervals, and mice were euthanized after 2 weeks. The tumours were collected, fixed and paraffin-embedded for further analysis. In these studies, tumour sizes did not exceed the maximum allowable limit of 2.0 cm3, as approved by the Animal Care and Use Committee of Sun Yat-sen University.
Western blotting
Cell lysis was conducted using a lysis buffer (50 mM pH 7.4 Tris–HCl, 150 mM NaCl, 1 mM EDTA, 0.5% NP-40 and 10% glycerol) supplemented with protease inhibitor cocktail (CW2200S, CWBIO) on ice for 30 min. Denatured proteins were separated by 7.5–12.5% SDS–PAGE gels and then transferred to a polyvinylidene fluoride membrane. After blocking with 5% milk in TBST, the membranes were probed with primary and secondary antibodies and detected using the ChemiDoc Touch (Bio-Rad) or the e-Blot Touch Imager (e-Blot).
Silver staining and liquid chromatography–tandem mass spectrometry analysis
Protein gels were stained using the Fast Silver Stain Kit (P0017S, Beyotime) following the manufacturer’s instructions. The different strips were excised and subjected to in-gel digestion. The peptides were analysed by mass spectrometry, and identification was carried out using Mascot, based on the Uniprot database. Proteins identified from the immunoprecipitants pulled down with ERCC6L2 are listed in Supplementary Table 2.
Co-IP assays
Equal amounts of cell lysates were incubated with protein A/G magnetic beads at 4 °C for 1 h to preclear non-specific proteins. The beads were then discarded, and freshly prewashed protein A/G magnetic beads were mixed with specific antibodies. Alternatively, precoated magnetic beads (anti-Flag, anti-myc and anti-GFP) were added, and the mixture was incubated on a rotator at 4 °C overnight. The beads were washed four times using pre-cold IP lysis buffer for 10 min at 4 °C. After discarding the IP lysis buffer, samples were denatured in 1× SDS buffer for further western blotting analysis.
IF assays
Cells were plated on coverslips, washed once with PBS and fixed with 4% paraformaldehyde for 10 min on ice. Fixed cells were permeabilized with 0.5% Triton X-100 for 30 min at room temperature, blocked with 5% BSA for 30 min and then incubated with primary antibodies (diluted in 5% BSA) overnight at 4 °C. After incubation, coverslips were washed three times with PBST and incubated with a secondary antibody for 1 h at room temperature. Finally, coverslips were mounted with DAPI medium and visualized under the fluorescence microscope.
HR and NHEJ reporter assays
EJ5-GFP or DR-GFP U2OS cells seeded in six-well plates were transfected with the indicated siRNAs and subsequently infected with I-SceI adenovirus. After 48 h, the cells were trypsinized and subjected to flow cytometry analysis (CytoFLEX). The percentage of GFP-positive cells, which indicated the HR-mediated or NHEJ-mediated DSB repair efficiency, was determined.
Neutral comet assay
A comet assay was conducted to assess DNA damage by quantifying tail DNA. Cells were trypsinized, suspended in cold 1× PBS (Ca2+ and Mg2+ free), mixed with low-melting agarose (Trevigen) at a ratio of 1:10 (v/v), and immediately plated onto Cometslide (Trevigen). Neutral electrophoresis was performed at 25 V for 30 min in the electrophoresis system. Cell comets were visualized using a fluorescence microscope.
Subcellular fractionation
Following the manufacturer’s instructions, a subcellular fractionation kit (Thermo Fisher Scientific, #78840) was used to isolate subcellular fractions, allowing the extraction of cytoplasmic, membrane, soluble nuclear and chromatin-bound fractions. The protein lysates from specific fractions were then analysed by western blotting using the indicated antibodies.
DNA end-resection measurement
Stable U2OS cells expressing HA-ER-AsiSI were established following previously described methods31. Quantification of ssDNAs was executed using the HA-ER-AsiSI system, wherein the AsiSI enzyme is fused to the oestrogen receptor. Cells were treated with or without 300 nM 4-hydroxytamoxifen (4-OHT) for 4 h to induce DSBs at specific AsiSI sites. Subsequently, genomic DNA was extracted, and the ssDNA at the designated AsiSI site in chromosome 1 was measured through qPCR.
SMART assay
Cells were treated with 10 μM BrdU for 24 h. After a 24-h treatment with 5 μM ATMi, cells were trypsinized, counted and mixed with unlabelled cells at a 1:4 ratio. The cell mixture was spotted onto silane-coated slides and spread using a spreading buffer to stretch DNA fibres. After fixation with methanol/acetic acid and blocking with bovine serum albumin (BSA), the fibres were stained with anti-BrdU antibody and visualized by fluorescence microscopy53. Images were captured for at least 100 fibres per condition. DNA fibres were measured using ImageJ and subsequently graphed.
FRAP
FRAP experiments were performed using the OLYMPUS FV1000 system. Bleaching was targeted at a circular region of interest using 100% laser power, and time-lapse images capturing the recovery process were acquired at specified intervals. The prebleaching fluorescence intensity was established as 100%, and the fluorescence intensity at each timepoint was normalized (It) to calculate the fluorescence recovery using the following formula: FR(t) = It/Iprebleaching.
Molecular docking simulation
The three-dimensional structures of ERCC6L2, CtIP and RNF138 were predicted utilizing AlphaFold. Subsequently, protein–protein docking simulations were conducted using the GRAMM-X program, and the outcomes were visualized and analysed through PISA.
Clinical cancer samples
A total of 127 cases of CRC tissues were collected from patients who underwent surgical resection at the Sun Yat-sen University Cancer Center in Guangzhou, China, for correlation analysis between ERCC6L2 and CtIP expression. The gender and age of patients are reported in Supplementary Table 5. Informed consent was obtained. No compensation was provided to participants. Tumour differentiation was determined on the basis of the World Health Organization classification of Tumours of the Digestive System (2019 version). The tumour stage was defined according to the American Joint Committee on Cancer/International Union against Cancer TNM (tumour–node–metastasis) classification system (8th edition). Approval for this study was granted by the Institute Research Medical Ethics Committee of Sun Yat-sen University Cancer Center.
IHC and IHC score
In the initial steps, CRC specimens underwent deparaffinization and hydration, followed by a 10-min incubation with 3% H2O2 to neutralize endogenous peroxidase activity. Antigen retrieval was achieved through high-pressure and heat repair. Subsequently, specimens underwent a 30-min blockade with 5% bovine serum albumin. They were then incubated overnight at 4 °C with a primary antibody. A secondary antibody (PV6000, Zsbio) was applied at 37 °C for 1 h, and 3,3′-diaminobenzidine (ZLI9017, Zsbio) was used to stain the target protein, followed by haematoxylin staining. The IHC scores were evaluated using a framework based on distinct staining intensities. The IHC score for each sample was calculated using the following formula: 1 × (% weak staining) + 2 × (% moderate staining) + 3 × (% strong staining), resulting in IHC score values ranging from 0 to 300. Slide evaluation was performed independently by two experienced pathologists, who conducted their assessments without knowledge of the clinical parameters.
TCGA data acquisition and analysis
ERCC6L2 mRNA expression patterns were analysed across TCGA tumour samples and matched normal tissues. RNA-seq data (HTSeq raw counts) were obtained from the UCSC Xena browser (https://xenabrowser.net/datapages/).
Statistics and reproducibility
All experiments were performed with at least three independent biological replicates, unless otherwise specified. Statistical analysis was conducted using GraphPad Prism 8 and SPSS 20.0 software (SPSS). For comparisons between two groups, a two-tailed Student’s t-test or Mann–Whitney test was applied. One-way analysis of variance (ANOVA) or two-way ANOVA was used for multiple comparisons involving three or more independent groups. Two-sided P values of <0.05 were considered statistically significant. Data distribution was assumed to be normal, but this was not formally tested. No statistical method was used to predetermine sample size, but our sample sizes are similar to those reported in previous publications54,55. For all of the experiments, samples were randomly allocated to different groups. The investigators were not blinded to allocation during experiments and outcome assessment. No animals or data points were excluded from the analysis.
Reporting summary
Further information on research design is available in the Nature Portfolio Reporting Summary linked to this article.

Comments (0)