
Remember me
All mouse experiments were performed in accordance with National Institute of Health guidelines, and protocols were approved by the Massachusetts General Hospital Subcommittee on Research Animal Care (protocol no. 2019N000148), and all mice were maintained in a specific-pathogen-free environment certified by the American Association for Accreditation of Laboratory Animal Care. In animal experiments, data distribution was assumed to be normal, but this was not formally tested. Data collection and analysis were not performed blind to the conditions of the experiments.
All human experiments were performed under protocols approved by the Institutional Ethics Committee approved by the Massachusetts General Hospital. PDAC cell lines were derived and established from metastatic ascites collected under a discarded tissue protocol, in full compliance with Massachusetts General Hospital IRB guidelines (protocol no. 2011P001236), as previously reported36. These tumour cell lines were generated years ago; therefore, no identifying patient information or compensation records are available to the corresponding author. These tumour cell lines were generously provided by D.T. and M.L. (MGH Cancer Center and Harvard Medical School). Requests for additional patient-related information should be directed to these authors.
AnimalsPathogen-free male C57BL/6N (6–8-week-old) mice purchased from the National Cancer Institute Frederick Mouse Repository were used for mouse models of skin, lung and kidney fibrosis as well syngeneic tumour models. Immunocompromised NOD/SCID/gamma-c (NSG; NOD.Cg-Prkdcscid Il2rgtm1Wjl/Sz, 6–8–week-old) mice obtained from The Jackson Laboratory were used for the orthotopic xenograft model.
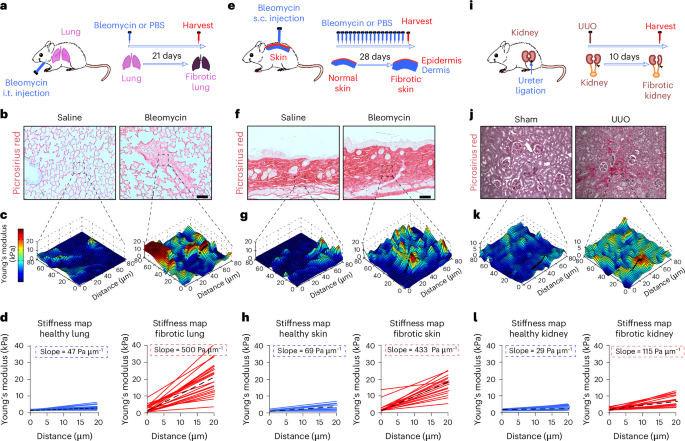
Mouse model of lung fibrosisLung fibrosis in 6–8-week-old mice was induced by intratracheal administration of bleomycin (50 μl at 1.2 U kg−1 body weight), as previously described19,21,53. Sterile saline was used as control. Mice were euthanized at the indicated timepoints including day 3 (peak of epithelial cell injury), day 7 (peak of inflammation) and day 21 (peak of fibrosis). Lungs and BAL were collected for AFM, histologic, flow cytometry, molecular and biochemical studies as well as hydroxyproline analysis.
Mouse model of skin fibrosisSkin fibrosis in 6–8-week-old mice was induced by daily subcutaneous injection of bleomycin (100 μl from 10 μg ml−1 stock) for 28 days, as previously described21. Sterile saline was used as the control. At the conclusion of experiments, mice were euthanized, and full-thickness 6-mm punch biopsies were obtained for AFM, histologic, molecular and biochemical studies as well as hydroxyproline analysis.
Mouse model of kidney fibrosisRenal fibrosis in 6–8-week-old mice was induced by unilateral ureteral obstruction (UUO) surgery, as previously described. In brief, the left ureter was ligated using a suture, leading to an obstruction of the kidney outflow tract on the ligated side so that the urine cannot drain anymore, causing hydronephrosis with tubular dilation and kidney fibrosis at day 14. Kidneys were collected for AFM, histologic, molecular and biochemical studies as well as hydroxyproline analysis.
Orthotopic xenograft mouse model of human pancreatic cancerPancreatic fibrotic tumours were induced by co-injecting 1 × 10⁵ PDAC3 GFP-Luciferase-tagged cancer cells with 9 × 10⁵ CAF-1 cells (PDAC-3%:CAF-1%, 1:9 ratio) in Matrigel (50 μl) and Dulbecco’s modified Eagle medium (50 μl, 1:1. ratio) into the tail of the pancreas, as previously described36. Pancreatic tumours were monitored every 3 days using in vivo luciferase imaging. In brief, mice were injected intraperitoneally with 100 mg kg−1 of body weight of luciferin (200 μl of a 10 mg ml−1 solution of luciferin in phosphate-buffered saline (PBS)) 10–15 min before imaging and anaesthetized with isoflurane, and bioluminescent signal (photon flux) was measured from the abdominal region of interest using the In Vivo Imaging System (IVIS) Lumina platform (PerkinElmer, Caliper).
Syngeneic KPC tumour modelDermal fibrotic tumours were induced by co-injecting 5 × 10⁵ cells in 100 μl PBS of the metastatic KPC689 pancreatic tumour line isolated from KPC mice (Pdx1‐Cre; LSL‐KrasG12D/+; LSL-Trp53R172H/+), as previously described54.
Collagen-GFP reporter miceTo facilitate the study of fibroblast biology in vivo, we used a transgenic reporter mouse expressing GFP under the control of collagen type I promoter (col-GFP mice) (The Jackson Laboratory, (Col1a1*2.3-GFP)1Rowe/J)). These mice are on a C57BL/6J background, develop robust lung fibrosis after bleomycin challenge and efficiently label collagen-producing cells with high specificity.
Generation of FAKL994E KI miceFAKL994E KI mice were developed at Taconic Biosciences via CRISPR–Cas9-mediated gene editing in C57BL/6 mice. In brief, the L994E mutation was introduced into exon 32 of the mouse Ptk2 gene (FAK, NCBI Gene ID: 14083; Ensembl Gene ID: ENSMUSG00000022607) via CRISPR–Cas9 with specific guide RNA (gRNA) and a short single-stranded DNA template. The gRNA sequence targeting exon 32 is GCTGAATCCGCTCGAGTAGT. The TTA codon (AAT complementary sequence in gRNA) indicates leucine 994, which was targeted for mutation with a short single-stranded DNA template including the CTT codon sequence, thus replacing leucine 994 by glutamic acid (L994E). An additional silent mutation was inserted into exon 32 to generate a restricition site (Hphl) for analytical purposes. In vitro fertilization was performed using oocytes from superovulated C57BL/6NTac females. For microinjection, one-cell-stage embryos were injected with a Cas9–gRNA ribonucleoprotein complex and single-stranded oligodeoxynucleotides (ssODNs) into the pronucleus of each embryo. After recovery, 25–35 injected one-cell-stage embryos were transferred to one of the oviducts of 0.5 days post coitum (dpc), pseudopregnant Naval Medical Research Institute (NMRI) females. Genotyping analysis was performed by polymerase chain reaction (PCR) using genomic DNA extracted from biopsies. The following templates were used as controls: H2O (ctrl1) and WT genomic DNA (ctrl2). The PCR amplicons were analysed using a Caliper LabChip GX device. The PCR detects the CRISPR–Cas9-induced constitutive KI allele as well as potential indel modifications and the unmodified WT allele. To distinguish indel modifications from unmodified WT sequences, a heteroduplex analysis (for example, via capillary electrophoresis) was performed. HphI digest results in cleavage of the 380-bp PCR product in two fragments (257 bp and 123 bp). Primers: forward primer: TCTTGGTGGCTCAAAGACAG; reverse primer: GGGCTACAGAGGCTAAGGTTAC. Expected fragments (bp): 380 (wt), 380 (indel), 380 (HDR). Furthermore, a restriction analysis of PCR product was perform to validate the presence or absence of the intended mutation via homology-directed repair. See the Supplementary Methods for further validation of this mouse model.
Generation of mouse precision-cut tumour slices and two-photon imagingTumours were embedded in a solution of 5% low-gelling temperature agarose (Sigma-Aldrich) in PBS. Subsequently, the tumours were sliced to a thickness of 500 μm using a Leica VT1200S vibratome immersed in ice-cold PBS. After slicing, live tumour slices were treated with AF647-anti-mouse CD90.2 (obtained from BioLegend) at a concentration of 10 μg ml−1 for 15 min at 37 °C. These slices were then transferred to 0.4-mm organotypic culture inserts (from Millipore) within 35-mm Petri dishes containing 1 ml RPMI-1640 (no phenol red; ThermoFisher) for subsequent treatment and imaging. Imaging of the fresh mouse tumour slices was conducted using a Leica SP8-MP upright multiphoton microscope with a Coherent Chameleon Vision II MP laser, equipped with a 37 °C thermostatic chamber. Tumour slices were secured using a stainless-steel ring slice anchor (Warner Instruments) and were perfused with RPMI-1640 solution (no phenol red) bubbled with 95% O2 and 5% CO2 at a rate of 0.3 ml min−1. Imaging was systematically performed at six different regions within the tumour using a 20× (1.0 numerical aperture) water immersion lens and a Coherent Chameleon laser at 880 nm/25 mW. Fluorescence detection utilized CFP (483/32), GFP (535/30), AF647 (685/40), and tdTomato (610/75) filters.
For the analysis of cell migration in four dimensions, z stacks of 70–90 μm with a step size of 5 μm were acquired every 30 s for 2 h, alternating between six fields. Videos were generated by compressing the z-stack information into a single plane using the max intensity z projection feature of Imaris and LAS X software. Cellular motility parameters were then calculated using Imaris software, with tracks covering more than 10% of the total recording time included in the analysis. Any drift in the x, y dimensions was corrected using the ‘Correct 3D Drift’ plug-in in FIJI-ImageJ. Quantification of tumour cell number and motility in various tumour regions, including stroma-rich and tumour invasive regions, was performed. These regions were delineated on the basis of visual inspection of immunofluorescence images. Fluorescence intensities were determined in regions of interest using FIJI-ImageJ, and the number of migratory tumour cells in defined regions was quantified using the Analyze Particles function of FIJI-ImageJ after thresholding and conversion to binary images. The directionality of cell movement was calculated by evaluating the ratio of the shortest distance between the start and end points of a cell’s trajectory to the total distance it travelled. This metric provides a measure of how directly the cell moved towards its destination, with values ranging from 0 to 1, where a straightness value close to 1 indicates highly linear movement (straight path) and a value closer to 0 suggests a more meandering or random movement pattern. Collagen measurement was conducted using CT-FIRE software (version 2.0 beta).
JP-153 administration to miceJP-153 was synthesized in the laboratory of Dr Rates. JP-153 (5 mg kg−1) was loaded into a topical microemulsion for in vivo administration. In brief, a microemulsion system was prepared daily by dissolving 2 mg of JP-153 in 10 μl dimethyl sulfoxide (DMSO; #D5879, Sigma) from which 7.5 μl of the JP-153 stock was mixed with 63 μl of Capriol 90 (#3254, Gattefossé), 63 μl of triacetin (#W200700, Sigma) (10.5% final volume concentration) and 147 μl of Tween-20. The mixture was brought to volume (600 μl) by dropwise addition of dH2O (~172 μl) with frequent gentle mixing by vortex. Before JP-153 topical application, mice were shaved behind the neck (0.5 cm2). Mice were dosed under mild isoflurane anaesthesia followed by the application of 50 μl of formulated JP-153 to the shaved area.
Assessment of fibrosis by histological analysesThe extent of fibrosis was assessed by haematoxylin and eosin (H&E), picrosirius red and Masson’s trichrome staining, according to our standard protocols21.
Hydroxyproline assayCollagen content in mouse tissues was measured using hydroxyproline assay, according to our standard protocols21.
Mouse BAL recoveryTo obtain BAL samples, mouse lungs were lavaged with six 0.5-ml aliquots of PBS. BAL samples were centrifuged at 3,000g for 20 min at 4 °C and transferred the supernatants to siliconized low-binding Eppendorf tubes (PGC Scientifics) for subsequent analysis.
Vascular leak assayTotal protein concentration in BAL samples was determined using a commercially available bicinchoninic acid (BCA) Protein Assay Kit (Pierce) per the manufacturer’s protocol.
Determination of mouse TGF-β1 levels in BALTGF-β1 levels in mouse BAL fluids were determined by ELISA (R&D Systems, cat. no. DB100B) according to the manufacturer’s protocol.
Multiplex flow cytometrySingle-cell suspensions were isolated from mouse lung tissues biopsies using Liberase Blendzyme (final concentration, 0.14 U ml−1; Roche) and deoxyribonuclease I (final concentration, 60 mg ml−1; Sigma) for 45 min at 37 °C. Cells were incubated with FcRII and FcRIII blocking antibody (BioLegend, clone 93) for 10 min at 4 °C followed by staining with the following fluorophore-conjugated antibody from BioLegend: Viability eF780 (1:1,000), CD11b-BUV737 (1:100), Ly6G-FITC (1:200), Ly6C-PerCP-Cy5.5 (1:200), CCR2-PE (1:50), CD11c-BV605 (1:200), MHCII-Pe-Cy7 (1:1,000), F4/80-PE (1:100), MerTK-APC (1:100), CD3-BUV395 (1:200), CD4-BV786 (1:200), CD8-FITC (1:200). Flow cytometry was performed using a BDLSRFortessa X-20 cell analyser, and FlowJo software was used for analysis.
Tumour burden and metastatic indexIVIS imaging of tumours in the pancreas, skin, livers and lungs was performed immediately after euthanizing the mice. Normalized metastatic tumour burden (metastatic index) was calculated by dividing the total amount of photon flux from liver and lungs of each animal by the photon flux of its primary tumour (pancreas or skin). Exposure conditions (time, aperture, stage position and binning) were kept identical for all measurements within each experiment, as previously described36.
Atomic force microscopyAFM was performed according to our standard techniques using Bio-Catalyst AFM (Bruker) and MFP-3D AFM (Asylum Research)21,30. In brief, force–indentation profiles were acquired from thin mouse lung, skin, kidney and pancreas tissue slices by performing microindentations at points separated by 5 μm spatially covering an 80 × 80 μm area. An sphere-tipped probe (Novascan) with a diameter of 5 μm and a nominal spring constant of ~60 pN nm−1 was used. The cantilever spring constant was further confirmed by the thermal fluctuation method. Force curves were performed, and indentation profiles were acquired at an indentation rate of 20 mm s−1 for a force of around 16 nN applied on the tissue. Elastic modulus (Young’s modulus) was estimated by fitting force curves with the Hertz contact model (Hertz 1881; Dimitriadis 2022) following E = 3/4((1 − ν2))/(R(1/2)δ(3/2))F, where R is the tip radius, δ is the sample indentation and ν is the Poisson’s ratio assumed at 0.4 for tissue. Resulting young modulus data were plotted in 3D stiffness maps using MATLAB.
Co-registration of fibroblasts and myofibroblasts with matrix stiffnessAreas of active fibrosis were identified by accumulation of GFP+ collagen-producing cells by fluorescence microscopy coupled to AFM mapping. To differentiate between fibroblasts and myofibroblasts, tissues were fixed after AFM mapping and stained with antibodies against GFP and α-SMA. Fibroblasts were identified as GFP+/α-SMA− positive cells, whereas myofibroblasts were identified as GFP+/α-SMA+ double-positive cells. Post-analysis focused on fibroblasts versus myofibroblast-matrix stiffness co-localization.
Fabrication of PA hydrogels with steep stiffness gradientsPhotolithography was used to bioengineer PA hydrogels with alternating stiff and soft stripes (‘zebraxis’), containing step stiffness gradients between them, as previously described55. First, master Si wafers (SU-8 2015) were patterned with 25-mm-long by 100-µm-wide by 20-µm-high cuboids spaced 200 µm apart using soft photolithography. Our photomask was designed in AutoCad (CAD/Art Services). A soft PA hydrogel (4 kPa, 20–22 µL) was initially photo-polymerized on top of a methacrylate-treated 18-mm coverslip using ultraviolet (UV) light (365 nm) for 5 min. IrgaCure (5%) was used as a photo-initiator. The soft gel was dehydrated for 1 h at 30 °C. A second PA solution (40 kPa, stiff hydrogel, 20–22 µl) was added on top of the soft hydrogel and photo-crosslinked for 5 min in the form of stripes by using our photomask placed between the UV light source and the coverslip with the hydrogels. This photomask limits the light to penetrate through the stiff hydrogel by blocking the light on a striped fashion. Ultimately, the photomask generates with crosslinked stiff stripes (100 µm) and unpolymerized stripes (200 µm). Lastly, the unpolymerized stripes were washed with PBS. The end product results in an intercalating stripes of soft and stiff hydrogels (zebraxis hydrogel). Many hydrogels were fabricated simultaneously from the same polymer solutions to limit batch-to-batch variability. Stiffness hydrogels were then activated with Sulfo-SANPAH (1 mg ml−1) and functionalized with fibronectin at 10 μg ml−1 (Sigma) on PBS for 4 h at 37 °C. Two hydrogels per batch were mechanically characterized by AFM and coating efficiency was measured by immunofluorescence, using our standard protocols. Designing another photomask, we also engineered an island of soft matrix (1 kPa) surrounded by alternating soft (1 kPa) and stiff (25 kPa) stripes to investigate durotaxis capacity of pancreatic cancer cells. The stiffness of these ‘gradient’ gels increases from 1 kPa to 25 kPa (mimicking the range of stiffness produced in vivo).
Durotaxis assay on steep stiffness gradientsCells were plated with a density of 10,000 cells per 20-mm hydrogel in serum-free medium on zebraxis hydrogels. Cells were equally distributed at 50% over soft versus stiff stripes at 4 h after plating (durotactic index of 1). Durotaxis was measured at 24 h by calculating the ratio of cells over stiff/soft stripes upon fixation and staining with 4′,6-diamidino-2-phenylindole (DAPI). Five images at 10× resolution were counted per hydrogel. Experiments were performed in triplicate.
Fabrication of hydrogels with shallow stiffness gradients using microfluidicsMicrofluidic fabrication was used to bioengineer PA hydrogels containing shallow stiffness gradients, as previously described22. In brief, the microfluidic channels were filled with polymer solutions consisting of 10% acrylamide and either 0.05% (low) or 0.5% (high) bis-acrylamide in deionized water using a syringe pump (KD Scientific) at 30 µl min−1 into the three inlets in this order: low–high–low. After the solutions split and recombined, the polymerization was initiated by turning on the UV transilluminator for 6 min located directly beneath the outlet portion of the microchannel.
Analysis of durotaxis by time lapseCells were plated with a density of 15,000 cell hydrogel in serum-free medium and imaged using time-lapse microscopy. Cells were imaged for 24 h at 5-min intervals with a 10× 0.3 numerical aperture Plan Fluor objective lens. Trajectories of 75 cells in the observation area of each image sequence were tracked manually using the National Institutes of Health (NIH) ImageJ Manual Tracking plug-in. Several values characterizing cell migration were computed from the trajectories by the software, such as forward migration indices, which express the directionality of migration. Experiments were performed in triplicate.
PA hydrogelsPA hydrogels were prepared as described previously21. In brief, 18-mm glass coverslips (Fisher Scientific) were treated with a 0.4% solution of 3-methacryloxypropyltrimethoxysilane (Sigma-Aldrich) in acetone for 20 min, rinsed once with fresh acetone and air dried. Solutions of variable ratios of acrylamide:bis-acrylamide (Bio-Rad) were prepared to fabricate hydrogels of 0.5 kPa (3:0.11 ratio) and 64 kPa (20:0.24 ratio). The hydrogels were functionalized by incubation for 30 min with 0.05 mg ml−1 sterile collagen type I (PureCol, Advanced BioMatrix) in PBS.
Generation of paxillin lentivirusesNon-replicative lentiviruses were produced by transient transfection of human embryonic kidney (HEK) 293T cells of paxillin constructs in combination with regulator of expression of virion proteins (REV), vesicular stomatitis virus glycoprotein (VSVG) and promyelocytic leukemia protein (PDML) (Addgene) using Lipofectamine 2000 (Invitrogen) with plasmids. Viral supernatants were collected 48 h after transfection and concentrated with Lenti-X Concentrator (Clontech). Cells were transduced with lentivirus for 6 h in 6 mg ml−1 polybrene, according to our standard laboratory protocols21.
Cell treatmentsJP-153 was first solubilized in DMSO and then diluted into serum-free culture medium on a final stock concentration of 10 mM (<0.01% (v/v) DMSO). The stock concentration was aliquoted and kept at −20 °C until further use. Cells were treated with different concentrations of JP-153 from 10 nM up to 10 µM on serum-free medium for 24 h before performing cell-based assays including chemotaxis, durotaxis, invasion and crystal violet. To assess myofibroblast activation induced by TGF-β1, cells were treated with JP-153 for 24 h and with TGF-β1 (5 ng ml−1) + JP-153 (100 nM) for another 24 h.
Proximity ligation assayFAK–-paxillin interactions were detected via PLA using the Duolink In Situ Red Starter Kit Mouse/Rabbit (Sigma), following the kit protocol. Primary antibody incubations were performed using a rabbit polyclonal FAK antibody, 1:100 (#3285S, Cell Signaling), and a mouse polyclonal paxillin antibody, 1:100 (#AF4259, R&D Systems). For quantification analysis, ImageJ software (NIH) was used.
Statistics and reproducibilitySample sizes were calculated by power analysis for fibrosis and cancer studies. In each experiment evaluating the effects of inhibition of FAK–paxillin by JP-153 on the extent of lung fibrosis produced in mice, n ≥ 8 mice per group were used to achieve statistical significance. Sample sizes were estimated on the basis of 80% power to detect a 50% reduction in the amount of fibrosis present in mice treated with JP-153 compared with WT control mice, accepting a type I error rate of 0.05. Animals were distributed into groups of equal body weight. No animals were excluded from the analysis. In each experiment evaluating the effects of inhibition of FAK–paxillin by JP-153 on the tumours and metastases produced in mice, we used a power calculation approach assuming we wanted to detect a minimum difference between groups of twofold in tumour growth at 3 weeks from initial injection. Assuming a coefficient of variation less than 45%, we decided to have a minimum of six mice per arm, which allowed us to detect twofold differences with a power of 80%, accepting a type I error rate of 0.05. Experimental data were analysed by unpaired Student’s t-test for differences between each of the experimental conditions, two-way analysis of variance (ANOVA) for overall condition effects, two-tailed Spearman rank for correlation, or nonlinear dose–response curve fitting for half-maximal effective concentration (EC50) calculation using GraphPad Prism 5.0 software. The P values obtained are indicated in the figures and figure legends when statistically significant. P < 0.05 was considered significantly different between groups. All data displayed a normal distribution. Data are reported as mean ± s.d.
Reporting summaryFurther information on research design is available in the Nature Portfolio Reporting Summary linked to this article.
Comments (0)