
Remember me
This research complied with all relevant ethical regulations and was approved and overseen by the following ethics review boards. Experiments performed in the ovarian cancer model and the liver cancer initiation model were approved by the Animal Welfare and Ethics Review Body (AWERB) at Imperial College London. The experiments conformed to UK Home Office regulations under the Animals (Scientific Procedures) Act 1986, including Amendment Regulations 2012, and adhered to the Animal Research: Reporting of in Vivo Experiments (ARRIVE) guidelines. Liver cancer initiation experiments to assess GPX4 levels were performed under project licence number PPL 70/09080. Ovarian cancer experiments were performed under the project licence number PP1321516. Prostate cancer and melanoma experiments in mice were conducted in the BIOS+ animal facility in Bellinzona under specific pathogen-free conditions, with approval from project licences 35293, 36369 and 37480. The hydrodynamic tail vein injection experiment with RSL3 was carried out according to German law and with the approval of the Regierungspräsidium Karlsruhe (approval no. G-213/20). In all the animal facilities, mice were maintained under a 12-h light–12-h dark cycle.
AntibodiesThe primary antibodies used for IF and western blotting are presented in Supplementary Table 6.
DrugsThe compounds used in this study are presented in Supplementary Table 7.
Alkynylated probes derived from senolytic chloroacetamidesA detailed description of the synthesis of alkynylated probes derived from senolytic chloroacetamides and the NMR spectra of the synthesized probes is provided in Supplementary Note 1.
Cell linesIMR90 (human, American Type Culture Collection (ATCC) CCL-186), SK-MEL-103 (ATCC, HTB-69), A549 (ATCC, CCL-185), MCF7 (ATCC, HTB-22) and PC3 (ATCC, CRL-1435) cells were obtained from the ATCC. ID8 Trp53−/− ovarian cancer cells (derived from C57BL/6 mouse) have been described before57. IMR90 ER:RAS cells were generated by retroviral infection of IMR90 cells and have been described elsewhere33. IMR90, SK-MEL-103, A549, MCF7 and IMR90 ER:RAS were cultured in Dulbecco’s modified Eagle’s medium (DMEM; Gibco, cat. no. 41965120) supplemented with 10% fetal bovine serum (FBS; Sigma, cat. no. F7524) and 1% antibiotic–antimycotic solution (Gibco, cat. no. 15240062). ID8 Trp53−/− was cultured in DMEM (high glucose, pyruvate; Gibco, cat. no. 11995-073) with 4% FBS (Sigma, cat. no. F7524), 1% Anti-Anti (Gibco, cat. no. 15240-062) and 1% Insulin-Transferrin-Selenium (Gibco, cat. no. 2506891). PC3 was cultured in Roswell Park Memorial Institute medium (Gibco, cat. no. 12004997) supplemented with 10% FBS and 1% antibiotic–antimycotic solution.
Growth assaysFor BrdU incorporation assays, the cells were incubated with 10 μM BrdU (Sigma, 858811) for 16–18 h and then fixed with 4% paraformaldehyde (PFA; Thermo Scientific, 033314.M1). BrdU incorporation was assessed by IF and high-content analysis microscopy. For crystal violet staining, the cells were seeded at a low density in six-well plates and fixed at the end of the treatment with 0.5% glutaraldehyde. The plates were then stained with 0.2% crystal violet.
Cytochemical SA-β-galactosidase assayCells were seeded in six-well plates, fixed with 0.5% glutaraldehyde (Sigma, G5882) in PBS for 15 min, washed with 1 mM MgCl2/PBS (pH 6.0) and then incubated with X-Gal staining solution (1 mg ml−1 of X-Gal (Thermo Scientific, 2737087), 5 mM K3(Fe(CN)6) and 5 mM K4(Fe(CN)6) for 6–8 h at 37 °C. Bright-field images were captured using the DP20 digital camera attached to the Olympus CKX41 inverted light microscope. The percentage of SA-β-galactosidase-positive cells was estimated by counting at least 100 cells per replicate sample, facilitated by the ‘point picker’ tool of ImageJ software (National Institutes of Health).
Fluorescence SA-β-galactosidase assay was performed in live cells, using C12FDG (Abcam, ab273642). Cells were cultured in a 96-well plate for 6 or 7 days to establish senescence response, as previously described (Supplementary Table 8). Once the senescence response was established, cells were treated with 100 nM Bafilomycin (Sigma, B1793) for 1 h in the incubator, followed by the addition of 30 μM C12FDG for 1 h in the incubator. Cells were fixed with 4% PFA and nuclei were counterstained with 4,6-diamidino-2-phenylindole (DAPI), as described above. Image acquisition and analysis were performed as previously described.
IF staining of cellsCells were seeded in 96-well plates (Nunc MicroWell, 167008) and cultured, as required. At the desired time point, cells were fixed with 4% PFA for 45 min, permeabilized with 0.2% Triton X-100 (Sigma, 11332481001) diluted in phosphate-buffered saline (PBS) for 10 min and blocked with 1% bovine serum albumin (Sigma, cat. no. A2153) for 1 h at room temperature. Cells were then incubated with a primary antibody for 1–2 h at room temperature, followed by the corresponding fluorophore-conjugated secondary antibody (Alexa Fluor) for 45 min and DAPI staining (1 μg ml−1 DAPI; Sigma, D9542) for 15 min at room temperature. For BrdU staining, the primary BrdU antibody was added together with 0.5 U μl−1 DNAse (Sigma, D5025) and 1 mM MgCl2 (Sigma, M8266) in the blocking solution and incubated for 30 min at room temperature. A complete list of primary and secondary antibodies used is presented in Supplementary Table 6. Antibodies were diluted in a blocking solution. After every step, cells were washed with PBS three times. All the antibodies used are presented in Supplementary Table 6.
Live intracellular fluorescence stainingsCellROX Orange Reagent, for oxidative stress detection (C10443, Invitrogen, Thermo Fisher Scientific), FerroOrange (F374, Dojindo), and BODIPY 581/591 C11 (D3861, Invitrogen, Thermo Fisher Scientific) were used according to the manufacturer’s instructions. In brief, plated cells were incubated for 30 min at 37 °C, 5% CO2 in the staining solution (HBSS containing 1 μg ml−1 Hoechst 33342 (62247, Invitrogen, Thermo Fisher Scientific) and either 5 μM CellROXTM, 1 μM FerroOrange or 1 μM BODIPY 581/591 C11). Images were acquired extemporaneously using the IN Cell 2500 Analyzer high-throughput microscope (GE Healthcare) with a 40× objective and nine fields at least per well. Staining quantification was performed using IN Carta v1.17.0412545 software (Molecular Devices).
High-throughput microscopy and quantitative analysisImages of wells from 96-well plates were acquired using the IN Cell Analyser 2500HS high-throughput microscope and plate reader (Cytiva). For images of only DAPI (cell count), images of wells were captured at a 10× objective. For all IF stainings, wells were imaged with a 20× objective except BrdU staining (imaged using a 10× objective). Fluorescence images of fluorophores were captured on the basis of the preset wavelength settings for ‘DAPI’ (for DAPI staining), ‘Red’ (for Alexa Fluor 594) and ‘Green’ (for Alexa Fluor 488) on the IN Cell microscope. High content analysis (HCA) of acquired images was performed using the IN Cell Investigator 2.7.3 software (GE Healthcare) or IN Carta v1.17.0412545 software (Molecular Devices). DAPI nuclear staining was used as a nuclear mask to quantify cells and allow the segmentation of cells on the basis of a Top-Hat method, according to the software guidelines. This method also allowed the detection of nuclear-localized antibody staining. Nuclear stainings were quantified by the average pixel intensity within the nuclear mask. Cytoplasmic staining was quantified after applying a collar of 6–9 μm around the DAPI mask. Cytoplasmic-localized staining was quantified either by the average pixel intensity or by measuring the coefficient of variance of pixel intensity within the cell collar. Detection of percentage positive cells was based on a threshold, typically set according to the average pixel intensity of an internal negative control or an unstained secondary antibody-only control sample, unless specified.
Iron quantification by inductively coupled plasma–triple quadrupole mass spectrometerSK-MEL-103 and IMR90 cells were cultured in 15-cm dishes, and senescence was induced for 6 days with etoposide and tozasertib (SK-MEL-103) or etoposide (IMR90) treatment (density and drug concentration are indicated in Supplementary Table 8). At day 6, cells were washed in PBS (Gibco, 10010-023), collected in PBS and centrifuged for 5 min at 4 °C. Then the pellet was dried and frozen at −80 °C.
Sample preparationSamples were allowed to fully thaw at room temperature. The cell pellets were digested using 0.075 ml trace-metal-grade concentrated NHO3 (69% w/w, respectively; Fisher Scientific TraceMetal Grade acid), which was added straight into the Eppendorf tubes provided. The sample was very lightly vortexed. Samples were digested in an oven at 60 °C for 1 h. The samples were allowed to cool, and 0.0375 ml TraceMetal Grade hydrogen peroxide (30% w/w, Merck) was added. The samples were digested further at 60 °C for 1 h in an oven. Samples were allowed to cool, and 1.375 ml purified water with a resistivity ≥18.2 MΩ cm from a Milli-Q system (Merck Millipore) was added to make up to a final volume of 1.5 ml.
Preparation of PBSTrace-metal-grade 15-ml tubes were labelled, and 0.1 ml of the PBS was aliquoted. The sample was digested in an oven at 60 °C using 0.1 ml trace-metal-grade concentrated HNO3 (69% w/w, respectively; Fisher Scientific TraceMetal Grade acid). The sample was cooled, and 0.05 m TraceMetal Grade hydrogen peroxide (30% w/w, Merck) was added. The samples were digested further at 60 °C for 1 h in an oven. Samples were allowed to cool, and 1.75 ml purified water with a resistivity ≥18.2 MΩ cm from a Milli-Q system (Merck Millipore) was added to make up to a final volume of 2 ml.
MeasurementsAll measurements were conducted on a PerkinElmer NexION 5000 inductively coupled plasma–triple quadrupole mass spectrometer under dynamic reaction cell (DRC) mode at the London Metallomics Facility, King’s College London. The introduction system to the instrument was a PerkinElmer S23 autosampler coupled to a SeaSpray glass nebulizer fitted to a quartz cyclonic spray chamber. Argon plasma flow and nebulizer gas flow rates were 18 l min−1 and 0.98 l min−1, respectively. Samples were introduced to the system together with a carrier solution containing 0.785 M HNO3 and 50 µg l−1 Ga (internal standard). Quality control of inductively coupled plasma–triple quadrupole mass spectrometer measurements was ensured through a combination of repeat measurements of:
Acid blanks
A quality control standard made from 1,000 mg l−1 High-Purity Standards multi-element standard solutions
A tenfold dilution of the CRM-TMDW (trace metal drinking water) from High-Purity Standards
Analyte measurements were normalized to the internal standard Iridium (193Ir) to account for instrument drift and matrix effects, and measurements were subsequently blank corrected by removing the average analyte intensity of repeat blank measurements. The corrected analyte intensity was converted to concentration measurements using the linear equation generated by the calibration curve of the standards.
Iron measurement using the Iron Assay KitFor total iron measurement, the Iron Assay Kit (Sigma-Aldrich, MAK472) was used, according to the manufacturer’s instructions.
Measurement of intracellular glutathione levelsSK-MEL-103 and IMR90 cells were plated in 96-well plates, and senescence was induced for 6 days (cell density and senescence induction are presented in Supplementary Table 8). At day 6, cells were treated with BSO for 16 h, and then RSL3 or SCLA2 were added for 4 h. After 4 h, glutathione levels are measured using the GSH-Glo Glutathione Assay (Promega, V6911) according to the manufacturer’s instructions.
Transfection of siRNAs and senolytic screenDruggable genome siRNA libraries were purchased from Horizon Discovery (human siGENOME SMARTpool). Custom-designed siRNA library plates and individual siRNAs were obtained from the siGenome Human siRNA catalogue (Dharmacon, Horizon Discovery). All plates were supplied lyophilized and coated onto 96-well plates (0.1 nM) or in a tube (for individual siRNA orders). The siRNA 96-well plates (0.1 nM) were reconstituted in 100 μL nuclease-free water and aliquoted in round-bottom 96-well (Nunc, 163320) daughter plates for storage at −20 °C. For siRNA transfection, 3.6 μl of aliquoted siRNA was dispensed to flat-bottom 96-well plates (Nunc MicroWell, 167008). A ‘transfection mix’ was prepared with 17.2 μl plain DMEM (Gibco) and 0.4 μl DharmaFECT 1 transfection reagent (Horizon Discovery, T-2005-01) per well. A total of 17.6 μl of the transfection mix was added to each well already containing 3.6 μl siRNA (or 3.6 μl water for mock controls), and the mixture was incubated at room temperature for 30 min. For senolytic siRNA screening, SK-MEL-103 cells were first plated in 10-cm dishes (Supplementary Table 9). The following day, cells were treated with DMSO or etoposide for 6 days to generate proliferating and senescent cells. On day 6, cells were counted, and 100 μl cell suspension (in DMEM media supplemented with only 10% FBS but no antibiotics) was added to the 96-well plates (containing siRNA and transfection mix) at the appropriate seeding density (12k for DMSO and 15k for etoposide-treated cells). This resulted in a final siRNA concentration of 30 nM. Plates were incubated at 37 °C, 5% CO2, for 18 h to allow reverse transfection and cell attachment (day −1). After this period, the transfection media were discarded and replaced with fresh DMEM medium supplemented with 0.5% FBS and 1% antibiotic–antimycotic solution (day 0). A total of 3 or 5 days later, cells were fixed in 4% PFA for 45 min and then stained with DAPI, as described above. Cells were acquired with an InCell 2500 Analyser high-throughput microscope (GE Healthcare), as previously described. All the siRNAs used in the screen are presented in Supplementary Table 9.
cDNA generation and RT–qPCRcDNA was generated using random hexamers and SuperScript II reverse transcriptase (Invitrogen, 18064-014), according to the manufacturer’s protocol. Quantitative real-time PCR (RT–qPCR) was performed using SYBR Green PCR master mix (Applied Biosystems, 4309155) with QuantStudio 7 Flex (Applied Biosystems). The primers used for RT–qPCR are presented in Supplementary Table 10. The delta–delta Ct method (2−∆∆Ct) was applied to the resulting Ct values obtained during the amplification phase to calculate relative mRNA expression levels. GAPDH (human or mouse) and HPRT1 (human) were used as the housekeeping control for normalization, and an untreated sample was used as an internal relative control (DMSO). The 2−∆∆Ct method calculation is as follows:
$$\Delta \Delta \text=\Delta }_}}-\frac}_}}}=}_}}-}_}}.$$
The primers used are presented in Supplementary Table 10.
siRNA knockdown validation by qRT–PCRFor siRNA knockdown validation by qRT–PCR, senescent and non-senescent SK-MEL-103 cells were generated as described before. At day 6, the transfection mix was prepared by mixing 72 μl of selected siRNAs (1 μM) with 344 μl plain DMEM and 8 μl DharmaFECT 1 per well (a six-well plate was used; Corning, 3506). After 30 min incubation, cells were added (500,000 for DMSO and 800,000 for etoposide-treated cells) in DMEM media supplemented with only 10% FBS (no antibiotics). Plates were incubated at 37 °C, 5% CO2, for 18 h to allow reverse transfection and cell attachment (day −1). After this period, the transfection media were discarded and replaced with fresh DMEM medium supplemented with 0.5% FBS and 1% antibiotic–antimycotic solution. A total of 48 h after transfection, cells were collected and RNA was extracted using the RNeasy Mini Kit (Qiagen, 74106), according to the manufacturer’s instructions.
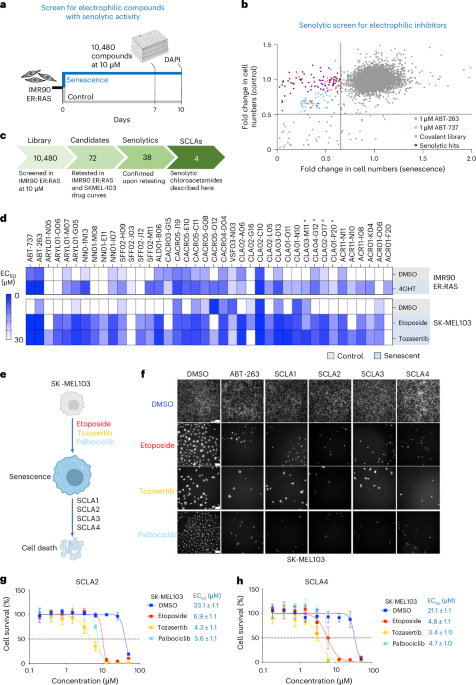
Drug screen to determine senolytic activity of electrophilic compoundsWe screened 10,480 electrophilic compounds from the covalent screening library (CSL-10480-10-Y-10, Enamine). The primary screen was performed in IMR90 ER:RAS, a model of OIS. IMR90 ER:RAS was seeded in a 96-well plate at the density presented in Supplementary Table 8. Senescence was induced with 100 nM 4-OHT for 7 days, while non-senescent cell controls were obtained by treating cells with DMSO. At that point, compounds were added at a final concentration of 10 μM, diluted in DMEM with 0.5% FBS. After 72 h, cells were fixed in 4% PFA for 45 min and then stained with DAPI for 15 min. Cells were imaged with an InCell 2500 Analyser high-throughput microscope (GE Healthcare) as previously described. A compound was classified as senolytic if it exhibited at least a 20% greater cytotoxicity in senescent cells compared with non-senescent cells.
Retesting of senolytic compounds in SK-MEL-103 cellsSK-MEL-103 cells were used to assess the senolytic activity of the hits discovered in the primary screening. Senescence was induced with etoposide or tozasertib treatment (Supplementary Table 8). After 6 days of senescence induction, electrophilic compounds were added at different concentrations, diluted in DMEM with 0.5% FBS. After 48 h, cells were fixed with 4% PFA for 45 min and then stained with DAPI for 15 min. Cells were acquired with an InCell 2500 Analyser high-throughput microscope (GE Healthcare), as previously described.
Drug screen in SK-MEL-103 with selected electrophilic compounds in combination with cell death inhibitorsSelected electrophilic compounds were tested in SK-MEL-103 cells in the presence of apoptosis or ferroptosis inhibitors (emricasan and liproxstatin 1, respectively). Senescence was induced with etoposide for 6 days (Supplementary Table 8). At this point, compounds were added at 5 μM, either alone or in combination with emricasan (25 μM) or liproxstatin 1 (1 μM). All senolytic compounds were diluted in DMEM with 0.5% FBS. After 48 h, cells were fixed with 4% PFA for 45 min and then stained with DAPI for 15 min. Cells were imaged using an InCell 2500 Analyser high-throughput microscope (GE Healthcare), as previously described.
Sample preparation for ABPPSK-MEL-103 cells were seeded in 10-cm dishes as presented in Supplementary Table 8 and treated with etoposide, tozasertib or DMSO for 6 days. On day 6, cells were treated with DMSO or the corresponding SCLA for 2 h, followed by the indicated alkyne-modified probes for 2 h, washed with ice-cold PBS three times, cell pellets collected by scraping and stored at −80 °C until further processing. See Supplementary Table 3 for the respective compound concentrations for each probe set.
Pellets were thawed on ice for 1 h and lysed in 200 μl 1% SDS in PBS supplemented with 1× protease inhibitors (cOmplete, EDTA-free Protease Inhibitor Cocktail, Roche, 11836153001) and shaken for 30 min at room temperature with 1:1,000 v/v benzonase nuclease (Sigma, E1014). Protein concentration was measured by DC Protein Assay (Bio-Rad, 5000111) and normalized to 1.5 mg ml−1, with 100 µg protein taken forward. Click reaction mixture was prepared by sequential addition of 1 volume 10 mM azide-PEG3-biotin (Sigma, 762024), 2 volumes 50 mM CuSO4 (Sigma, C8027), 2 volumes 50 mM TCEP (Sigma, 68957) and 1 volume 10 mM TBTA (Sigma, 678937). A final volume of 6 µl click reaction mixture was added per 100 µl lysate and shaken for 1 h at room temperature before quenching with 5 mM EDTA. Proteins were then precipitated by the addition of the total sample volume to 4× volume liquid chromatography–mass spectrometry (LC–MS)-grade acetonitrile, as per the SP4 protocol63, followed by gentle shaking for 5 min and centrifugation at 3,220g for 10 min. The subsequent pellet was washed with 80% LC–MS-grade ethanol in water and centrifuged at 3,220g for 2 min for a total of four washes. The remaining pellet was allowed to dry for 5 min and resuspended in 10 µl 10% SDS, followed by sequential dilution to 25, 50 and 100 µl final volume with 50 mM HEPES (pH 8). Samples were centrifuged at 3,220g for 2 min to check that no insoluble material remained.
Before biotin–streptavidin pulldown, magnetic streptavidin beads (Thermo Fisher Scientific, 88817) were washed three times in 0.2% SDS in 50 mM HEPES. In total, 10 µl washed beads were then added to each resuspended pellet and shaken at room temperature for 2 h to form the biotin–streptavidin interaction.
For western blot-based competitive ABPP with RSL3-alkyne or SCLA2a samples were washed in 500-µl solutions of: 1x 500 µl 1% SDS in 50 mM HEPES and 2x 500 µl 0.2% SDS in 50 mM HEPES. Washed beads were eluted in 20 μl 0.2% SDS in 50 mM HEPES with 4× Laemmli sample buffer (Bio-Rad, 1610747) and boiled at 95 °C for western blot analysis.
For MS-based analysis, subsequent wash steps were performed on a Kingfisher Flex equipped with a 96-well Deep Well head. Beads were sequentially washed in 500-µl solutions of: 1x 1% SDS in 50 mM HEPES, 1x 500 µl 0.2% SDS in 50 mM HEPES, 1x 500 µl 0.2% SDS, 40 mM CAA, 10 mM TCEP in 50 mM HEPES (10-min incubation with agitation) and finally 2x 500 µl 50 mM HEPES. Washed beads were finally deposited in 100 µl 50 mM HEPES. In total, 200 ng trypsin (Promega, Sequencing-Grade Trypsin, V5111) was added to each sample and shaken overnight at 37 °C. Peptide digests were acidified to pH 2–3 with LC–MS-grade formic acid (FA; Fisher, 10780320) and stored until LC–tandem MS (MS/MS) analysis. For Evotip loading, any remaining beads were removed by plate-based filtration (Merck, 10448023), and half the filtered digest volume was loaded on Evotips according to the manufacturer’s instructions.
Total proteomics in SK-MEL-103 cells undergoing senescence and treated with SCLA2/2a/2bSK-MEL-103 cells grown in six-well plates were treated with either etoposide or tozasertib to induce senescence or DMSO as a control for 6 days (Supplementary Table 8). On day 6, cells were treated with SCLA2, SCLA2a, SCLA2b or DMSO as indicated for 2 h at the concentrations presented in Supplementary Table 3. Cells were then lysed in 80 µl surfactant cocktail data64 with 4 µl benzonase added to each plate at 5 U µl−1 (diluted 1:50 from 250 U µl−1 stock) right before lysis, to prevent benzonase inactivation by the lysis buffer. Samples were transferred to a 96-well plate and frozen at −80 °C. Samples were thawed at 60 °C in a thermomixer and mixed using a Gilson Platemaster. Protein concentrations were measured with the BCA assay and adjusted to 2 µg µl− in 40 µl with the Andrew Plus pipetting robot from Waters. Sample preparation was performed in Brand PCR 96-well plates. For reduction and alkylation, 20 µl of each sample corresponding to 40 µg of protein was mixed with 20 µl of a solution of 40 mM CAA–20 mM TCEP and incubated at 37 °C for 30 min. Proteins were precipitated with 160 µg of Hydroxyl beads (MR-HYX010) using the Protein Aggregation Capture (PAC) method, with precipitation carried out in 60% ethanol and three washes in 80% ethanol65. Samples were digested overnight at 37 °C in 50 µl of 50 mM ammonium bicarbonate, shaking the plate at 1,650 rpm with trypsin and LysC at a 1:50 and 1:100 ratio, respectively. This experiment is shown in Fig. 5b and Extended Data Figs. 4d and 6e.
Data acquisition for ABPPPeptides were analysed by LC–MS/MS using an Evosep One (Evosep) coupled with a timsTOF HT (Bruker) equipped with either an 8 cm × 150 µm, 1.5 µm analytical column (Evosep, 60SPD, ABPP samples) or a 15 cm × 150 µm, 1.9 µm analytical column (Evosep, 30SPD, SK-MEL-103 total proteome samples). Peptides were separated by the Evosep 30/60SPD workflow (analytical solvents A: 0.1% FA and B: acetonitrile plus 0.1% FA). The column was held at 40 °C. Data were acquired in data-independent acquisition PASEF mode with the following settings: m/z range from 100 m/z to 1,700 m/z, ion mobility range from 1/K0 = 1.30–0.85 V s cm−2 using equal ion accumulation and ramp times in the dual TIMS analyser of 100 ms each. Each cycle consisted of eight PASEF ramps covering 21 mass steps each with 25-Da windows, each with 2/3 non-overlapping ion mobility windows covering the 475–1,000 m/z range and 0.85–1.26 V s cm−2 ion mobility range. The collision energy was lowered as a function of increasing ion mobility from 59 eV at 1/K0 = 1.6 V s cm−2 to 20 eV at 1/K0 = 0.6 V s cm−2.
Data acquisition for total proteomics in SK-MEL-103 cells treated with SCLA2/2a/2bFor each sample, 2 µg digest was analysed. Chromatographic separation was performed using an Ultimate 3000 RSLC nano LC system (Thermo Scientific) coupled to a Q Exactive HF-X MS (Thermo Scientific) via an EASY-Spray source. Electrospray nebulization was achieved by interfacing to Bruker PepSep emitters (part no. PSFSELJ20, 20 µm). Peptide solutions were injected directly onto the analytical column (self-packed column, CSH C18 1.7 µm beads, 300 μm × 30 cm) at a working flow rate of 5 μL min−1 for 4 min. Peptides were then separated using a 60-min stepped gradient: 0–45% of buffer B for 70 min (buffer A: 95%/5%: H2O/DMSO + 0.1% FA; buffer B: 75%/20%/5% MeCN/H2O/DMSO + 0.1% FA), followed by column conditioning and equilibration. Eluted peptides were analysed by the MS in positive polarity using a data-independent acquisition mode as follows: an initial MS1 scan was carried out at 140,000 resolution with an automatic gain control target of 3 × 10⁶ for a maximum injection time of 200 ms, m/z range: 410–1,600. This was followed by 30 30k-resolution MS2 scans covering 410–1,600 with variable window sizes66. The automatic gain control target was set to 3 × 10⁶ with maximum injection time on auto. Normalized collision energy was set to 27%. Total run acquisition time was 70 min.
Data processing and downstream analysis for ABPP in SK-MEL-103 senescenceRaw.d files were searched in Spectronaut 19 in directDIA mode against the canonical UniProt human FASTA (downloaded 20240122, 20,596 entries) according to default modifications and settings with the following amendments: no cross-run normalization or imputation was applied, and protein inference was set to ‘all matching proteins’.
Downstream data analysis was performed in R (4.5.1, 2025-06-13). For ABPP analyses only, outlier samples (based on low precursor identifications or clustering by principle coordinate analysis) were removed, leaving a minimum of 3/4 samples per condition. Contaminant proteins67 and protein groups detected in <3 replicates per condition were removed. Protein group quantities were then log2transformed and median normalized per sample. Differential abundance testing was performed by Welch’s t-test (n = 3/4, as implemented in the protti R package68). Further data analysis and visualization were performed with tidyverse69, ggplot70 and ComplexHeatmap71 packages.
Data processing and downstream analysis for total proteomics in SK-MEL-103 cells treated with SCLA2/2a/2bData were processed using the Spectronaut software platform (Biognosys, 19.9.250324.62635) in directDIA mode. A Pulsar Search was conducted with a missed cleavage rate set to 3. Cys carbamidomethylation was applied as a fixed modification, while variable modifications included Met oxidation, Gln deamidation, protein N-terminal acetylation and the cyclization of glutamine to pyroglutamate. Identification of peptide spectrum matches, peptides and protein groups was performed with a false discovery rate (FDR) of 0.01. Searches were carried out against the UniProt Homo sapiens database, containing one gene per protein sequence (downloaded on 8 January 2025, consisting of 20,650 entries), and a universal protein contaminants database (downloaded on 13 January 2025, containing 381 entries).
For the data-independent acquisition analysis, a mutated decoy database approach was used, with a protein q-value cut-off for the experiment set at 0.01 at the identification level. The quantification method was configured as follows: MS2-based quantification with a proteotypicity filter set to ‘only proteotypic,’ and the label-free quantification method set to MaxLFQ. No value imputation was used.
Before further analysis, protein tables were filtered to remove entries from the protein contaminants database67. The Uniprot ID mapping service (https://www.uniprot.org/id-mapping) was used to retrieve protein metadata, for example, Gene Ontology (GO) terms GOMF, GOCC and GOBP, against a list of protein accession IDs. Metadata were then merged into the main protein table. Further analysis was carried out in the Perseus72 platform (v2.1.3.0). Local normalized protein intensity was log2transformed before additional filtering and statistical testing. For two-group comparisons, intensities were filtered for proteins with ≥3 replicate intensities per experimental group, and Welch’s t-test was carried out (multiple testing correction: permutation-based FDR, threshold, 0.05). The t-test results were visualized as volcano plots, with significance defined by P value.
RNA isolation and purification from tumour tissuesTumours were homogenized mechanically with pestles (Corning, PES-15-B-SI) in 500 μl TRIzol (Ambion, Life Technologies, 15596026). Next, 100 μl chloroform (Sigma, 319988) was added, and the samples were centrifuged at 12,000 rpm for 30 min. The transparent phase was collected and mixed with an equal volume of 70% ethanol. The samples were then moved to the RNAeasy Mini Kit column, and the RNA was extracted according to the manufacturer’s protocol.
RNA isolation and purificationFor total RNA isolation, cells were seeded in six-well plates. Cells were dissociated using trypsin, washed with PBS and lysed. Total RNA from the cell pellet was isolated and purified using the RNeasy Mini Kit (Qiagen, 74106), according to the manufacturer’s instructions. RNA was eluted in 30–50 μl RNAse-free water, and concentration was measured using a Nanodrop ND-1000 UV-Vis spectrophotometer. RNA samples were stored at −80 °C for long-term preservation.
RNA sequencing and analysisTotal RNA was extracted using the RNeasy Mini kit (Qiagen) following the manufacturer’s protocol. RNA sequencing was performed by the MRC LMS Genomics core facility. Library preparation was performed using the NEBNext Ultra II Directional RNA library prep kit with the NEBNext PolyA Enrichment module using the NextSeq 2000 instrument model (single end 72 base pairs (bp) + dual 8 bp indexing). RNA sequencing data were aligned using STAR. For analysis of the RNA sequence of the PC3 xenograft tumour model, sequencing reads were mapped separately to human (GRCh38) and mouse (GRCm37) genomes using the STAR aligner (version 2.7.11a)73. R-package XenofilteR74 was then used to separate mouse reads from human sequence reads. Gene-based counting was performed on the human reads using the featureCount function from the Rsubread package75. Differential expression analysis was performed using the DESeq2 Bioconductor package (DESeq2_1.48.2)76 in R. A List of differentially expressed genes was obtained along with log2 fold change over the control group with an adjusted P value for each gene. For GSEA, differentially expressed genes were ranked according to their expression using the preranked function on GSEA v4.0.3 (Broad Institute). Significant enrichment of gene sets was considered if the normalized enrichment score (NES) was >1.0, with an FDR lower than 0.25 (ref. 77). Gene sets used were obtained from built-in ‘Gene Ontology’ or ‘curated’ databases v7.5 (Broad Institute) or described previously78. Cluster and pathway analyses were performed using ClusterProfiler on R.
Western blotCells were lysed in 1× RIPA buffer (Thermo Scientific, 89900) supplemented with cOmplete mini EDTA-free protease inhibitor tablets (Roche, 04693159001) and PhosSTOP phosphatase inhibitor tablets (Roche, 04906837001) and incubated on ice for 10 min. Lysates were centrifuged at 14,000 rpm for 15 min, and protein concentration was determined using the BCA kit (Thermo Fisher, 23227). Equal amounts of protein were loaded on SDS–polyacrylamide gel electrophoresis (SDS–PAGE), using Mini-PROTEAN TGX gels (Bio-Rad, 4561096) and transferred to a 0.2-mm nitrocellulose membrane (Bio-Rad, 1620112). After protein transfer, membranes were blocked in 5% milk solution and incubated overnight at 4 °C with the indicated primary antibodies. Membranes were then probed with horseradish peroxidase-conjugated secondary antibodies antirabbit IgG (Abcam, A16035, 1:5,000) or antimouse IgG (Abcam, A16011, 1:5,000) and developed using enhanced chemiluminescence substrate (Bio-Rad, 170-5060). Membranes were exposed to the Amersham imageQuant 800 imaging system (Cytiva). Blots were semiquantitatively analysed by densitometry using ImageJ 2.9/1.53t (National Institutes of Health). A list of the antibodies used in this study is presented in Supplementary Table 6.
HDTVIHydrodynamic tail vein injection (HDTVI) was performed to deliver transposon-based vectors as previously described with minor modifications53. For assessing GPX4 expression, we used samples derived from female C57BL/6J (Charles River Laboratories UK, RRID: IMSR_JAX:000664) mice transduced at 5–6 weeks of age. For the RSL3 treatment experiment, HDTVI was carried out in 8-week-old C57BL6/J male mice. Plasmid DNA was prepared using the Qiagen Plasmid Maxi Kit or GenElute HP Endotoxin-Free Maxiprep kit (Sigma) according to the manufacturer’s instructions. On day 0, 25 µg NrasG12V plasmid and 5 µg Sleeping Beauty transposase expression vector were diluted in sterile normal saline to a final volume of 2 ml (~10% of body weight). The solution was then injected into the lateral tail vein within 10 s. For the RSL3 experiment, starting from day 5, the mice then received daily i.p. injection of RSL3 (10 mg kg−1) or vehicle for five consecutive days. Livers were collected 10 days after HDTVI. RSL3 (MedChemExpress, HY-100218A) was dissolved in 10% DMSO and 90% 20% SBE-ß-CD in saline and was administered i.p.
ID8 Trp53 −/− model of ovarian cancerFor the ovarian cancer experiments, C57BL/6J female mice (6–7 weeks old) were purchased from Charles River Laboratories UK (RRID: IMSR_JAX:000664) and allowed to acclimatize for at least 1 week before any regulated procedures were performed. Each mouse received an i.p. injection of 5 × 10⁶ ID8 Trp53−/− cells suspended in sterile and filtered PBS (Thermo Fisher Scientific, J61196-AP). After 21 days, mice were randomized into four different experimental treatment groups: vehicle, cisplatin (4 mg kg−1 once per week for 1 week), RSL3 (50 mg kg−1, two times per week for 2 weeks) and cisplatin in combination with RSL3. All treatments were administered via i.p. injection. At the defined end point, omental tumours were collected. Cisplatin was dissolved in PBS. RSL3 (MedChemExpress, HY-100218A) was dissolved in 10% DMSO, 40% PEG300, 5% Tween-80 and 45% saline. For the survival experiment, mice were checked daily and were culled when they showed visible distress symptoms such as weight loss of 10% or more, ascites equivalent to full-term pregnancy, reduced or slow activity, pale feet, hunching, piloerection, closed eyes and isolation from cage mates.
PC3 model of prostate cancerFor the prostate cancer experiments, 12-week-old NRG male mice were used. Each mouse received an s.c. injection of 2.5 × 10⁶ PC3 cells suspended in sterile and filtered PBS. When the tumours reached a volume of approximately 100 mm3, mice were randomized into two treatment groups: vehicle and palbociclib (200 mg kg−1 three times per week). Once the tumour became arrested in the palbociclib-treated group, mice were further randomized to receive either RSL3 (50 mg kg−1, two times per week for 2 weeks) or the vehicle, resulting in four experimental groups: vehicle, RSL3, palbociclib and palbociclib + RSL3. Mice were culled when the tumours in the vehicle groups reached a volume of 1,500 mm3, and tumours were collected. Palbociclib (monohydrochloride; MedChemExpress, HY-50767A) was dissolved in 10% DMSO, 40% PEG300, 5% Tween-80 and 45% saline and administered via oral gavage. RSL3 (MedChemExpress, HY-100218A) was dissolved in 10% DMSO, 40% PEG300, 5% Tween-80 and 45% saline and administered i.p. Vehicle-treated mice received 10% DMSO, 40% PEG300, 5% Tween-80 and 45% saline.
SK-MEL-103 model of melanomaFor the melanoma experiments, 12-week-old NRG female mice were used. Each mouse received an s.c. injection of 1 × 10⁶ SK-MEL-103 cells suspended in 100 μl sterile PBS/Matrigel. When the tumours reached a volume of approximately 50 mm3, mice were randomized into two treatment groups: vehicle and palbociclib (100 mg kg−1 five times per week). Once the tumour became arrested in the palbociclib-treated group, mice were further randomized to receive either RSL3 (50 mg kg−1, five times per week for 2 weeks) or the vehicle, resulting in four experimental groups: vehicle, RSL3, palbociclib and palbociclib + RSL3. Palbociclib treatment was kept during RSL3 administration. Mice were culled when the tumours reached a volume of 1,500 mm3, and tumours were collected. Palbociclib (monohydrochloride; MedChemExpress, HY-50767A) was dissolved in 10% DMSO, 40% PEG300, 5% Tween-80 and 45% saline and administered via oral gavage. RSL3 (MedChemExpress, HY-100218A) was dissolved in 10% DMSO, 40% PEG300, 5% Tween-80 and 45% saline and administered i.p. Vehicle-treated mice received 10% DMSO, 40% PEG300, 5% Tween-80 and 45% saline.
IF and IHC staining of tissue sectionsTumour tissue sections were deparaffinized in Histo-Clear (Scientific Laboratory Supplies) for 5 min, rehydrated through a series of decreasing ethanol concentrations, followed by a final 5 min wash in distilled water (dH2O). Heat-induced epitope retrieval (HIER) was performed in a pressure cooker for 20 min using either citrate-based buffer at pH 6.0 (VectorLab, H-3300-250) or tris-based buffer at pH 9.0 (VectorLab, H-3301-250), according to the antibody manufacturer’s instructions. For intracellular antigen staining, sections were permeabilized with 0.2% Triton X-100 in PBS for 10 min and washed in PBS for 5 min. Slides were then incubated in BLOXALL blocking solution (VectorLab, SP-6000) for 15 min, washed in PBS and blocked with Animal-Serum Free serum (Cell Signaling, 15019L) diluted in dH2O for 45 min. Tissue samples were incubated overnight with the primary antibody previously diluted in antibody diluent (Agilent Technologies, S080983-2). Sections were washed in PBS three times for 5 min each and were incubated with secondary antibody for 45 min.
IFFor double staining, samples were incubated in 0.02 N HCl for 20 min following the first antibody signal amplification. Sections were washed in PBS for 5 min, and peroxidase blocking was reapplied for 15 min. Animal-serum-free blocking solution (Cell Signaling Technology, 15019L) diluted in H20 was applied for 1 h, followed by incubation with the second primary antibody overnight. After three 5-min washes in PBS, sections were incubated with the corresponding secondary antibody for 45 min. Tyramide signal amplification was performed using SuperBoost kit (Invitrogen, B40935 for Alexa Fluor 596 and B40932 for Alexa Fluor 488) according to the manufacturer’s instructions and applied to the section for 10 min at room temperature. Sections were then washed three times in PBS for 5 min and counterstained with DAPI (1 μg ml−1 DAPI in PBS) for 5 min. Following three additional PBS washes (5 min each), slides were mounted in 50% glycerol in PBS. Images were acquired using a 20× fluorescence objective on the Zeiss AxioScan Z.1 slide scanner. Stainings were quantified in QuPath by measuring positive cells as a percentage of the total tissue area. All antibodies used for IF are presented in Supplementary Table 6.
IHCAfter incubation with secondary antibody, slides were washed in PBS and incubated in SignalStain DAB (CST, 8059) for 5 min or until the horseradish peroxidase signal was visible and the reaction stopped in dH2O. Cells were then stained with hematoxylin (DAKO, Mayer’s Hematoxylin, S3309) for 30 s, washed in ammonia for 30 s and then washed in dH2O. Slides were dehydrated in 75% ethanol for 1 min and 100% ethanol for 5 min, washed in Histo-Clear for 5 min and mounted in DPX (Sigma-Aldrich). All antibodies used for immunohistochemistry (IHC) are presented in Supplementary Table 6.
GL13 stainingGL13 (SenTraGor) staining was performed as previously described55. In brief, formalin-fixed, paraffin-embedded xenograft tumour sections were deparaffinized and rehydrated through graded alcohols. Antigen retrieval was carried out by heat-mediated treatment in 10 mM citric acid buffer (pH 6.0) using a steamer for 15 min, followed by cooling in an ice bath for 20 min. Endogenous peroxidase activity was quenched by incubation with 3% hydrogen peroxide (H2O2) for 18 min at room temperature. Sections were subsequently washed and incubated sequentially in 50% and 70% ethanol for 5 min each. The samples were then treated with the SenTraGor reagent at 37 °C for 10 min. To remove residual reagent or precipitates, sections were washed with 50% ethanol for 2–3 min, followed by PBS and 0.3% Triton X-100 in PBS for 4 min. After washing with PBS, sections were incubated with a primary antibiotin antibody (1:300 dilution; Hyb-8, ab201341, Abcam, Cambridge, UK) for 1 h at room temperature. Signal development was performed using the Dako REAL EnVision Detection System (cat. no. K5007) according to the manufacturer’s instructions, using 3,3′-diaminobenzidine (DAB) as the chromogen to produce a brown signal. The mean percentage of SenTraGor-positive cells was quantified from at least five high-power fields (40× objective) per sample using a ZEISS Axiolab 5 optical microscope.
GLF16 stainingGLF16 staining was performed as previously described56,79. Formalin-fixed, paraffin-embedded tissue sections were deparaffinized, rehydrated and subjected to antigen retrieval as described in the SenTraGor staining section. The GLF16 reagent (70 μg ml−1) was applied to the tissue sections for 10 min in dark conditions at room temperature. Samples were subsequently washed three times for 10 min each with GLF16 diluent (PBS, 2.5% DMSO and 2.5% Tween-20). Following PBS washes, tissue autofluorescence was quenched using the Vector TrueVIEW Autofluorescence Quenching Kit according to the manufacturer’s instructions. Nuclei were counterstained with DAPI, and sections were briefly rinsed with dH2O (30 s) before coverslipping. IF images were acquired using a Leica TCS-SP8 confocal microscope. The mean percentage of GLF16-positive cells was quantified from at least five high-power fields (40× objective) per sample.
SA-β-galactosidase assay in tumour samplesTumour samples frozen in OCT were cryosectioned at 15 μM. Sections were fixed in ice-cold 0.5% glutaraldehyde (w/v, PBS) for 15 min and washed with 1 mM MgCl2/PBS (pH 6.0) for 5 min. β-galactosidase activity was detected using X-Gal staining solution (1 mg ml−1 X-gal, Thermo Scientific, 5 mM K3(Fe(CN)6) and 5 mM K4(Fe(CN)6)) diluted in 1 mM MgCl2/PBS (pH 5.5–6) for 8–18 h at 37 °C. Slides were dehydrated, mounted using VectaMount Permanent mounting media (Vector Laboratories, H-5000-60) and imaged using ×20 bright-field objective on a Zeiss AxioScan Z.1 slide scanner.
Lipid extraction for bulk lipidomicsCells were quenched with ice-cold methanol after treatment and transferred to tubes. Methanol was evaporated, and pellets were sonicated for 5 min in chloroform:methanol (2:1 v/v, 1 ml). Lipid extraction was performed using the Folch method80. In brief, LC–MS-grade water (400 µl) was added to the homogenized cells in organic solvent and thoroughly mixed. Separation of the polar and non-polar fractions was achieved by centrifugation (13,200g, 15 min). The separate fractions were dried down under vacuum. The organic layer was reconstituted in chloroform:methanol (2:1 v/v, 200 µl and diluted 1:10 with 2:1:1 isopropanol:acetonitrile:water, with the addition of an internal standard mix composed of isotopically labelled compounds from major lipid classes. Internal standard mix (final concentration 0.5 µg ml−1) included: N-palmitoyl-d31-d-erythro-sphingosine (C16-d31 ceramide), pentadecanoic-d29 acid (15:0-d29 free fatty acid (FFA)), heptadecanoic-d33 acid (17:0-d33 FFA), eicosanoic-d39 acid (20:0-d39 FFA), tetradecylphosphatidylcholine-d42 (14:0-d29 LPC-d13), 1-palmitoyl(d31)-2-oleyl-sn-glycero-3-phosphatidylcholine (16:0-d31–18:1 PC), 1-palmitoyl(d31)-2-oleyl-sn-glycero-3-phosphoethanolamine (16:0-d31–18:1 PE), 1-palmitoyl-d31–2-oleoyl-sn-glycero-3-[phospho-rac-(1-glycerol)] (16:0-d31–18:1 PG), 1-palmitoyl-d31–2-oleoyl-sn-glycero-3-phosphoinositol (16:0-d31–18:1 PI), N-palmitoyl(d31)-d-erythro-sphingosylphosphorylcholine (16:0-d31 SM), glyceryl-tri(pentadecanoate-d29) (45:0-d87 TAG), glyceryl-tri(hexadecanoate-d31) (48:0-d93 TAG) (all from Avanti Polar Lipids). PC, phosphatidylcholine; PE, phosphatidylethanolamine; PG, phosphatidylglycerol; PI, phosphatidylinositol; SM, sphingomyelin; TAG, triacylglycerol.
MS for lipid detectionSample (5 µl) was injected onto a C18 BEH column (2.1 mm × 50 mm, 1.7 µm; Waters) and separated using ultra HPLC on an Accela 3000 UHPLC (Thermo Fisher Scientific) using gradient elution at 0.5 ml min−1 and column temperature 55 °C. Mobile phase A was 60:40 acetonitrile:water, and mobile phase B was 90:10 isopropanol:acetonitrile. Both A and B contain 10 mM ammonium acetate (negative ion mode) or 10 mM ammonium formate (positive ion mode). The starting mobile phase was 40% B, increasing to 99% B over 8.5 min, before returning to starting conditions for 1.5 min. ultra HPLC was coupled to an LTQ Orbitrap Elite (Thermo Fisher Scientific) MS. The heated electrospray ionization source was operated at 375 °C and 2 or 3.5 kV for negative and positive ion modes, respectively. The capillary temperature
Comments (0)