Cell lines and P2X4R knockout
The PCa PC3 cell line was obtained from American Type Culture Collection (ATCC, Manassas, VA, USA). PC3 cells were maintained in Dulbecco’s Modified Eagle’s Medium (Thermo Fisher), supplemented with 10% FCS (Sigma) and 1% penicillin–streptomycin (Thermo Fisher). The PC3 cell line was confirmed mycoplasma free by regular PCR based mycoplasma screening. The P2RX4 KO CRISPR/Cas9 plasmid was purchased from Santa Cruz (sc-401779-KO-2) and is a pool of 3 different gRNA plasmids (gRNA1: CTCCGTTACGACCAAGGTCA targeting exon 3; gRNA2: TCACGTTGGTCATGACGAAG targeting exon 4; gRNA3: GTGCTTGTAGGAGTCTCAAC targeting exon 6 and spanning to the adjacent intron).
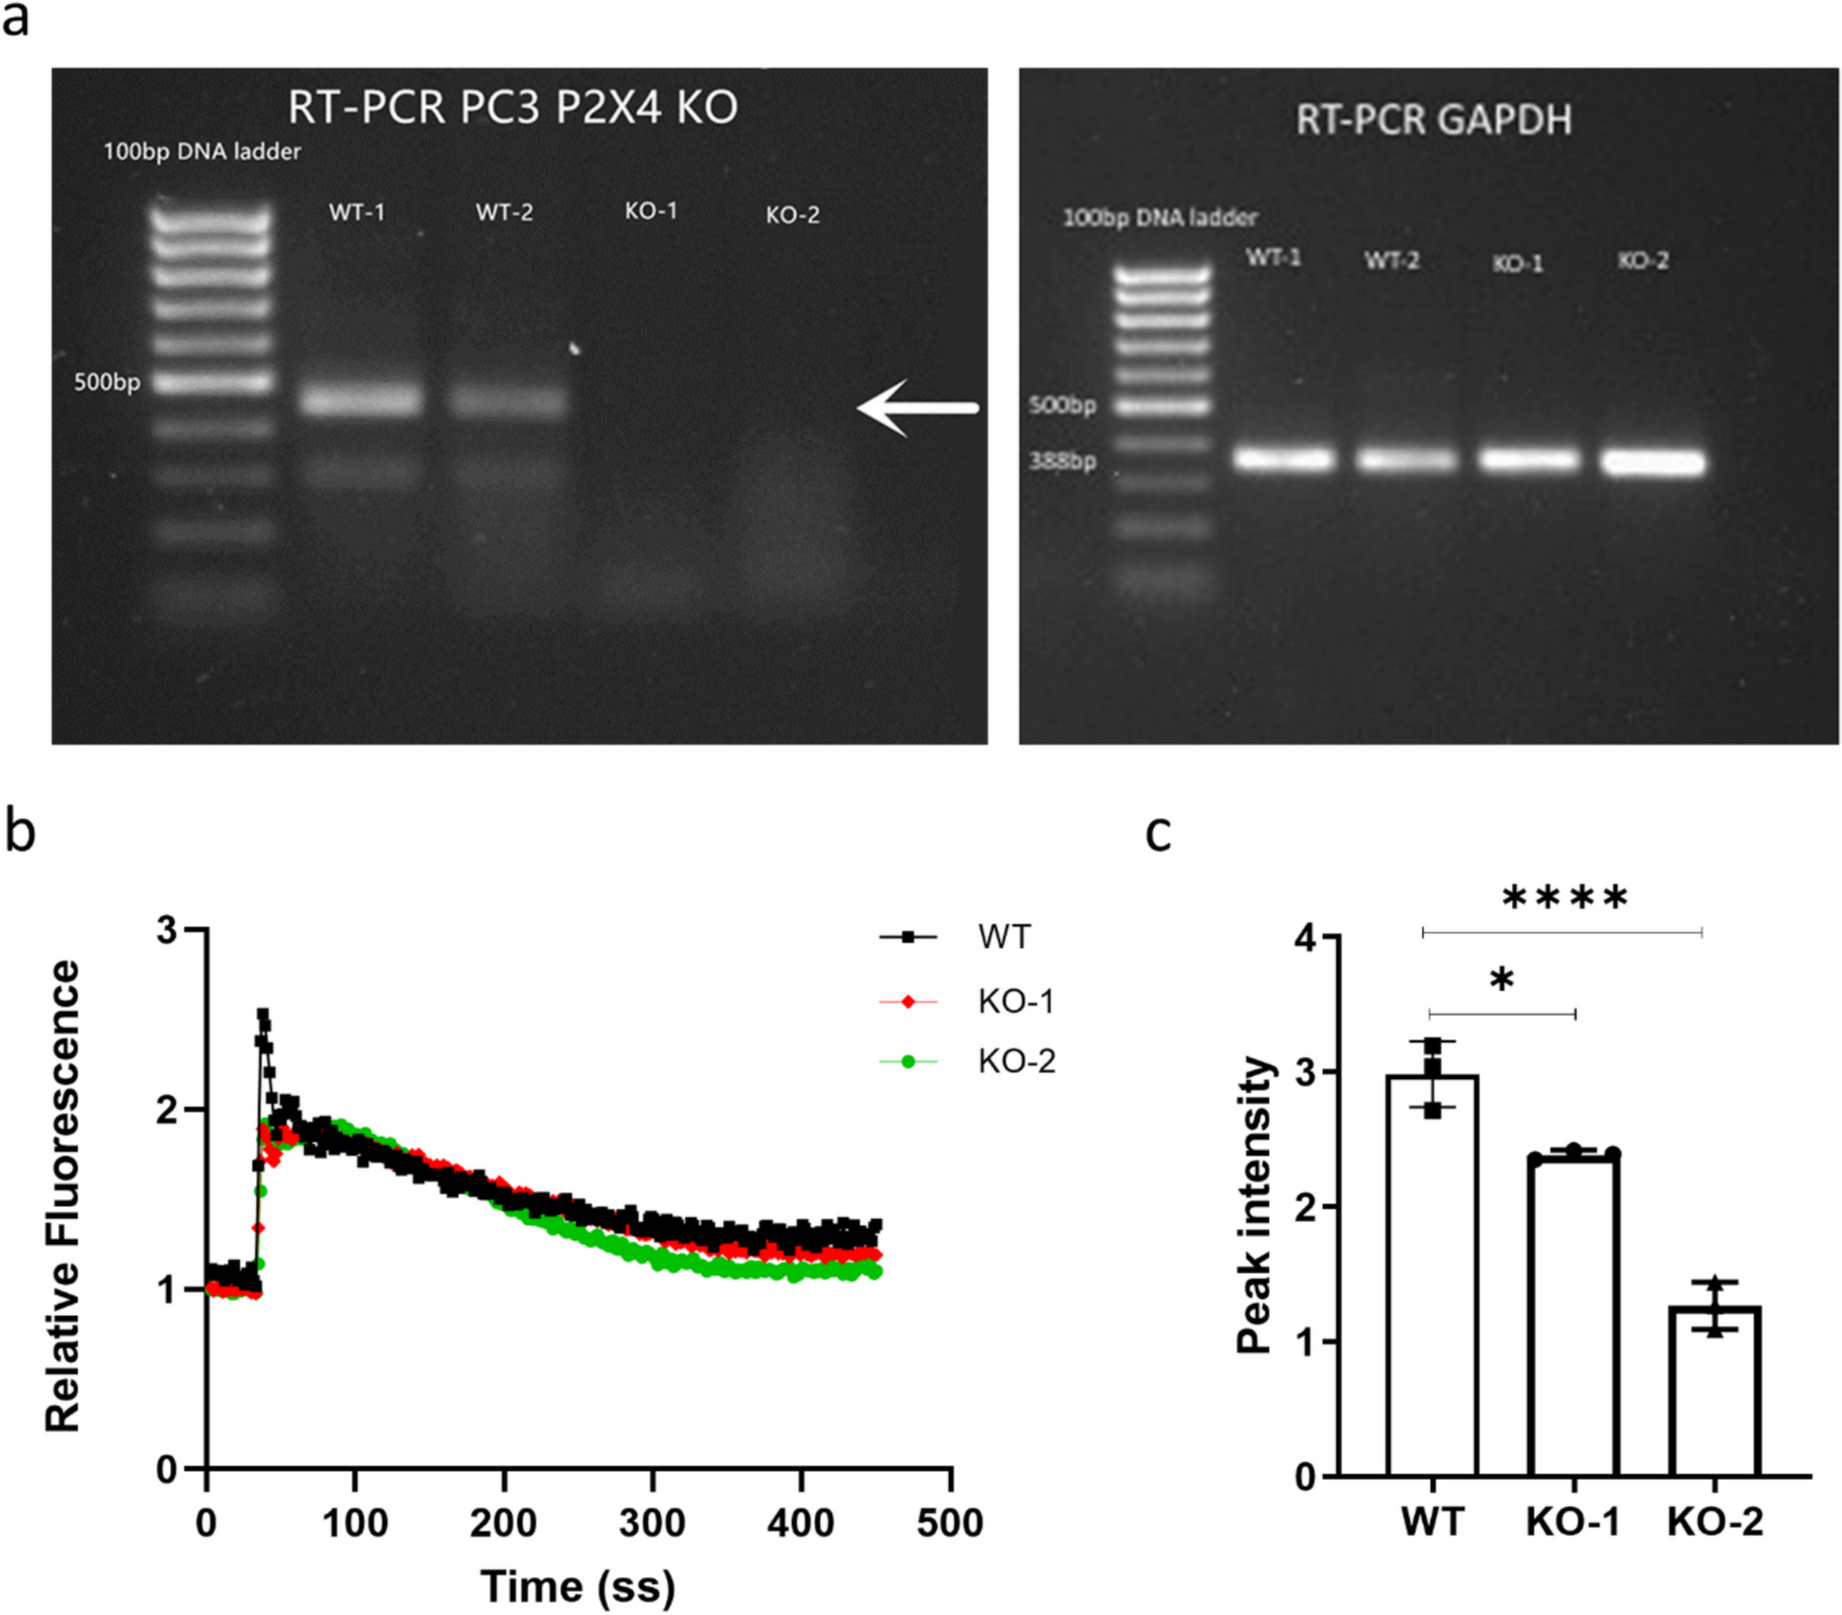
PC3 cells were transfected with the P2RX4 CRISPR/Cas9 KO plasmid using Lipofectamine™ 3000. Transfected cells were screened based on transient GFP expression using a FACSMelody cell sorter and successful P2X4R KO individual clones were verified at the genomic, transcriptional, and functional levels, via Sanger sequencing, RT-PCR, and Fluo-4 Direct™ Calcium assay, respectively.
PCR primers for Sanger sequencing gRNA-targeted regions:
SgRNA1-F: ACATCGTACTTCCAGCCACT
SgRNA1-R: CTCGGTCCCTTAGCACAT
SgRNA2-F: CGGTCAGTGTTTGAGTTG
SgRNA2-R: CAGCAGTGAATGTAGAGGG
SgRNA3-F: TAACTGTCTTCCTCCGATTC
SgRNA3-R: GTCACCTGCACCCTTCTC
RT-PCR primers for P2X4R:
Proliferation assay
The proliferation of PC3 WT/KO cells was assessed using the CyQUANT™ NF Cell Proliferation Assay (Thermo Fisher) based on cellular DNA content and fluorescence. PC3 cells were seeded at a density of 2 × 10³ cells per well in a 96-well plate containing medium. At 24-, 48-, 72-, and 96-h post-seeding, the medium was replaced with 1 × dye binding solution. After 1 h of incubation, fluorescence was measured using an EnSight Multimode Plate Reader (PerkinElmer) with excitation at 485 nm and emission at 530 nm.
Apoptosis assay
PC3 WT/KO cells were plated at a density of 1 × 10⁴ cells per well in 96-well plates and incubated in the medium for 24 h. The apoptotic activity of the cells was assessed using the Cell Meter™ Caspase 3/7 Activity Apoptosis Assay (Stratech) according to the manufacturer’s instructions. Fluorescence measurements were performed using an EnSight Multimode Plate Reader (PerkinElmer) with excitation at 490 nm and emission at 525 nm.
Migration assay
PC3 WT/KO cells were plated at a density of 2 × 10⁵ cells per well in 24-well plates and allowed to attach overnight. Mitomycin C (5 µg/mL, Sigma) was added and incubated for 1 h to inhibit cell proliferation. Vertical scratches were then created using a 200 µl pipette tip, and the cells were gently washed three times with serum-free medium to remove any detached cells. Cells were then left for 18 h after which time images were taken using an inverted Nikon phase contrast microscope (Nikon Inc., Tokyo, Japan). The percentage of scratch closure was determined using the ImageJ software (National Institutes of Health, Bethesda, MD, USA).
Invasion assay
Transwell® cell culture inserts, with an 8-µm pore polycarbonate filter (Sigma), were coated with 1.5 mg/mL Matrigel (Corning Life Sciences, Corning, NY, USA) and incubated for 2 h. PC3 cells were seeded at 5 × 10⁴ cells/well into the top chamber in serum-free medium, and treated with 5 µg/mL Mitomycin C, while 10% FBS was added in the lower chamber as a chemoattractant. After 72 h of incubation, the inserts were fixed in ethanol, stained with eosin and haematoxylin, and mounted on slides. Slides were scanned using the Pannoramic 250 Digital Scanner. The percentage of invaded cell area was quantified using the ImageJ software.
Mice xenografts
Six-week-old male BALB/cAnNCrl immunocompromised (athymic nude) mice (Charles River, Kent, UK) were housed under controlled conditions in Optimice cages (Animal Care Systems, CO, USA) with a 12-h light/dark cycle at 22 °C and ad libitum access to water and a 2018 Teklad Global 18% protein rodent diet containing 1.01% calcium (Harlan Laboratories, Huntingdon, UK). Mice were randomized into two groups (10 mice per group) and intracardially injected with PC3 WT or PC3 P2X4R KO cells (1 × 10⁵ per 100µL PBS per injection), respectively. The relatively moderate KO clone (KO-1) was used for the in vivo study, in order to generate more objective data. All mice were sacrificed on day 25 post-inoculation when the first mouse reached the humane endpoint. Tibias were collected and fixed in 10% formalin. All procedures complied with the UK Animals (Scientific Procedures) Act 1986 and were reviewed and approved by the local Research Ethics Committees of the University of Sheffield under Home Office project licence PF61050A3 (Sheffield, UK).
Micro-CT analysis
Micro-CT scanning on right tibias was conducted at the resolution of 4.3 μm, using the Skyscan 1272 scanner (Bruker, Billerica, MA, USA). The X-ray source operated at a voltage of 50 kV and a current of 200 µA, utilizing a 0.5 mm aluminium filter. Trabecular bone parameters were measured from a 1.0 mm thick region 0.2 mm below the growth plate where metastatic tumour cells are generally situated. Nomenclature and symbols were used to describe the micro-CT derived bone morphometries according to the published guidelines [13].
Tumour burden measurement on histological sections
Dissected right tibias were subjected to decalcification using 20% EDTA solution (ethylenediaminetetraacetic acid) for a period of 4 weeks, with regular replacement of the EDTA solution every 3 days. Following decalcification, the samples were embedded in paraffin wax and sectioned into 3 μm in thickness using an RM2265 microtome (Leica, Wetzlar, Germany) until the tibia head was exposed. Following hematoxylin and eosin (H&E) staining as previously described [14], the bone sections were examined under a DMRB microscope (Leica, Wetzlar, Germany) and the OsteoMeasure7 v4.2.0.1 software (OsteoMetrics, Decatur, GA, USA) was used to manually measure the percentage of the bone marrow occupied by tumours as an index of tumour burden.
RNA-seq and bioinformatics analysis
Total RNA was extracted from two PC3 P2X4 KO clones (KO-1 and KO-2) and three WT control cell lines, using the ReliaPrep™ RNA Cell Miniprep System (Promega). Samples with adequate RNA integrity (RNA integrity number (RIN) > 9.5) were selected for bulk RNA-sequencing. RNA library preparation and sequencing were performed by Source BioScience (Nottingham, UK). RNA-seq data can be accessed on the GEO repository (submission GSE245125). RNA-seq analysis was performed as follows. The principal component analysis (PCA) variance of samples was performed by Python (https://pypi.org/). Gene expression analysis was performed on Galaxy Europe (https://usegalaxy.eu/) with significantly differentially expressed genes being defined as logFC ≥ 1 and p < 0.05. Gene functional annotation and pathway analysis was performed on DAVID (https://david.ncifcrf.gov/). Molecular interaction networks analyses were performed on upregulated and downregulated gene lists, respectively, using the open-source software platform Cytoscape (https://cytoscape.org).
Statistics
The differences between the groups were analysed using unpaired t-tests or one-way ANOVA tests with Bonferroni’s multiple comparisons as appropriate using GraphPad Prism 8. The results are presented as mean ± standard deviation (SD), and p-values less than 0.05 were considered statistically significant.

Comments (0)