
Remember me
All cell lines were obtained from the American Type Culture Collection, except for MX-1 cells (a TfR1-negative cell line)60 and HCT-116-p53−/− cells, which were obtained from the cell bank of the Committee on Type Culture Collection of the Chinese Academy of Sciences and Fenghui Biotechnology Co., Ltd. (China). HCT-116 and A549 cells were cultured in RPMI-1640 medium supplemented with 10% FBS. HT-29, MDA-MB-231, U-87 MG, MX-1, and HEK293T cells were cultured in DMEM medium supplemented with 10% FBS. Hep G2 cells were cultured in MEM medium supplemented with 10% FBS, 1% non-essential amino acids, and 1% sodium pyruvate. HEC-1B cells were cultured in EMEM medium supplemented with 10% FBS. All culture media were supplemented with 1% penicillin‒streptomycin. All the cells were cultured at 37 °C in an atmosphere with 5% CO2, and the culture media were replaced every 2 days.
AnimalsFemale BALB/c nude mice (6–8 weeks old) were purchased from Gempharmatech Co., Ltd. (China). All animal studies were performed according to the protocol approved by the Institutional Animal Care and Use Committee at the Institute of Biophysics, Chinese Academy of Sciences (SYXK2024210). For xenograft tumor model construction, approximately 1.2 × 10⁷ HCT-116 cells were injected subcutaneously into BALB/c nude mice. For the Co-IP experiments, when the tumor diameter had reached 0.4–0.6 cm, the tumors were excised, homogenized with a tissue homogenizer and lysed with RIPA lysis buffer. For the RNA-FISH experiment, once tumors were detectable, the mice were randomized and intratumorally injected with shSCR or shTFRC lentivirus particles (MOI = 30) every 2 days. After 10 days, the mice were intratumorally injected with CDDP and sacrificed, after which the tumors were harvested, fixed, paraffin-embedded, and sectioned.
PlasmidsTo generate Flag-TfR1- and TfR1-EGFP-expression plasmids, human TfR1 cDNA (NCBI gene ID: 7037) was subcloned and inserted into the pQCXIH vector, which was tagged with 3×Flag at the N-terminus or EGFP at the C-terminus. To generate TfR1-SPSS expression plasmids, human TfR1 cDNA with a mutation in amino acids 58–61 (from KPKR to SPSS) was subcloned and inserted into the pQCXIH vector, which was tagged with 3×Flag at the N-terminus. For the construction of TfR1 truncation plasmids, human TfR1 cDNA with a deletion of amino acids 1–67 was subcloned and inserted into the pQCXIH vector, which was tagged with 3×Flag at the N-terminus, wherein the sites of the truncations were referred to the classification of the TfR1 domains.61 To generate p53 truncation plasmids, human p53 cDNA with a deletion at amino acids 1–47, 48–62, 1–62, 1–50, or 51–53 was subcloned and inserted into the pCDH vector, wherein sites of truncations was referred to the classification of p53 transactivation domain 1 (TAD1) and transactivation domain 2 (TAD2).62 To generate p53-E51A + Q52A + W53A mutant plasmids, human p53 cDNA with point mutations at amino acids 51–53 (changing EQW to AAA) was subcloned and inserted into the pCDH vector. To generate TfR1 expression plasmids for the rescue experiment, human TfR1 cDNA, which was code-optimized in a shRNA-resistant form, was subcloned and inserted into the pQCXIH vector. To generate TfR1-knockdown (shTFRC), p53-knockdown (shTP53), and scrambled shRNA (shSCR) plasmids, TFRC-targeted shRNA (sense strand sequence: 5’-GCCCAGATGTTCTCAGATATTT-3’), TP53-targeted shRNA (sense strand sequence: 5’-CGGCGCACAGAGGAAGAGAATCTC-3’), or scrambled sequence were subcloned and inserted into the PLKO.1-puro vector. To generate the XPC promoter reporter plasmid, the human XPC promoter was subcloned and inserted into the pGL3-Basic vector. To generate the ectodomain of TfR1 expression plasmids, human TfR1 cDNA (encoding TfR1 residues 88–760) was synthesized and inserted into pcDNA3.1(+) with the Kozak sequence (GCCACC) and the signal peptide from albumin fused at the N-terminus. A human rhinovirus 3C (HRV3C) protease recognition sequence, an octa-histidine tag and a strep-tactin tag II were placed at the C-terminus. To generate p53 expression plasmids, human p53 cDNA (NCBI gene ID: 7157) optimized for the Escherichia coli codon was subcloned and inserted into the pET30a vector. An octa-histidine tag and a strep-tactin tag II were also placed at the C-terminus.
Antibodies and chemicalsAll antibodies used in this study, except the anti-TfR1 antibody (clone number: 23B10), were purchased from commercial companies. These antibodies include anti-TfR1 antibody (Sigma, HPA028598), anti-Lamin B1 antibody (Abcam, ab133741), anti-α-Tubulin antibody (Beyotime, AT819), anti-Calreticulin antibody (Abcam, ab92516), anti-Syntaxin-6 antibody (CST, 2869), anti-importin-β1 antibody (Abcam, ab2811), anti-importin-α antibody (Abcam, ab307438), anti-Transportin-1 antibody (CST, 31452), anti-Sec61β antibody (CST, 14648), anti-GAPDH antibody (ABclonal, AC033), anti-Flag antibody (Sigma, F3165), anti-p53 antibody (Santa Cruz, sc-126), anti-p53 antibody (CST, 2524), anti-p53 antibody (Abcam, ab26), anti-XPC antibody (Santa Cruz, sc-74410), anti-γH2AX antibody (Abcam, ab81299), anti-Ki67 antibody (CST, 9449), mouse IgG (CST, 5415), rabbit IgG (CST, 3900), anti-RS4X antibody (Immunoway, YT4135). The 23B10 anti-TfR1 antibody was prepared in BALB/c mice using a standard protocol of hybridoma technology.63
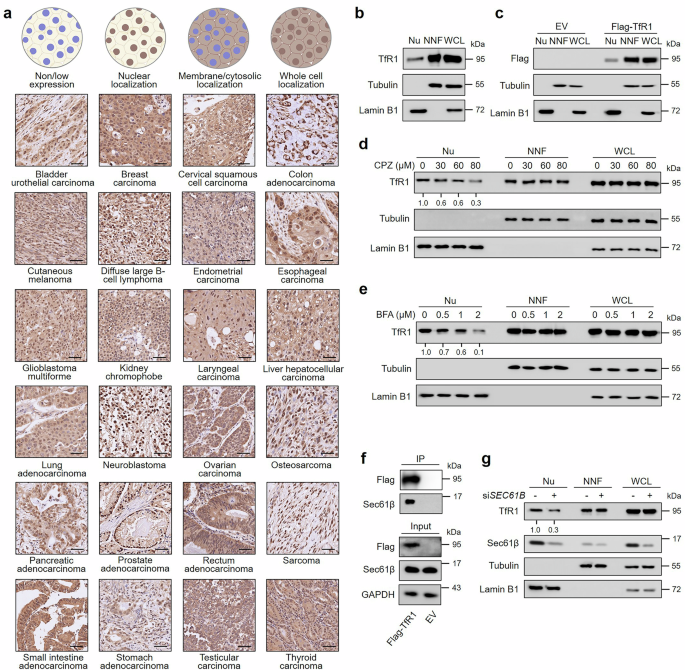
The chemicals used in this study include: chlorpromazine hydrochloride (Macklin, C834105), brefeldin A (Sigma, B5936), cis-platin (Sigma, P4394), polybrene (Yeasen, 40804ES76), hygromycin B (Yeasen, 60224ES03), and puromycin (Yeasen, 60209ES10).
Retrovirus and lentivirus infectionTo generate retroviruses, HEK293T cells were transfected with Flag-TfR1-, TfR1-EGFP-, or shRNA-resistant TfR1-expression plasmids and co-transfected with helper plasmids (pMD-VSV-G and pMD-gag-pol). For the generation of lentiviral particles, HEK293T cells were transfected with shSCR, shTFRC, or shTP53 plasmids and co-transfected with helper plasmids (pMDLg/pRRE, pCMV-VSV-G, and pRSV-Rev). Transfections were performed using Fugene HD transfection reagent (Promega, E2311). After 48 h, the retroviral or lentiviral supernatants were collected, filtered through 0.45 μm filters, and used to infect the indicated cells supplemented with polybrene (10 μg/mL). After retroviral or lentiviral infection for 36–48 h, the cells were selected with hygromycin (250 μg/mL) or puromycin (1 μg/mL).
siRNA transfectionFor the knockdown of Sec61β, HCT-116 cells were transfected with a scrambled sequence siRNA or a mixture of 2 different siRNA sequences targeting SEC61B (5’-GCAAGUACACUCGUUCGUA-3’ and 5’-GCAAGUACACUCGUUCGUA-3’) using Lipofectamine RNAi MAX (Invitrogen, 13778150) for 72 h.
ImmunohistochemistryThe tissue microarray sections were incubated with anti-TfR1 antibody (23B10) or anti-XPC antibody overnight at 4 °C, followed by incubation with horseradish peroxidase (HRP)-conjugated goat anti-mouse secondary antibody (ZSBG-BIO, PV-6002) for 30 min at 37 °C. Diaminobenzidine (ZSBG-BIO, ZLI-9019) and hematoxylin (ZSBG-BIO, ZLI-9610) were used for staining. Images were obtained using an Aperio CS2 slide scanner (Leica Biosystems, Germany). Two independent pathologists who were blinded to all the clinical information scored the samples. Nuclear TfR1 and XPC levels were calculated as the product of a proportion score and an intensity score. The proportion score reflected the fraction of positively stained cells (score 0, <5%; score 1, 5–10%; score 2, 10–50%; score 3, 50–75%; score 4, >75%). The intensity score represented the staining intensity (score 0, negative; score 1, weak; score 2, moderate; score 3, strong). The total score was calculated by the multiplication of the proportional score and intensity score and was further divided into 5 levels as follows: level 0 = 0, level 1 = 1–3, level 2 = 4–6, level 3 = 7–9, and level 4 = 10–12.
Human tissue microarrayThe study using the tissue microarray was approved by the Life Sciences Ethics Committee of Changsha Yaxiang Biotechnology Co., Ltd. (China). The ethics report is available online at yxswll.ccrl.cn. The query code is Csyayj2024017. The human multi-organ cancer tissue microarray X234Mc01, human colorectal cancer tissue microarray D1060401 and D062Co01 were obtained from Bioaitech Co., Ltd. (China). The multi-organ cancer tissue microarray X234Mc01 included 204 cancerous samples. The tissue microarray D1060401 included 95 cancerous samples from 61 male and 34 female patients with ages ranging from 22 to 78 years (mean age of 55). As for the American Joint Committee on Cancer grade, there were 15 cases of Stage I patients, 19 cases of Stage IIA patients, 12 cases of Stage IIB patients, 5 cases of Stage IIIA patients, 31 cases of Stage IIIB patients, 9 cases of Stage IIIC patients, 2 cases of Stage IVA patients, and 2 cases of Stage IVB patients. As for WHO (World Health Organization) grade, there were 10 cases of grade 1 patients, 7 cases of grade 1–2 patients, 59 cases of grade 2 patients, 3 cases of grade 2–3 patients, and 16 cases of grade 3 patients. As for lymph node involvement, there were 48 cases of patients without lymph node involvement, and 47 cases of patients with lymph node involvement. The tissue microarray D062Co01 included 56 cancerous samples from 33 male and 24 female patients with ages ranging from 39 to 84 years (mean age of 58). As for American Joint Committee on Cancer grade, there were 5 Stage I patients, 14 Stage IIA patients, 7 Stage IIB patients, 1 Stage IIIA patient, 20 Stage IIIB patients, 7 Stage IIIC patients, 1 Stage IVA patient, and 1 Stage IVC patient. With respect to WHO grade, there were 36 grade 2 patients, 5 grade 2–3 patients, and 15 grade 3 patients. As for lymph node involvement, there were 27 patients without lymph node involvement and 29 patients with lymph node involvement.
Confocal microscopyVarious types of tumor cells were seeded on glass-bottom cell culture dishes. After 24 h, the cells were fixed with 4% paraformaldehyde for 15 min and permeabilized with 0.2% Triton X-100 for 20 min. Then, the cells were blocked with 10% goat serum for 1 h and incubated with anti-TfR1 antibody (Sigma, HPA028598) or rabbit IgG overnight at 4 °C. Finally, the cells were incubated with Goat anti Rabbit IgG (H+L) cross-adsorbed secondary antibody Alexa FluorTM 647 (A21244, Invitrogen) for 1 h and stained with DAPI (Solarbio, S2110) for 10 min at room temperature in the dark. The TfR1-EGFP expression HCT-116 cells was imaged after staining with Hoechst (Beyotime, C1028) for 10 min at room temperature in the dark. Images were captured using a laser scanning confocal microscope (ZIESS-LSM700, German).
Subcellular fractionationTo isolate the nuclei, 1–2 × 10⁶ cells were resuspended in the nuclear isolation buffer composed of 10 mM HEPES, pH 7.9, containing 10 mM KCl, 1.5 mM MgCl2, 0.34 M sucrose, 10% glycerol, 1 mM dithiothreitol, 1 mM phenylmethanesulfonyl fluoride, and 0.1% Triton X-100. After that, the cells were incubated on ice for 15 min and centrifuged at 1300×g for 5 min at 4 °C. The pellet was washed with nuclear isolation buffer (without Triton X-100) and collected as the nuclear fraction. The supernatant was further centrifuged at 1700×g for 5 min at 4 °C to obtain the non-nuclear fraction.
ImmunoblottingThe protein concentration was determined using the BCA reagent (Thermo Scientific, 23228). The proteins were subsequently boiled with SDS loading buffer, separated on 10–12% SDS-PAGE gels, and transferred to polyvinylidene difluoride membranes. The membranes were blocked with nonfat milk (5% in PBS) and incubated with the indicated primary antibodies, followed by incubation with an HRP-conjugated goat anti-rabbit IgG (H+L) secondary antibody (Emarbio, EM35111) or an HRP-conjugated goat anti-mouse IgG (H+L) secondary antibody (Emarbio, EM35110). Finally, the proteins were detected via an enhanced chemiluminescence (ECL) system (Touch imager, E-blot, Shanghai, China).
ImmunoprecipitationVarious types of tumor cell lines were harvested from 100 mm dishes. To detect the interaction between TfR1 and p53, the cells were lysed and the nuclear fraction was isolated as described previously, and anti-TfR1 antibody (Sigma, HPA028598) was used as the immunoprecipitation part. When detecting the specificity of the 23B10 antibody to recognize human TfR1, the 23B10 antibody, other clones (24D5 and 8F10) produced from the same batch, and the anti-TfR1 antibody (Sigma, HPA028598) were used as the immunoprecipitation part and the whole cell lysate was obtained using cell lysis buffer (Sigma, C2978) supplemented with 1 mM phenylmethanesulfonyl fluoride and phosphatase inhibitor cocktail (Beyotime, P1081) for 1 h at 4 °C. Then, the lysates were subsequently incubated with protein G beads (Santa Cruz, sc-2002) overnight at 4 °C. When validating the interactions between TfR1 and importin-β, importin-α, transportin-1, or Sec61β, anti-Flag antibody (Sigma, F3165) was used as the immunoprecipitation part and the whole cell lysates were obtained using cell lysis buffer as described previously, followed by incubation with anti-Flag antibody-conjugated beads overnight at 4 °C. All the beads were subsequently washed with cell lysis buffer (supplemented with 250 mM NaCl) 3 times. After that, the protein G beads were boiled with 1×SDS loading buffer. The anti-Flag antibody-conjugated beads were eluted with 3×Flag peptide for 4 h at 4 °C, and the supernatants were boiled with 1×SDS loading buffer.
Mass spectrometry analysisThe proteins pulled down from immunoprecipitation were separated with silver-dyed gels. Then, the silver-dyed gels were excised, decolorized, reduced with dithiothreitol, alkylated with iodoacetamide, and digested with trypsin overnight to obtain the peptide fragments. The peptide fragments were extracted with 60% CAN and were analyzed by Liquid Chromatography-Mass Spectrometry/Mass Spectrometry (LC-MS/MS) on NanoLC-Q EXACTIVE (Thermo Scientific, USA). Proteins were identified by searching the fragment spectra in the UniProt_proteome_human_2018 database.
Expression and purification of recombinant human TfR1 and p53For human TfR1 expression and purification, the ectodomain of TfR1 expression plasmids was transiently transfected into HEK293T cells using Lipofectamine 2000 (Thermo Scientific, 11668500) as the transfection agent. Fresh medium was replaced after 7 h of transfection. After another 96 h, the supernatants were harvested, and TfR1 was purified via a Ni-NTA-affinity column (Cytiva, USA) and a strep-tactin column (IBA Biotagnology, Germany), followed by HRV3C protease cleavage to remove the affinity tags. After HRV3C protease cleavage, the protein sample was purified with a Ni-NTA column to remove the affinity tag and HRV3C protease. The protein sample from the previous Ni-NTA-affinity column was further polished with a Superdex 200 Increase 10/300 GL (Cytiva, USA) column to remove protein aggregates and trace amounts of miscellaneous proteins. The purified TfR1 protein was stored at −80 °C in 10 mM HEPES (pH 7.5) with 150 mM NaCl. The quality and quantity of the purified protein were evaluated by SDS-PAGE and UV/visible spectra using the theoretical ε280 nm 96,260 M−1 cm−1. For human p53 expression and purification, E. coli BL21 (DE3) cells were transformed with p53 expression plasmids and was grown to OD600 0.6 at 37 °C in 0.8 L of kanamycin-containing 2-YT medium. Gene expression was induced by the addition of 0.4 mM isopropyl-1-thio-β-D-galactopyranoside, and the cells were further grown at 16 °C for 20 h. After cell harvesting, the pellet was suspended in 50 mM Tris-HCl (pH 8.0) with 10 mM 2-mercaptoethanol, 5 mM imidazole and 250 mM NaCl and was disrupted by high-pressure cracker in the presence of 1 mM phenylmethanesulfonyl fluoride. The lysate was centrifuged, and the supernatant was loaded onto the Ni-NTA-affinity column. The eluent from the Ni-affinity column was further purified with the strep-tactin column. The p53 protein from the strep-tactin column was concentrated, and the buffer was changed to 10 mM HEPES (pH 7.5) with 100 mM NaCl and 1 mM DTT using a Hitrap Desalting column (Cytiva, USA) and stored at −80 °C. The quality and quantity of the purified protein were evaluated by SDS-PAGE and UV/visible spectroscopy via the theoretical ε280 nm 40,910 M−1 cm−1.
Surface plasmon resonanceThe recombinant human TfR1 was further biotinylated and immobilized on a streptavidin-coated chip. The binding affinity measurements were performed at 25 °C in PBS (pH 7.4) supplemented with 0.05% Tween-20 via a BIAcore T100 surface plasmon resonance instrument (GE Healthcare, USA). Approximately 150 response units of biotinylated TfR1 were captured in flow cells 2. Single-cycle kinetics were carried out by injecting increasing concentrations (25, 50, 100, 200, and 400 nM) of recombinant human p53, which flowed over Flow cell 1 and Flow cell 2. Binding responses for kinetic analysis were blank- and reference-subtracted. The binding curve was fit with a 1:1 binding model using BIAcore Instrument software.
CUT&Tag assayThe CUT&Tag assay was performed with the Hyperactive Universal CUT&Tag Assay Kit from Illumina (Vazyme Biotech, TD903). For each sample, 1 × 10⁵ cells were harvested, and the nuclei were isolated with nuclear extraction buffer according to the manufacturer’s instructions. The nuclear lysates were incubated with anti-TfR1 antibody (Sigma, HPA028598), anti-p53 antibody (CST, 2524), mouse IgG, or rabbit IgG. Following the manufacturer’s instructions, CUT&Tag libraries were obtained and sequenced by Berry Genomics. The data were analyzed with IGV_2.11.1. CUT&Tag sequencing reads were aligned to the human hg38 genome using Bowtie2 (v2.2.5)64 with the parameters: -t -q -N 1 -L 25 after trimming adapters by Trim Galore (v0.6.6). Multiple mapped reads and PCR duplicates were removed to generate uniquely mapped reads via JAVA Picard MarkDuplicates (v2.26.6). All unique mapped reads were then normalized by calculating the number of reads per kilobase per million of sequenced reads for downstream analysis using deepTools bamCoverage (v3.5.0)65 with the parameters --binSize 100 -- normalize using reads per kilobase per million. Heatmaps of genome peaks and the distribution of unique peaks were generated with deepTools. All the genome peaks were identified via MACS2 (v2.2.7.1)66 with the parameters -nomodel -q 0.05 -g hs. Peaks were compared by BEDTools (v2.29.2).67 The Pearson correlation coefficient was used to compare the relevance between different samples, and the significance of the relevance was based on the P-value. ChIPseeker (v1.26.2) was used to identify and visualize the features of the peaks.68 Promoters were defined as ±2.5 kb around the transcription TSSs. GREAT tool was used to analyze GO enrichment for unique peaks.69 The features of DNA motif enrichment of the genome peaks were analyzed by HOMER.70
Cell viability assayCell viability was determined using the CCK8 assay. Cells (16,000 cells per well for HCT-116 cells and HT-29 cells, and 10,000 cells for MDA-MB-231 cells after stable transfection with shSCR or shTFRC, respectively) were seeded in 96-well plates overnight. After CDDP treatment, CCK8 solution (Dojindo, CK04) was added into each well at a volume ratio of 10%. The absorbance at 450 nm was measured with a microplate spectrophotometer (SpectraMax M4, Molecular Devices, USA). The half maximal inhibitory concentration (IC50) values were calculated with GraphPad Prism 7.
Flow cytometry analysisThe cell apoptosis assay was performed with flow cytometry using the Annexin V-FITC Apoptosis Detection Kit (Dojindo, AD10). The cells (375,000 cells per well for HCT-116 cells or HCT-116 cells following stable transfection with shSCR or shTFRC) were seeded in 12-well plates overnight. After CDDP or BFA treatment, the cells were resuspended in Annexin V binding solution and stained with Annexin V-FITC and propidium iodide for 15 min at room temperature in the absence of light. After staining, the cells were washed and resuspended in Annexin V binding solution. For the validation of the specific binding to human TfR1 using the anti-TfR1 antibody 23B10, HCT-116 cells stably transfected with shSCR or shTFRC were seeded in 12-well plates overnight (375,000 cells per well). Subsequently, the cells were harvested, fixed with the Fixation Buffer (Biolegend, 420801), permeabilized with the Intracellular Staining Perm Wash Buffer (Biolegend, 421002), and incubated with the anti-TfR1 antibody 23B10 for 1 h at 4 °C. After that, the cells were washed with the Intracellular Staining Perm Wash Buffer and incubated with the goat anti-mouse IgG (H+L) cross-adsorbed secondary antibody Alexa FluorTM 488 (Invitrogen, A11001) for 30 min at room temperature in the dark. After staining, the cells were washed and resuspended in PBS. The fluorescence signals from at least 10,000 cells were collected with a FACS Calibur (BD Biosciences, USA). The data were analyzed with FlowJo_V10.
Alkaline comet assayAlkaline comet assay was performed using the DNA Damage Detection Kit (Keygentec, KGA240). Cells (375,000 cells per well for HCT-116 cells) were seeded in 12-well plates overnight. After CDDP treatment, cells in each well were harvested, washed with PBS, and added to frosted microscope slides covered with normal melting agarose and low melting agarose (10,000 cells/slide) according to the manufacturer’s instructions. Briefly, cells on the slides were lysed with lysis buffer for 1.5 h at 4 °C and incubated in alkaline electrophoresis buffer (1 mmol/L EDTA, 300 mmol/L NaOH) for 40 min for DNA unwinding under an ice bath. Electrophoresis was performed at 25 V for 25 min. Then, the slides were washed with 0.4 mM Tris-HCl (pH 7.5) at 4 °C three times and stained with propidium iodide for 10 min at room temperature in the dark. The slides were visualized using a laser scanning confocal microscope (ZIESS-LSM700, German). At least 50 cells were counted per group. DNA in the tail (% Tail DNA) from the images was analyzed by CaspLab-Comet Assay Software Project (v1.2.3).
RNA-seqHCT-116 cells after stable transfection with shSCR or shTFRC were seeded in 100 mm dishes overnight. Cells were harvested after CDDP treatment and washed with PBS. TRIzolTM reagent (Thermo Scientific, 15596026) was used to extract total RNA from each sample. Low-quality sequencing reads and adapters were removed by Cutadapt (v4.4),71 and the clean reads were mapped to the human hg38 genome by HISAT2 (v2.2.1)72 with default parameters. The gene counts were calculated with gene annotations from the UCSC database using FeatureCounts (v2.0.1).73 Fragments Per Kilobase of transcript per Million (FPKM) was introduced to normalize gene expression value. Differential expression analyses were performed with the R DESeq2 package (v1.24.0),74 the threshold of P-value was 0.05, with fold change ≥1.5. Heatmaps of differentially expressed genes were visualized by R pheatmap package (v1.0.12). GO enrichment analysis was conducted using DAVID (v6.8)75 with the default parameters, and visualized by R ggplot2 package (v3.3.5).
Real-time quantitative PCR (RT-qPCR)HCT-116 and Hep G2 cells stably transfected with shSCR or shTFRC were seeded in 6-well plates overnight. After CDDP treatment, total RNA from each sample was extracted using TRIzolTM reagent and cDNA was prepared with 5×All-In-One-RT MasterMix (Abm, G490). The RT-qPCR was performed using Taq Pro Universal SYBR qPCR Master Mix (Vazyme Biotech, Q712) on QuantStudioTM 7 Flex system (Thermo Scientific, USA). The relative mRNA expression level was recorded and analyzed with QuantStudioTM Real-Time PCR software by the 2−ΔΔCT method.
The primer pairs were used as follows:
XPC forward: 5’-CTTCGGAGGGCGATGAAAC-3’;
XPC reverse: 5’-TTGAGAGGTAGTAGGTGTCCAC-3’;
BBC3 forward: 5’-GACCTCAACGCACAGTACGAG-3’;
BBC3 reverse: 5’-AGGAGTCCCATGATGAGATTGT-3’;
CDKN1A forward: 5’-TGTCCGTCAGAACCCATGC-3’;
CDKN1A reverse: 5’-AAAGTCGAAGTTCCATCGCTC-3’;
DDB2 forward: 5’-ACCTCCGAGATTGTATTACGCC-3’
DDB2 reverse: 5’-TCACATCTTCTGCTAGGACCG-3’
ERCC5 forward: 5’-CACCAAGCGCAGAAGAACATT-3’;
ERCC5 reverse: 5’-ACCACTCTCCTTGACTCTACCT-3’;
NUFIP2 forward: 5’-GGTGAACTAAACGGTAATGCTGG-3’;
NUFIP2 reverse: 5’-GCTAGTGTCTACAACTTGCTGG-3’;
ACTIN forward: 5’-CTCGCCTTTGCCGATCC-3’;
ACTIN reverse: 5’-ATCCTTCTGACCCATGCCC-3’.
Dual-luciferase reporter assayHCT-116 cells following stable transfection with shSCR or shTFRC were seeded in 12-well plates and transiently transfected with a pGL3-Basic reporter plasmid containing XPC promoter together with the Renilla luciferase (pRL-CMV) plasmid using Fugene HD transfection reagent for 24 h. Subsequent to being treated with CDDP, Dual Luciferase Reporter Assay Kit (Vazyme Biotech, DL101) was used for determination of luciferase activity, detecting with a microplate spectrophotometer (SpectraMax M4, Molecular Devices, USA). Firefly luciferase values were normalized with renilla luciferase values.
RNA-FISH analysisRNA-FISH analysis was performed for paraffin sections from HCT-116 xenografted tumors stably transfected with shSCR or shTFRC using a customized FISH kit (Boster, MK3965, specifically produced for detecting XPC). In brief, the slides were deparaffinized and hydrated, followed by pepsin digestion for 30 min at 37 °C. After that, the slides were post-fixed with 4% paraformaldehyde for 5 min, incubated with pre-hybridization buffer for 3 h at 42 °C and hybridization buffer (containing probes targeting XPC mRNA) overnight at 42 °C, and then washed sequentially with 2×, 1×, and 0.2× saline-sodium citrate buffers. After sequential incubation with blocking buffer, biotinylated digoxin, streptavidin-biotin complex-FITC and 4 times washes with PBS, the slides were sealed with antifading mounting medium containing DAPI. Images were captured using a laser scanning confocal microscope (ZIESS-LSM700, German). At least 5 fields in the slides of each group were photographed. RNA-FISH signal was quantified using ImageJ (v1.52).
The sequences of the XPC mRNA targeting probes were used as follows:
(1) 5’-TCTATCGAAATAACATCTGCAGCCAGCCAGATCTGCATGC-3’
(2) 5’-GCTTTACCAGAGTGCTGCCTCGAGATGTGGACACCTACTA-3’
(3) 5’-TAGACCAGTGGCTAGAGGTGTTCTGTGAGCAGGAGGAAAA-3’
Statistical analysisAll quantitative data are presented as the mean ± SEM. Unpaired two-tailed Student’s t-test was used to evaluate statistical differences for two groups with one variable. One-way ANOVA analysis with Tukey multiple-comparison test was used to evaluate statistical differences for more than two groups with one variable. Two-way ANOVA analysis with Tukey multiple-comparison test was used to evaluate statistical differences for more than two groups with two or more than two variables. Chi-square and Fisher’s exact test were used to evaluate statistical differences for categorical variables. P-value less than 0.05 was considered significant. Asterisks denote statistical significance. *P < 0.05; **P < 0.01; ***P < 0.001; and ****P < 0.0001.
Comments (0)