
Remember me
The experiments and procedures were supported by the Ethics Committee of the First Affiliated Hospital of Chongqing Medical University. Five-week-old female nude BALB/c, NSG, and C57BL/6 J mice were purchased from AAALCA-accredited Model ORGANISMS (Shanghai, CHN). These mice were bred at the Animal Center of Chongqing Medical University at standardized specific pathogen-free facilities under a constant temperature of 23 °C and a photoperiod of 12 h light/12 h dark cycle and were provided ad libitum access to standard mouse chow and fresh water.
PDX modelsEPI-resistant bladder and breast tumor tissues were used to develop PDX NSG mouse models. The tumor tissues were immersed in RPMI 1640 medium and finely minced into fragments of approximately 2 mm3. Subsequently, the tumor fragments were subcutaneously transplanted into the flank of the right thigh of six-week-old NSG mice. Mice bearing tumors 100–120 mm3 in size were randomly assigned to various groups (n = 5/group) as indicated. The tumor volume was monitored and calculated every three days via the following standard formula: (width2 × length)/2. The peripheral blood samples of each mouse were collected via the right orbital vein for the detection of ALT and AST via the ALT and AST Activity Assay Kit (Solarbio, CHN) according to the manufacturer’s instructions. After euthanasia, the tumor tissues were collected for weighing, photography, histological examination, and other evaluations.
CDX modelsThe CDX mouse models used were 6-week-old nude mice (n = 5/group) and C57BL/6 J mice (n = 5/group). A total of 106 UM-UC-3 human bladder cancer cells or 5 × 105 MB49 mouse bladder cancer cells resuspended in 100 μL of normal saline were subcutaneously injected into the flank of the right thigh of each mouse. The mice were administered EPI (2 mg/kg), sodium lactate (100 mg/kg), sodium oxamate (500 mg/kg), and/or irinotecan (25 mg/kg) when the tumor volume reached 100–120 mm3 (day 0).
Cell culture and treatmentThe human urothelial carcinoma cell line UM-UC-3, the human osteosarcoma cell line U2OS, the human breast carcinoma cell line MDA-MB-231 and HEK-293T cells were obtained from ATCC. The human hepatoma cell line Huh7 was obtained from the National Collection of Authenticated Cell Cultures. All the cell lines were routinely cultured in DMEM supplemented with 10% heat-inactivated fetal bovine serum (FBS; Gibco), 100 U/mL penicillin, and 0.1 mg/mL streptomycin at 37 °C in an atmosphere containing 5% CO2. All the cell lines were verified via short tandem repeat profiling. The Cell Culture Contamination Detection Kit (Thermo, USA) was used to confirm that the cells were free of Mycoplasma contamination. The development of E-resistant UM-UC-3 cells involved subjecting parental UM-UC-3 cells to incremental doses of EPI ranging from 10 nM to 100 nM until the E-resistant UM-UC-3 cells survived in DMEM containing 100 nM EPI. The process spanned approximately six months. In addition, the cells were treated with 0.2 μM EPI, 20 mM sodium lactate, 20 mM sodium oxamate, 27.4 μM B02, 14 nM KU-57788, or 4 μM irinotecan.
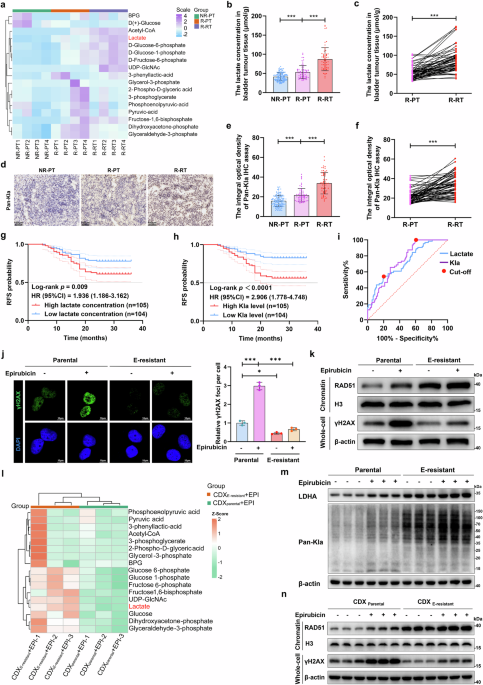
Patient samplesAll protocols used in this study were approved by the Medical Ethics Committee of the First Affiliated Hospital of Chongqing Medical University (2020-−36) and complied with all ethical regulations. Human tumor tissues were obtained from the First Affiliated Hospital of Chongqing Medical University after written informed consent was obtained from the participants. Primary and recurrent bladder tumor specimens were obtained from patients who underwent transurethral resection of bladder tumors and regular intravesical EPI chemotherapy or radical cystectomy between July 2020 and September 2023 (Table S1). The obtained samples were small in volume and therefore had no impact on the clinical diagnosis and treatment. All collected tumor samples were subjected to metabolomics, western blotting, immunohistochemistry, immunofluorescence, in vivo modeling, and other evaluations.
Clinical trialEligible patients reported recurrence of bladder cancer after standard intravesical chemotherapy with anthracyclines, with diagnoses confirmed histologically. The other inclusion criteria for the trial were as follows: (1) recurrent tumor diagnosed as urothelial carcinoma with a clinical stage of cTa–cT1N0M0; (2) age ≥18 years; (3) no prior history of systemic chemotherapy; (4) Eastern Cooperative Oncology Group Performance Status (ECOG PS) of 0–1; and (5) provision of written informed consent. The exclusion criteria included the following: (1) severe cardiac, cerebral, hepatic, gastrointestinal, renal, or infectious diseases; (2) severe malnutrition; (3) mental illness or cognitive impairment that hinders the ability to comprehend or communicate effectively; and (4) the presence of malignancies in other organs. All patients considered for enrollment were fully informed about the study procedures, potential therapeutic risks and benefits, available treatment alternatives, and their rights as participants.
This single-arm, phase I trial followed a 3 + 3 dose-escalation scheme to evaluate the safety and tolerability of intravenous irinotecan liposomes (Hengrui Pharma) in combination with intravesical EPI chemotherapy. Participants will complete immediate intravesical instillation of EPI (50 mg) within 24 h after transurethral resection of bladder tumor (TURBT) surgery. During the induction phase (the first month postoperatively), the first three participants (Patients A, B, and C) received a reduced dose of irinotecan liposomes (37.6 mg/m2, once every two weeks) in combination with standard intravesical EPI chemotherapy (50 mg, once a week) during the first cycle. If the combination was well tolerated, the irinotecan liposome dose was escalated to the full dose (56.5 mg/m2, once every 2 weeks) in the second cycle. The remaining three participants (Patients D, E, F) received the full dose of irinotecan liposomes (56.5 mg/m2, once every two weeks) along with standard EPI (50 mg, once a week) in both treatment cycles. All participants subsequently continued standard intravesical EPI chemotherapy (50 mg, once a month) until 6 months postsurgery. The participants will visit the clinic once every two weeks for checkups and tests in the first month after surgery, and maintain regular and consistent follow-up. The clinical trial was approved by the Ethics Committee of The First Affiliated Hospital of Chongqing Medical Hospital (approval number 2024-549-02) and registered at ClinicalTrials.gov (NCT06766266).
Lentiviral infection and the CRISPR/Cas9 systemTo develop ER-AsiSI U2OS cells, U2OS cells were infected with lentivirus containing ER-AsiSI cDNA, and 8 μg/mL polybrene was added. Stable ER-AsiSI U2OS cells were screened with 5 μg/mL puromycin for two weeks. To generate stably overexpressing cell lines, UM-UC-3, MDA-MB-231, and Huh7 cell lines were infected with lentiviruses containing BLM, BLM-K24R, BLM-K31R, BLM-K38R, EP300, CBP, AARS1, or AARS1-5A cDNA fragments with HA or Flag tags along with the addition of polybrene at a concentration of 8 μg/mL. The cells were subsequently screened with 5 μg/mL puromycin or 500 µg/mL G418 for two weeks. To establish BLM-knockout (BKO) cell lines, the CRISPR/Cas9 system was used as previously described.59 Briefly, the pSpCas9 BB-2A-Puro (PX459) vector containing the individual guide sequences targeting BLM was transfected into UM-UC-3, MDA-MB-231, or Huh7 cells, followed by screening with 5 μg/mL puromycin for five days. All stable cells were detected by immunoblotting. Their oligonucleotide sequences are listed in Table S5.
Plasmids and cell transfectionHuman cDNA sequences corresponding to Ub (UniProt ID: P0CG47), MIB1 (UniProt ID: Q86YT6), TIP60 (UniProt ID: Q92993), and AARS1 (UniProt ID: P49588) were synthesized via PCR-based amplification from a human cDNA library and then subcloned and inserted into the pcDNA3.1 expression vector (cloning sites: KpnI/XhoI or KpnI/BamHI) containing a Flag or His tag to drive transient expression. The plasmids were validated via DNA sequencing. For cell transfection, the plasmids were combined with polyetherimide in serum-free medium, followed by incubation for 15 min. Subsequently, the mixture was added to the cells.
Metabolite profilingThe isolated tumor tissues and cancer cells were washed twice with precooled normal saline. To remove proteins and extract metabolites, the tissues were smashed on ice, suspended in 400 μL of precooled methanol/acetonitrile solvent mixture (MeOH/ACN = 1:1, V/V, Merck, GER), vortexed for 30 s, and then centrifuged at 12,000 × g at 4 °C for 20 min. Then, the supernatant was incubated at −20 °C for 1 h and dried by rotary evaporation. The samples were subsequently redissolved in 100 μL of 50% ACN solvent (ACN/H2O = 1:1, V/V) and vortexed for 30 s. After recentrifuging, the supernatant was subjected to LC‒MS analysis (AB Sciex QTRAP 6500 LC‒MS/MS platform) for metabolite detection and untargeted metabolomic profiling as previously described.60
Identification of proteins with lysine lactylation by LC‒MS/MS analysisBladder cancer cells isolated from CDXParental + EPI and CDXE-resistant + EPI tissues were snap-frozen in liquid nitrogen and supplemented with urea lysis buffer for protein extraction. After sonication (Scientz, CHN) three times on ice, the supernatant was quantified via a BCA Kit (Beyotime, CHN). Subsequently, equal amounts of protein from each group were mixed dropwise with trichloroacetic acid (TCA, Sigma–Aldrich, CHN) at a final concentration of 20% and then precipitated at 4 °C for 2 h. Then, the pellet was collected and washed twice with precooled acetone (Sigma–Aldrich). The pellet was resuspended in 200 mM triethylammonium bicarbonate buffer (TEAB, Sigma–Aldrich, CHN), treated with trypsin (trypsin/protein = 1:50, W/W, Promega, USA), and digested overnight for peptide preparation. The resulting mixture was subsequently incubated with 5 mM dithiothreitol (Sigma–Aldrich, CHN) at 37 °C for 1 h and supplemented with 11 mM iodoacetamide (Sigma–Aldrich, CHN) for 30 min at room temperature (RT).
For enrichment of the lactylated peptides, anti-L-lactyl-lysine antibody-conjugated agarose beads (PTM-1404, PTM Bio, CHN) were washed twice with precooled PBS. The prepared peptides were then suspended in NP-40 buffer (Beyotime, CHN) and mixed with prewashed anti-L-lactyllysine antibody beads, followed by overnight incubation at 4 °C with gentle rotation. Next, the beads were harvested by centrifugation at 1000 × g for 1 min at 4 °C and rewashed with NP-40 buffer and deionized water to collect the enriched lactylated peptides. The beads bound to the enriched lactylated peptides were eluted twice via TCA at a concentration of 0.1%, followed by purification via C18 ZipTips (Sigma–Aldrich, CHN).
For lactylation analysis, LC‒MS/MS was conducted via a Bruker timeTOF Pro mass spectrometer combined with a NanoElute ultrahigh-performance system (Bruker, GER). Mobile phase A was an aqueous solution containing 0.1% formic acid and 2% acetonitrile. Mobile phase B was an acetonitrile-aqueous solution containing 0.1% formic acid. The liquid phase gradient conditions were as follows: 0–42 min, 7–24% B; 42.0–54.0 min, 24–32% B; 54.0–57.0 min, 32–80% B; and 57.0–60.0 min, 80% B. The flow rate was maintained at 450 nL/min. The peptides were separated by an ultrahigh-performance liquid phase system, injected into a capillary ion source for ionization and then analyzed by timsTOF Pro (Bruker) mass spectrometry. The ion source voltage was set to 2.0 kV, and the parent ions of the peptide segment and its secondary fragments were detected and analyzed via high-resolution TOF. The secondary mass spectrometry scan range was set to 100–1700 m/z. PASEF mode was used for data acquisition. A secondary spectrum with the charge number of parent ions in the range of 0-−5 was collected in PASEF mode 10 times after primary mass spectrometry collection. The dynamic exclusion time of series mass spectrometry scanning was set to 30 s to avoid repeated scanning of parent ions.
In addition, the raw MS data from each group of peptides were identified and quantified via MaxQuant (v1.6.15.0) software. The search parameters were set as follows: the database was Homo_sapiens_9606_SP_20220107.fasta (20376 sequence); an antidatabase was added to calculate the false positive rate caused by random matching; a common contamination database was added to the database to eliminate the influence of contaminated proteins; the enzyme digestion method was set as Trypsin/P; the number of missing cuts was set to 4; the minimum length of the peptide was set to 7 amino acid residues; the maximum number of peptide modifications was set to 5; and the mass error tolerance for primary parent ions was set at 20 ppm for the first search and main search and 20 ppm for secondary fragment ions. Carbamidomethylation was considered a fixed modification. Methionine oxidation, N-terminal acetylation, and lysine lactylation were considered variable modifications. The false discovery rate did not exceed 1%.
Measurement of lactate concentrationBladder tumor tissues and cancer cells were lysed in extraction buffer by sonication or homogenization at 4 °C and then centrifuged at 12,000 × g for 10 min, followed by collection of the supernatant. The absorbance values of the supernatant and standard solutions were measured at 570 nm via a colorimetric lactate content assay kit (Solarbio, CHN) according to the manufacturer’s protocol. The lactate concentration was calculated via a standard curve.
DNA end resection assayFor the DNA end-resection assay, ER-AsiSI U2OS cells were transfected with plasmids containing BLM or BLM-K24R cDNA fragments and then treated with 20 mM sodium lactate or 20 mM sodium oxamate for 24 h. The cells were treated with 2 μM 4-OHT or DMSO for 4 h. Subsequently, genomic DNA was extracted via the DNAzol reagent (Invitrogen, USA) according to the manufacturer’s protocol and subjected to BsrGI enzyme (New England Biolabs, USA)-mediated digestion at 37 °C overnight. A subsequent qPCR-based method was used to analyze single-stranded DNA (ssDNA) generation. In the qPCR mixture (25 μL), 2 μL of DNA was added as a template, along with 12.5 μL of 2× Taqman Universal PCR Master Mix (Applied Biosystems, USA) containing 0.2 μM of each primer and 0.2 μM probe. The primer and probe sequences used for qPCR are listed in Table S5. The percentage of ssDNA was quantified via the following equation: ssDNA% = 100/(2(ΔCt–1) + 0.5). The efficiency of end-resection was evaluated by determining the percentage of single-stranded DNA (ssDNA) generation relative to the cutoff efficiency, as previously described.61
Expression and purification of recombinant proteinsBacterial expression constructs (pET28a-sumo) containing the indicated genes were transformed into Escherichia coli BL21 (DE3), which were induced to express protein via 0.2 mM isopropyl β-D-thiogalactopyranoside (IPTG) at 20 °C with 160 rpm rotation for 20 h. Then, the harvested bacterial pellet was resuspended in 35 mL of lysis buffer (20 mM Tris-HCl, pH = 7.5, 500 mM NaCl, 5% glycerol, 20 μg/mL lysozyme, 1 mM PMSF, 1 mM DTT, and 1 mM EDTA) and subjected to ultrasonic cell disruption via an ultrasonic homogenizer. The lysate was clarified by ultracentrifugation at 15,000 × g for 30 min at 4 °C. The supernatant was filtered through a 0.45 μm membrane and subsequently loaded onto an AKTA pure chromatography system for protein purification.
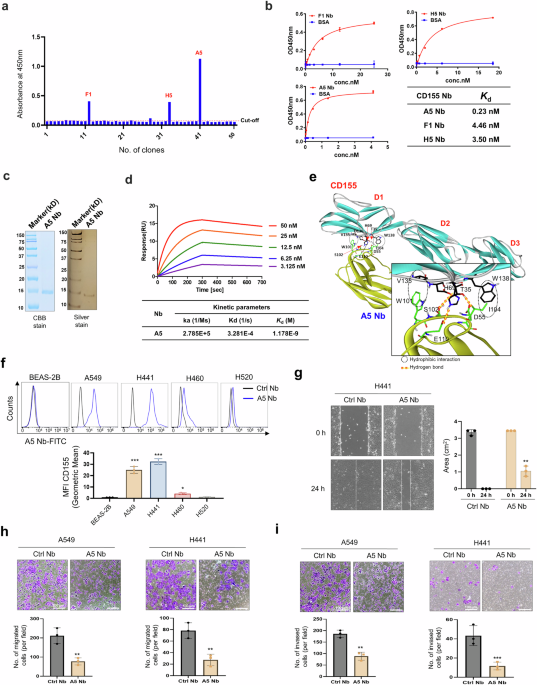
Surface plasmon resonance assaySPR experiments were conducted on a Biacore T200 instrument (Cytiva, Sweden) via a Series S Sensor Chip CM5 (Lot #10344853). The running buffer (10 × PBS, 0.05% Tween-20, and 1% DMSO) was degassed prior to use. Ligand immobilization was performed by activating the CM5 chip with a 1:1 mixture of 0.4 M EDC and 0.1 M NHS (Amine Coupling Kit, Cytiva) at a flow rate of 10 μL/min. The target protein was injected in 10 mM sodium acetate (pH = 4.0) until 5000 RU was achieved. Blocking was performed using ethanolamine at 10 μL/min. Small-molecule analytes were dissolved in PBST (1% DMSO) and serially diluted. Binding kinetics were measured at 25 °C via multicycle kinetics (30 μL/min, 90 s association, 300 s dissociation). Three startup cycles and blank injections were performed prior to analysis. Sensorgrams were double-referenced, and kinetic parameters (kon, koff) and equilibrium dissociation constants (KD) were calculated via Biacore Evaluation Software (Cytiva) with global fitting to a 1:1 Langmuir binding model.
Electrophoretic mobility shift assayPurified human WT and K24R BLM proteins were incubated at the indicated concentrations with 5′-end-labeled 50-bp dsDNA and 3′-tailed-labeled DNA substrates (Table S5) in reaction buffer (25 mM Tris-HCl, pH = 7.5, 5 mM MgCl2, 1 mM DTT, 100 mg/mL BSA, 2 mM ATP) containing 100 mM KCl at room temperature for 30 min. Prior to loading, the gels were run at 120 V for 30 min, and each well was flushed with 0.25x TBE. The reaction mixtures were subsequently combined with loading buffer and separated via electrophoresis on 5% native polyacrylamide gels in 0.25x TBE buffer. Images were acquired via an infrared fluorescence imaging system (LI-COR Odyssey 9120).
Helicase assayReactions were performed using 75 nM nucleotides (5′-end-labeled 50-bp dsDNA and 3′-tailed-labeled DNA, Table S5) in standard buffer (20 mM Na-HEPES, pH = 7.5, 2 mM ATP, 0.1 mM DTT, 100 mg/mL BSA, 0.05% Triton-X100, and 5 mM MgCl2) at 37 °C for 30 min. BLM protein was used at concentrations ranging from 10 to 20 nM, and RPA protein was used at 20 nM. Reactions were assembled on ice and initiated by transfer to 37 °C. To terminate the reactions, termination buffer containing 2 mg/mL proteinase K, 50 mM EDTA, and 1% SDS was added, and the mixture was incubated for 30 min. In addition, a 20-fold molar excess of identical but unlabeled oligonucleotide was included in the termination buffer to prevent spontaneous reannealing of the unwound substrate strands. The reaction products were resolved via electrophoresis on 12% native polyacrylamide gels in 1x TAE buffer.
Comet assayFor the comet assay, 104 cells were embedded in 0.7% agarose with a low melting point covered with 1% agarose with a normal melting point on the glass side. Next, additional cell-free 0.7% agarose with a low melting point was used to cover a layer containing pretreated cells embedded in 0.7% agarose with a low melting point. After cooling at 4 °C for 30 min, the three layers of agarose on the glass side were immersed in lysis buffer for 2 h at 4 °C. The slides were subsequently incubated with electrophoresis buffer for 30 min to unwind the DNA, and electrophoresis was performed at 25 V for 25 min. The slides were stained in the dark with PI for 10 min. For quantification, the head and tail DNA were captured via a fluorescence microscope, and the percentage of tail DNA was calculated via the CASP software.
ImmunohistochemistryBladder cancer tissue samples were fixed in 4% formaldehyde (Biosharp, CHN) and embedded in paraffin. The paraffin blocks were subsequently prepared as 4 μm thick sections on slides, followed by deparaffinization with xylene and rehydration using a series of decreasing ethanol concentrations. The slides were subsequently immersed in sodium citrate (Beyotime, CHN) and subjected to heat treatment at 95 °C for antigen retrieval. Then, the slides were covered with 3% H2O2 for 10 min and blocked with 5% goat serum for 20 min, followed by incubation with anti-pan-Kla primary antibody (PTM BIO, CHN) at 4 °C overnight. The slides were then incubated with horseradish peroxidase (HRP)-conjugated secondary antibodies for 20 min and stained with diaminobenzidine. Slides were scanned via the Panoramic SCAN (3DHISTECH, HUN), and the integral optical density of Pan-Kla was further analyzed via ImageJ software.
Western blot analysisProteins were extracted via RIPA buffer (Beyotime, CHN) containing 1% protease inhibitor (Abcam, UK), followed by sonication or homogenization at 4 °C. Subcellular protein fractionation was performed with a subcellular protein fractionation kit (Thermo, USA). The protein concentration was quantified via a BCA Kit (Beyotime, CHN). Equal amounts of proteins were separated by SDS‒PAGE and subsequently transferred onto polyvinylidene fluoride membranes (Millipore, USA). After being blocked with 5% skim milk, the membranes were incubated with the indicated primary antibodies overnight at 4 °C and then incubated with species-matched secondary antibodies (1:5000; Proteintech) at room temperature for 1 h. The membranes were visualized via WesternBright ECL (Advansta, USA) and Fusion FX (VILBER, FRS). The primary antibodies used in this study are listed in Table S6.
Immunoprecipitation and nickel pulldown assaysPretreated cells were lysed in NP-40 buffer (Beyotime, CHN) containing a protease inhibitor cocktail (Selleck, CHN) at 4 °C for 30 min. Then, the cell supernatant was incubated with 2.5 μg of species-matched immunoglobulin G (IgG) or equal amounts of anti-BLM, anti-HA, or anti-Flag antibodies at 4 °C. After overnight incubation, the supernatant was subsequently supplemented and incubated with 30 μL of protein A/G magnetic beads (MCE, CHN) at 4 °C for 4 h. Next, the magnetic beads were washed three times with NP-40 lysis buffer and then boiled in 1× SDS loading buffer (Beyotime, CHN) for further western blot analyses. To reduce the masking of IgG bands (heavy and light chains), anti-mouse and anti-rabbit IgG Veriblot secondary antibodies (ab131368, ab131366, Abcam) were used to detect immunoprecipitated proteins at a dilution of 1:5000.
Nickel pulldown assays were conducted as previously described.38 The cells were cotransfected with constructs encoding HA-BLM (or HA-K24R BLM) and His-ubiquitin. After 48 h of transfection, the cells were lysed in denaturing buffer (6 M urea, 300 mM NaCl, and 10 mM imidazole in 100 mM sodium phosphate, pH = 7.4) and incubated with Ni-NTA agarose beads at 4 °C for 2 h. The purified complexes were subsequently washed and subjected to western blot analysis.
Quantitative real-time PCRTotal RNA was extracted from E-resistant cells via RNAiso Plus (Takara, JPN). A total of 1 μg of purified RNA was reverse transcribed via ABScript Neo RT Master Mix for qPCR with gDNA Remover (ABclonal, CHN). Quantitative real-time PCR was conducted with 2X Universal SYBR Green Fast qPCR Mix (ABclonal, CHN). TOP I gene expression was normalized to that of β-actin.
BLM protein stability assayCells transfected with BLM-HA or BLM-K24R-HA plasmids were administered 40 μM cycloheximide with or without 20 mM sodium lactate. After 0, 12, 24, and 36 h of treatment, total protein was extracted via RIPA buffer, and the extract was subjected to western blot analysis via an anti-HA antibody for the quantitative detection of protein degradation.
Cell viability assayCell viability was assessed via a Cell Counting Kit-8 (Dojindo, JPN). A total of 4000 cells/well were seeded into 96-well plates. Subsequently, EPI, irinotecan, sodium lactate, sodium oxamate, or DMSO was administered at the indicated dose in the medium for 6 h, 24 h, 48 h, 72 h, or 96 h. After the cells were incubated with 10% CCK-8 reagent in complete DMEM for 2 h, the absorbance was measured at 450 nm via a microplate reader (TECAN, USA).
To measure the half maximal inhibitory concentration (IC50) values of EPI in parental and E-resistant cells, the cells were seeded into 96-well plates at a density of 12,000 cells/well and permitted to adhere for 12 h. Subsequently, the cells were administered incremental doses of EPI at 50 nM, 100 nM, 250 nM, 500 nM, 1 μM, and 2.5 μM. After 48 h of incubation, the cells were incubated with 10% CCK-8 reagent in complete medium for 2 h, and the absorbance was measured at 450 nm via a microplate reader. The survival rate of the EPI-exposed cells was calculated and normalized to the absorbance of the control group.
ImmunofluorescenceImmunofluorescence assays were conducted as previously described.62 The cells were fixed in 4% paraformaldehyde (Beyotime, CHN) for 10 min and permeabilized with 0.25% Triton X-100 at room temperature for 5 min, followed by blocking with Immunol staining blocking buffer (Beyotime, CHN) for 15 min. Next, the cells were incubated with anti-RAD51 and anti-γH2AX primary antibodies at 4 °C overnight, followed by incubation with secondary antibodies for 1 h. Then, the cells were stained with DAPI (Beyotime, CHN) for 10 min. Following deparaffinization, rehydration, antigen retrieval, and blocking, the tissue slides were incubated with anti-ki-67, anti-γH2AX, and/or anti-RAD51 primary antibodies at 4 °C overnight. The slides were then incubated with secondary antibodies for 1 h. After being stained with DAPI for 10 min, images were captured with a laser confocal microscope (Leica Microsystems AG).
Colony formation assayThe cells were treated with EPI, irinotecan, sodium lactate, sodium oxamate or DMSO at the indicated doses and incubated for 10–14 days until visible colonies formed. Colonies were fixed with 4% formaldehyde for 10 min and stained with 0.1% crystal violet (Beyotime) for 20 min. The number of colonies was counted via ImageJ software.
Molecular dockingThe PDB structure of BLM (P54132) was obtained from the AlphaFold protein structure database (https://alphafold.ebi.ac.uk/). A set of small-molecule drugs classified as ATC Code level 1 as class L was assembled from the DrugBank database. These chemical structures of the compounds were represented in SDF format, and their geometries were optimized in the MMFF94s force field via the RDkit program (https://www.rdkit.org, open-source cheminformatics). The three-dimensional spatial coordinates of the K-24 residues were identified via the GetBox plugin within PyMOL software. The Swiss PDB Viewer program was used to process the structure of the BLM-K24R mutant.63 The AutoDock Tools (version 1.5.6) program was used to add hydrogen to the BLM structure, calculate the Gasteiger charge, and incorporate a nonpolar hydrogen of the protein. Semiflexible molecular docking was performed via AutoDock Vina software (version 1.1.2),64, and each small molecule in the compound set was docked with the BLM WT and BLM K24R structures five times. The docking poses of the small-molecule drugs with the target protein were visualized via PyMOL software.
Molecular dynamics simulationMolecular dynamics simulations were performed to investigate the binding stability of irinotecan and the BLM protein via GROMACS (gmx2020.6_GPU) software. The ORCA program was used to optimize the DFT level of irinotecan on the basis of r2SCAN-3c. Water was used as the SMD solvent. The single-point energy was calculated via the B3LYP/GD3 DEF2-TZVP def2/J RIJCOSX base set. The topological structures of irinotecan were created via the Antechamber tool on the basis of the GAFF2 force field, and its RESP charges were fitted via Multiwfn.65 The AMBER99SB-ILDN force field was utilized to obtain the topological structures of the WT and K24R BLM proteins. The TIP3P water model was used for each simulation system. Counterions were added to neutralize the total charge of the system. Energy minimization was performed via the steepest descent method with a maximum of 1000 kJ/mol/nm and then minimized to 500 kJ/mol/nm via conjugate gradient optimization. Next, the system was first equilibrated for 5 ns under the isothermal-isochoric (NVT) system and then for 1 ns under the isothermal-isobaric (NPT) system by using a leap-frog integrator, reaching the corresponding simulated temperature (300.15 K) and pressure (0.1 MPa). The balanced system was simulated under the NPT system for 100 ns of all-atom molecular dynamics. A 10 ns unlimited simulation was performed for the BLM protein. The simulated temperature (300.15 K) and pressure (1.0 bar) were controlled via a V-rescale thermostat and a Parrinello Rahman regulator with time constants of 0.1 and 2 ps, respectively. The LINCS algorithm was used for all key constraints in the system. Long-range electrostatic interactions were calculated via the particle‒mesh Ewald method with a time step of 2 fs. The binding free energy between irinotecan and the K24 region of the BLM protein was calculated via the MMGBSA method via the gmx_MMPBSA tool.66
Quantification and statistical analysisGraphPad Prism 9.5.1 (GraphPad, USA) and SPSS version 26.0 (SPSS, USA) were used for all the statistical analyses. The data are presented as the means ± SDs of at least three independent experiments. Two-tailed unpaired Student’s t tests or paired t tests were performed to compare the statistical significance between 2 groups. One-way ANOVA with Tukey’s post hoc test was used to compare the statistical significance among multiple groups. Pearson’s correlation coefficient was calculated for linear correlation analysis. Differences were considered statistically significant at *p < 0.05, **p < 0.01, and ***p < 0.001.
Comments (0)