
Remember me
We initially analyzed CD155 expression across various cancer types using flow cytometry with two different antibodies (Supplementary Fig. 1a). We mined data from 21 TCGA cancer types using OncoLnc (http://www.oncolnc.org) to examine the log-rank p-value in Cox regression analysis, comparing CD155 expression across tumors. Cox regression analysis was performed using TCGA datasets. Our analysis revealed that CD155 expression in LUAD ranked first among the 21 cancer types based on survival p-values and FDR correction (Supplementary Table 1). High CD155 expression in LUAD patients was associated with poor outcomes and significantly shorter overall survival (p = 0.004) (Supplementary Fig. 1b), and was also consistently elevated in LUAD compared to normal lung tissue across public microarray datasets GSE116959, GSE19188, and GSE32863 (Supplementary Fig. 1c). We further confirmed this trend by evaluating CD155 protein levels in normal lung and LUAD tissues through immunohistochemistry, revealing higher expression in LUAD tissues (p = 0.0001) (Supplementary Fig. 1d).
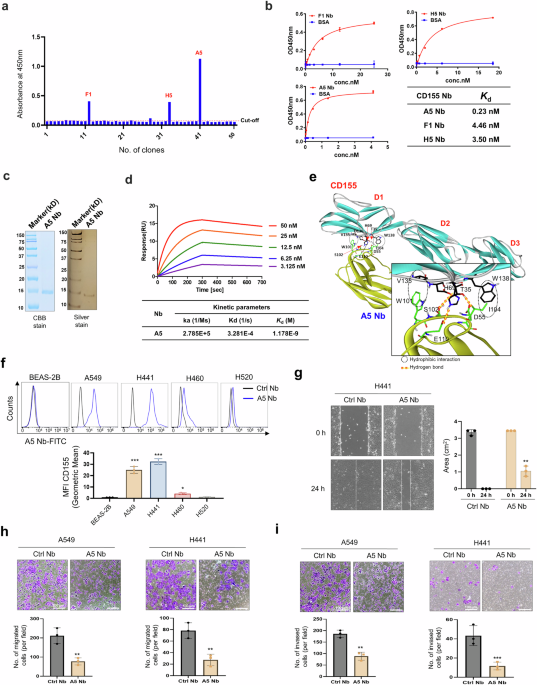
Generation and characterization of nanobodies binding to CD155 and functional effect of nanobodiesA nanobody (Nb) library containing ~1011 unique variants with diversified CDR regions was screened to identify Nbs that specifically bind to CD155, resulting in the selection of 50 clones with strong binding affinity. To obtain clones with distinct base sequences, the sequences of the 50 clones were analyzed, and three clones (F1, H5, and A5) were selected for secondary screening (Fig. 1a). The binding affinity of these three clones to CD155 was evaluated, revealing nanomolar-range affinities (Fig. 1b). Among them, A5 Nb was selected based on its optimal kinetic parameters. The A5 Nb expressed in this study was composed of ~125 amino acids, corresponding to a theoretical molecular weight of ~15 kDa. Its purity was verified by SDS-PAGE analysis, followed by visualization using Coomassie Brilliant Blue and silver staining methods. (Fig. 1c). Surface plasmon resonance (SPR) was employed to determine the binding affinity of CD155 to the purified A5 Nb. After immobilization A5 Nb on a Biacore CM5 chip, various concentrations of purified CD155 were injected over the sensor surface. SPR analysis demonstrated a dissociation constant (Kd) of 1.17 nM for the interaction between the A5 Nb and CD155 (Fig. 1d).
Fig. 1
Screening and characterization of CD155 specific nanobodies. a Phage-displayed nanobody library is screened against immobilized CD155 antigen to identify high-affinity binders through iterative biopanning cycles. Identification of anti-CD155 nanobodies via ELISA. Specificity of binding for 50 phage clones screened against CD155. Three clones with higher absorbance values than the control was selected as potential candidates. Cut-off value = 0.056. b ELISA was used to compare the reactive sensitivity to CD155 with different gradient concentrations of anti-CD155 Nbs (F1, H5, and A5). The table displays the binding affinities (Kd). c The purified recombinant proteins of A5 Nb separated by SDS-PAGE and stained with Coomassie Blue (CBB) and Siver stain. M: Marker. The molecular weight is indicated on the left. d A5 Nb binding to CD155 measured by SPR. Two-fold serial dilutions of CD155 from 50 nM to 3.125 nM injected onto the captured A5 Nb. Kinetic data from one representative experiment were fit to a 1:1 binding model. Summary of SPR affinity measurements. The equilibrium dissociation constant (Kd) is presented. Each concentration in the image above represents the mean value of three separate experiments. e Most probable binding pose of A5 Nb (yellow) with respect to CD155 (green). Intermolecular hydrogen bonds are represented by red dotted lines, while hydrophobic interaction contacts are denoted by black dotted circles. f The expression level of CD155 was measured by flow cytometry in BEAS-2B, A549, H441, H460, and H520 cell lines treated with CD155 A5 Nb. Isotype was used Ctrl Nb. g Representative images of scar and recovering of wounded areas (marked by white lines) on confluence monolayers of H441 cells at 0 and 24 h with CD155 A5 Nb (10 μg/mL) or Ctrl Nb (10 μg/mL) treatment and evaluation of scar wound healing in %. h Transwell migration assay. A549 and H441 cells were seeded on transwell insert and incubated with A5 Nb (10 μg/mL) or Ctrl Nb (10 μg/mL) for 24 h. i For the invasion assay, the membrane was pre-coated with 50 μL Matrigel. A549 and H441 cells were seeded on matrigel and incubated with A5 Nb (10 μg/mL) or Ctrl Nb (10 μg/mL) for 36 h. Scale bar = 100 μm for (h) and (i). Data represented as mean values ± SD, determined by two-tailed Student’s t-test *: vs. Ctrl Nb, *p < 0.05, **p < 0.01, and ***p < 0.001
We investigated the structural features associated with the biochemical potency of the A5 nanobody (Nb) against CD155. As shown in Fig. 1e, molecular docking simulations predicted the most probable binding conformation of the A5 Nb to CD155. Notably, the Ser102 and Glu110 within the CDR of A5 Nb were predicted to form hydrogen bonds with Asp136 and His69 of CD155, respectively, suggesting specific molecular recognition. Structural modeling of the A5 Nb–CD155 complex suggested the presence of an additional hydrogen bond formed between the Asp55 residue of A5 Nb and Thr35 of CD155, indicating a potential contribution to binding stability. The interaction was further stabilized by hydrophobic contacts, particularly between Trp101 and Ile104 in the CDR of the A5 Nb and the side chains of Val135 and Trp138 in CD155. These hydrophobic interactions likely contribute significantly to the overall stability of the complex, especially due to their proximity to three hydrogen bonds formed between the A5 Nb and CD155. The strong nanomolar affinity of A5 Nb for CD155 is corroborated by structural evidence showing multiple stabilizing hydrogen bonds and hydrophobic constacts at the interface.
A5 Nb-targeting of CD155 was evaluated by flow cytometry for binding to lung cancer cell lines that expressed high CD155 levels. Efficient Nb binding was observed in the A549 and H441 cell lines, with binding levels 20–30 times higher than those in the normal human bronchial epithelial cell line BEAS-2B (Fig. 1f). We examined the effects of A5 Nb on in vitro wound healing, migration, and invasion. A5 Nb significantly affected wound healing (Fig. 1g), migration (Fig. 1h), and invasion (Fig. 1i) in the A549 and H441 cell lines, which expresses high levels of CD155. A5 Nb treated A549 and H441 cells showed over a 50% reduction in cell migration and invasive capacity, completely blocking CD155-mediated functional effects. Therefore, we suggest that A5 Nb is the best candidate due to its strong binding ability to lung cancer cell lines and its ability to inhibit cell migration and invasion. However, A5 Nb had no effect on the in vitro wound healing (Supplementary Fig. 2a), migration (Supplementary Fig. 2b) or invasion (Supplementary Fig. 2c) of the CD155 low-expressing H460 and H520 lung cancer cell lines. These results suggest that A5 Nb specifically targets and inhibits the migration of CD155-overexpressing cancer cells.
Taken together, A5 Nb specifically binds to CD155 and selectively inhibits migration and invasion in CD155-overexpressing lung cancer cells. These results highlight its potential as a targeted therapeutic agent for CD155-positive tumors.
Effect of the A5 Nb on focal adhesion-related protein regulationTo evaluate the CD155 selectivity of A5 Nb, we investigated the cellular uptake and internalization of A5 Nb. Both Ctrl and A5 Nbs were labeled with Cy5 fluorescent dye and added to A549 cells for 24 h, followed by fluorescence imaging and flow cytometric analysis. A significant accumulation of fluorescence was observed in the membrane and cytoplasm, indicating that A5 Nb could be internalized and transported into the cytoplasm (Fig. 2a). Flow cytometry was performed to quantitatively assess the uptake of A5 Nb by A549 cells. As shown in Fig. 2b, an uptake rate of over 80% was observed in Cy5-labeled A5 Nb (A5 Nb-Cy5) incubated A549 cells. A conventional CD155 antibody was used as a comparator to evaluate the functional effects of the nanobody (Supplementary Fig. 3a, b). Similar to the nanobody, the conventional antibody was internalized into the cytoplasm (Supplementary Fig. 3a), showing an uptake rate of ~25% (Supplementary Fig. 3b). We then investigated whether the internalization and targeting of A5 Nb could affect cell migration properties, as previously demonstrated. The role of CD155-mediated epithelial-mesenchymal transition (EMT) in lung cancer cells was confirmed using qRT-PCR analysis to assess the differences in the expression levels of genes related to cell migration and EMT in Ctrl Nb- and A5 Nb-treated cells. However, no significant changes in the expression levels of these genes were observed in A5 Nb- or CD155 Ab-treated cells compared to those treated with control (Supplementary Fig. 4a, b).
Fig. 2
Internalization of CD155-targeted nanobody in CD155 overexpressed cancer cells and regulation of paxillin expression. a Cellular internalization images of fluorescently labeled nanobodies obtained by confocal laser scanning microscopy. A5 Nb conjugated with Cy5 and treated in A549 cells; scale bar indicated 20 μm. b % of cellular uptake was analyzed using flow cytometry. c pSrc/Src, pPaxillin/Paxillin, and pFAK/FAK pathway and focal adhesion complex proteins (Vinculin, α-actinin, Talin-1, and Tensin2) was measured in A549 and H441 cells after A5 Nb treatment versus Ctrl Nb. Quantified intensities are shown below each Western blot image. d Cellular morphology of A549 and H441 after A5 Nb treatment observed under an inverted light microscope. Quantification of shrinked cells was performed using ImageJ. Data represent mean ± SD of three independent experiments. e Representative images show expression of paxillin after treatment of A5 Nb in A549 and H441 cells compared to Ctrl Nb for 24 h. Nuclei were visualized with DAPI staining. Scale bar = 20 μm, A bar graph was used to present the average paxillin fluorescence intensity (n = 3). Data represented as mean values ± SD, determined by two-tailed Student’s t-test *: vs. Ctrl Nb, *p < 0.05, **p < 0.01, and ***p < 0.001
CD155 has been implicated as a key regulator of cancer cell motility. During the migratory process, it is directed to the front edge of the moving cell, aligning with actin cytoskeleton components and integrin-αv.12 This spatial organization contributes to cell scattering through the activation of Src and FAK signaling cascades.27 We also examined changes in focal adhesion kinase signaling in CD155-high expressing A549 and H441 cells treated with A5 Nb. We observed downregulation of both phospho-PXN and total PXN in these cells (Fig. 2c). We focused on reducing total PXN expression, as its reduction was associated with a corresponding downregulation of phosphorylated PXN. The focal adhesion complex, consisting of multi-proteins such as vinculin, α-actinin, PXN, talin, and tensin, connects the actin cytoskeleton to the extracellular matrix (ECM) via integrin receptors activation.28,29 Talin-1 expression was decreased in A5 Nb-treated cells compared to Ctrl Nb treatment (Fig. 2c).
PXN plays a critical role in cell spreading, cytoskeletal organization, and adhesion.30 Downregulation of PXN by A5 Nb treatment led to a high incidence of cell shrinkage, which was typically associated with a lack of focal adhesion complexes (Fig. 2d). Moreover, A5 Nb-treated A549 and H441 cells exhibited a 4- to 5-fold reduction in PXN localization at nascent membrane adhesions (Fig. 2e). These results were consistently observed with the CD155 antibody (Supplementary Fig. 3c–e). To investigate whether PXN is functionally correlated with CD155 overexpression in lung cancer, we examined the effects of PXN on cell phenotypes. SiRNA-mediated silencing of PXN significantly reduced A549 cell migration and invasion (Supplementary Fig. 5a–c) and led to cell shrinkage (Supplementary Fig. 5d). These findings suggest that the expression of the FA protein, PXN, is significantly altered by blocking CD155 signaling, inducing cell edge shrinkage, and directly inhibiting cell migration.
Several studies have reported that CD155 activates the AKT/mTOR and MEK/ERK pathways and regulates tumor progression.31,32 However, we observed no effect on phospho-AKT and phospho-ERK levels in A5 Nb-treated A549 and H441 cells compared to Ctrl Nb treatment (Supplementary Fig. 6a). In addition, A5 Nb did not significantly alter Src/PXN/FAK activation or expression in CD155 low-expressing H460 and H520 lung cancer cell lines (Supplementary Fig. 6b). Interestingly, our findings with A5 Nb were consistently recapitulated when cells were treated with a 10-fold higher concentration of a conventional CD155 antibody. These included intracellular uptake, reduced PXN localization at the plasma membrane, cell shrinkage phenotype (Supplementary Fig. 3c–e), and unchanged EMT marker (Supplementary Fig. 4b) and AKT/ERK pathway (Supplementary Fig. 6c) in CD155-high cell lines. In contrast, no changes the focal adhesion-related proteins were observed in CD155-low cell lines (Supplementary Fig. 6d). Taken together, A5 Nb selectively disrupts focal adhesion dynamics by downregulating PXN in CD155-overexpressing lung cancer cells, leading to impaired cell adhesion and migration.
CD155/PXN overexpression is associated with tumor progression and poorer overall survival in patients with lung cancerTo validate the correlation between PXN and CD155, we used the GEPIA database to analyze the relationship between the PXN and CD155 genes. As shown in Fig. 3a, PXN and CD155 levels were positively correlated (p < 1.2e-16, R = 0.42).
Fig. 3
CD155 and PXN were upregulated in LUAD and predicts poor prognosis. a Pearson’s correlation analysis of the CD155 (PVR)/PXN genes was conducted using the GEPIA tool. PVR and PXN were positively correlated (p = 1.2e − 16; R = 0.42). b CD155 and PXN expression in normal lung tissues and lung cancer tissues. The TMA slide was immuno-stained with anti-CD155, and anti-paxillin antibodies. The plot depiction of IHC staining scores with same matched patients. Scale bar = 200 μm. c Survival outcomes based on Kaplan-Meier survival analysis of patients from The Cancer Genome Atlas (TCGA) according to PXN expression levels (p = 0.004). d Kaplan-Meier curve of overall survival in patients with lung cancer stratified according to CD155 and PXN mRNA expression levels (PVRlow/PXNlowvs. PVRhigh/PXNhigh; p = 0.0018)
To determine the potential clinical relevance of CD155 and PXN overexpression, we performed IHC staining for CD155 and PXN in a tissue microarray of tumor samples from patients with lung cancer. CD155 and PXN were significantly more highly expressed in tumor samples compared to normal samples, as shown in Fig. 3b. Moreover, in the same lung cancer samples from the tissue microarray, CD155 and PXN consistently exhibited similar expression patterns that both proteins were highly expressed in the high-expression group and markedly reduced in the low-expression group (Fig. 3b, middle and bottom). Importantly, the level of CD155 was strong positively correlated with that of PXN (p < 0.0001, R = 0.554) in lung cancer. The patients with lung adenocarcinoma in the TCGA database who had high PXN expression showed poorer outcomes and shorter overall survival (p = 0.004) (Fig. 3c). Notably, patients with both high CD155 and high PXN levels displayed significantly worse overall survival than patients with low levels of both markers (Fig. 3d, p = 0.0018). Overall, we conclude that the CD155-PXN axis is conserved in patients with lung cancer and serves as a potent therapeutic target.
Characterization of LNP-DOX and A5-LNP-DOXDoxorubicin (DOX)-loaded liposomes capable of tumor penetration, referred to as LNP-DOX, were generated through DPPC lipid modification. The liposomes were obtained by mixing DPPC, followed by loading DOX using active drug loading, and then conjugating them with thiolated A5 Nb, resulting in A5-LNP-DOX (Fig. 4a). This process achieved a DOX encapsulation efficiency exceeding 65% and an encapsulation capacity >10%. The physicochemical properties of the particles were characterized using a size analyzer and transmission electron microscopy (TEM), which provided data on particle size, polydispersity index, surface charge, and morphology (Fig. 4b, c). The results indicated that the particle size of A5-LNP-DOX (54.65 ± 4.6 nm) was comparable to that of LNP-DOX (51.6 ± 4.0 nm), with both formulations exhibiting a spherical shape. These findings suggest that the incorporation of the A5 Nb coating did not significantly alter the physicochemical properties of the liposomes. Additionally, the negative zeta potential of LNP-DOX (-1.53 ± 0.331 mV) and A5-LNP-DOX (-1.99 ± 0.118 mV) supports the suitability of these formulations for drug delivery applications.
Fig. 4
Liposome Characterization. a Flowchart of the synthesis of A5-LNP-DOX. b Particle size analysis of liposome by dynamic light scattering analysis. (Created by BioRender) c TEM images of liposome. Scale bar indicated 100 nm. d In vitro drug release profiles of doxorubicin from liposome. e Confocal imaging was performed to analyze the intracellular regions of liposomes. A549 cells were exposed to LNP-DOX and A5-LNP-DOX (DOX:green) for 4 h. The scale bars indicated 20 μm and 5 μm (zoom-in). f Cellular uptakes were evaluated by flow cytometry. All LNP-DOX concentration is 200 μg/mL. Data represented as mean values ± SD, determined by two-tailed Student’s t-test. *: vs. Control, **p < 0.01, and ***p < 0.001. g In vitro cytotoxicity was assessed on A549 cells for LNP-DOX or A5-LNP-DOX. Cells were treated with LNPs at various concentrations for 8 h, after which the medium was replaced and cells were further incubated for 24 h. The LNPs oncentration varied at 1, 5, 10, 20, 30, 40, 50, 60, 80, and 100 μg/mL. Data represent mean ± SD. (n = 3) *: vs. LNP-DOX, ***p < 0.001. h A549 cells were treated with LNP-DOX and A5-LNP-DOX for 8 h and then the medium was replaced and cells were cultured for an additional 24 h followed by live/dead staining. The cells were stained with calcein and propidium iodide resulting in the appearance of live cells in green and dead cells in red. Scale bar = 100 μm. Data represented as mean values ± SD, determined by two-tailed Student’s t-test. *: vs. Control, **p < 0.01, and ***p < 0.001. i Detection cleaved caspase-3 in apoptotic cells by western blots
In vitro drug release under sink conditions was studied using a dialysis method. The release profiles of DOX from LNP-DOX and A5-LNP-DOX were assessed under neutral (pH 7.4) and acidic (pH 5.2) conditions. After 48 h of incubation, DOX release was 81% from LNP-DOX and 67% from A5-LNP-DOX under acidic conditions, representing ~4- and 3.3-fold increases, respectively, compared to the release at pH 7.4 (Fig. 4d). This enhanced release under acidic conditions is attributed to the protonation of phospholipid head groups, which leads to destabilization of the bilayer structure and increased permeability, thereby facilitating the release of encapsulated drugs.33,34
To achieve efficient induction of apoptosis in cancer cells, the anticancer drug DOX must be effectively targeted for intracellular delivery. The intracellular localization of LNP-DOX and A5-LNP-DOX in A549 and H441 cells was investigated using confocal microscopy. After 4 h of incubation, DOX fluorescence was predominantly observed in the cytosol of A5-LNP-DOX treated cells. The intensity of DOX-associated green fluorescence was markedly higher in the A5-LNP-DOX group compared to the LNP-DOX group, indicating effective active targeting via A5 Nb (Fig. 4e and Supplementary Fig. 7a). Quantitative analysis of cellular uptake in A549 cells revealed that ~27.7% of cells internalized A5-LNP-DOX, whereas only 8.1% internalized LNP-DOX (Fig. 4f). Similar results were in H441 cells (Supplementary Fig. 7b). However, in CD155-negative BEAS-2B cells, intracellular localization and uptake were negligible for both formulations (Supplementary Fig. 7a, b). These results confirm that A5-LNP-DOX selectively targets CD155-overexpressing cells and is internalized via CD155-mediated endocytosis, leading to effective cytoplasmic delivery of DOX and supporting its mechanistic basis for antitumor efficacy.
Furthermore, we evaluated the cytotoxicity of LNP-DOX and A5-LNP-DOX on A549 and H441 cells. Both LNP-DOX and A5-LNP-DOX exhibited dose-dependent cytotoxic effects, with A5-LNP-DOX displaying enhanced potency compared to LNP-DOX (Fig. 4g and Supplementary Fig. 7c). Cell viability was further assessed using live/dead staining with LNP-DOX or A5-LNP-DOX (10 μg/mL). After treatment, a higher count of red-stained dead cells was detected in A549 and H441 cells treated with A5-LNP-DOX compared to those treated with LNP-DOX (Fig. 4h and Supplementary Fig. 7d). Moreover, active caspase-3 were significantly higher in A5-LNP-DOX-treated cells (Fig. 4i and Supplementary Fig. 7e), indicating increased apoptosis. Overall, A5-LNP-DOX treated cells demonstrated higher dead cell counts and apoptosis markers than LNP-DOX treated cells. However, BEAS-2B cells showed no significant changes in cytotoxicity, live/dead staining, and active caspase-3 (Supplementary Fig. 7c–e). Taken together, A5-LNP-DOX demonstrated superior intracellular delivery and cytotoxicity in CD155-overexpressing lung cancer cells compared to non-targeted LNP-DOX. These results highlight the potential of A5 Nb-conjugated liposomes as an effective and selective drug delivery system for targeted cancer therapy.
CD155-targeting nanobody-liposomes enhance tumor accumulationTo evaluate tumor-targeting efficiency, A549 tumor-bearing mice were intravenously injected with LNP-ICG or A5-LNP-ICG (8 mg/kg), and whole-body fluorescence imaging was performed at 24 h and 48 h post-injection (Supplementary Fig. 8). A5-LNP-ICG exhibited stronger and more sustained fluorescence signals at tumor sites compared to LNP-ICG.
Ex vivo analysis at 48 h confirmed this tumor-selective accumulation, showing significantly higher fluorescence intensity in tumors treated with A5-LNP-ICG. Notably, no detectable fluorescence signal was observed in major organs such as the liver, heart, lungs, spleen, and kidneys. Quantitative analysis revealed a 3.6-fold increase in tumor accumulation relative to LNP-ICG (p < 0.05), supporting the CD155-targeted delivery capability of A5-LNP.
Therapeutic efficacy of CD155-targeted nanobody-liposomes in an orthotopic lung cancer modelTo assess the antitumor efficacy of A5-LNP-DOX in physiologically relevant lung microenvironment, we performed an orthotopic lung cancer model using luciferase-expressing A549 cells. Tumor progression was monitored over 25 d by bioluminescence imaging (BLI), and mice were treated intravenously with PBS, A5 Nb, LNP-DOX, or A5-LNP-DOX (DOX-equivalent dose = 4 mg/kg) three times per week (Fig. 5a). Following treatment, compared to PBS, all treatment groups including A5 Nb, LNP-DOX, and A5-LNP-DOX showed reduced tumor growth as indicated by serial BLI measurements. Notably, A5-LNP-DOX exhibited the most pronounced tumor suppression, with bioluminescence intensity significantly lower than that of both A5 Nb and LNP-DOX monotherapies, confirming its superior antitumor efficacy (Fig. 5b).
Fig. 5
Development of the orthotopic A549-luc tumor model. a Experimental design of lung orthotopic tumor development and treatment of PBS, A5 Nb (5 mg/kg), LNP-DOX (4 mg/kg), and A5-LNP-DOX (4 mg/kg). b Tumor growth was assessed by bioluminescence on days 7, 15, 20 and 25 after A549-luc cell injection into the lung left lobe. The bioluminescence intensity is expressed in photons/s for the thoracic area. Data were expressed as mean ± SEM. The sample size is n = 5. *: vs. PBS, ***p < 0.001, #: vs. A5-LNP-DOX, ###p < 0.001. c H&E staining image of tumors from PBS-, A5 Nb-, LNP-DOX-, and A5-LNP-DOX-treated group. Scale bar = 150 μm. The black dashed lines in the H&E stained tissue indicate the tumor-formed regions. The bar graph showed % of tumor regions in lung tissues from PBS-, Ctrl Nb-, A5 Nb-, LNP-DOX-, and A5-LNP-DOX-treated group. n = 5. d Active-caspase-3 and luciferase staining of tumors from PBS-, Ctrl Nb-, A5 Nb-, LNP-DOX-, and A5-LNP-DOX-treated group. The bar graph showed % of active-caspase3 in luciferase positive cells. For statistical analysis, five randomly selected tumors per group were stained and five random fields per tumor were scored. Scale bar = 150 μm, Data represented as mean values ± SD, determined by two-tailed Student’s t-test. *: vs. A5-LNP-DOX, *p < 0.05 **p < 0.01 and ***p < 0.001. The mouse icon of (a) created by BioRender
At day 25, lungs were harvested from all experimental groups for histological evaluation. H&E staining revealed extensive tumor infiltration in the PBS group, with dense tumor regions occupying ~40% of the total lung area. In contrast, tumor burden was substantially reduced in the A5 Nb and LNP-DOX groups, with tumor areas of 13% and 27%, respectively. Notably, A5-LNP-DOX treatment resulted in the lowest tumor burden, with only 4% of the lung occupied by dense tumor tissue (Fig. 5c). To assess treatment-induced apoptosis, active caspase-3 staining was performed on Luc-expressing tumor cells. The A5-LNP-DOX group exhibited significantly higher levels of caspase-3 positive cells compared to all other groups, supporting the enhanced apoptotic response induced by A5-LNP-DOX (Fig. 5d). These findings support A5-LNP-DOX as an effective CD155-targeted therapy with superior antitumor activity in lung cancer.
Antitumor effects of A5-LNP-DOX in human lung cancer organoid xenograft modelsPatient-derived lung cancer organoids (LCOs), SNU-2627-CO and SNU-2867-CO, were generated from malignant pleural effusion (MPE) samples of pathologically confirmed NSCLC patients35 and utilized to establish xenograft models. Immunofluorescence analysis revealed that SNU-2867-CO exhibited markedly higher CD155 expression than SNU-2627-CO, validating it as a suitable LCO for CD155-targeted therapy (Fig. 6a).
Fig. 6
Xenograft mouse model used LCOs. a Bright-field microscopy images of SNU-2627-CO and SNU-2867-CO. Scale bar = 100 μm. The information of LCOs; SNU-2627-CO;non-small cell lung carcinoma, SNU-2867-CO; lung adenocarcinoma. b Experimental design of LCO culture, 3D structure on MCE membrane and an antitumor effect in vivo was observed for PBS, A5 Nb (5 mg/kg), LNP-DOX (4 mg/kg), and A5-LNP-DOX (4 mg/kg). c, d Images of LCO tumors harvested at the endpoint and tumor weights. Data were expressed as mean ± SEM. The sample size is n = 5. *: vs. A5-LNP-DOX, *p < 0.05, **p < 0.01, and ****p < 0.0001. e H&E staining image of LCO tumors from PBS-, A5 Nb-, LNP-DOX-, and A5-LNP-DOX-treated group. Scale bar = 100 μm. f Paxillin expression (g). Ki67 IHC (g top) and CD31 IHC (g middle) staining of tumors from PBS-, Ctrl Nb-, A5 Nb-, LNP-DOX-, and A5-LNP-DOX-treated group. Detection of apoptosis by TUNEL assay (g bottom) in tumor tissue. For statistical analysis, five randomly selected tumors per group were stained and scored. Scale bar = 200 μm (Ki67 and CD31) and 100 μm (TUNEL) for (g). Data represented as mean values ± SD, determined by two-tailed Student’s t-test. *: vs. A5-LNP-DOX, *p < 0.05, **p < 0.01, ***p < 0.001, and ****p < 0.0001. The LCO and mouse icon of (b) created by BioRender
To evaluate in vivo efficacy, SNU-2867-CO organoids were transplanted into NSG mice and treated with PBS, A5 Nb, LNP-DOX, or A5-LNP-DOX. After 8 weeks, the A5-LNP-DOX group showed the most pronounced tumor suppression. Tumor weights in the A5-LNP-DOX group were ~42%, 64%, and 75% lower compared to those in the LNP-DOX, A5 Nb, and PBS groups, respectively (Fig. 6b–d). These results underscore the superior antitumor efficacy of A5-LNP-DOX over both monotherapies and the untreated control. Histological analysis of LCO-derived tumors by H&E staining confirmed that the xenografts retained key pathological features of lung adenocarcinoma, including acinar and lepidic growth patterns.36,37 These architectural features closely resembled those observed in LUAD patient tissues, supporting the clinical relevance of the LCO-based model. In contrast, tumors from the A5-LNP-DOX group exhibited a marked disruption of these structures, indicating that treatment significantly impaired tumor morphology (Fig. 6e).
Consistent with in vitro findings, A5 Nb- and A5-LNP-DOX treated LCO tumors exhibited reduced PXN expression compared to PBS controls, as shown by western blot analysis (Fig. 6f). Moreover, A5-LNP-DOX treatment markedly suppressed tumor cell proliferation and angiogenesis, as indicated by a decrease in Ki67-positive cells and reduced CD31-labeled microvessel density (Fig. 6g, top and middle, respectively). Notably, TUNEL staining demonstrated a ~ 7-fold increase in apoptotic tumor cells in the A5-LNP-DOX group compared to PBS, highlighting apoptosis as a key mechanism underlying its therapeutic effect (Fig. 6g, bottom). We believe that A5-LNP-DOX as a clinically relevant and promising therapeutic approach with strong potential for further development in CD155-overexpressing lung cancer.
CD155-targeting nanobody-liposomes suppress tumor growth without systemic toxicityTo complement the findings from the orthotopic and organoid models, we further evaluated A5-LNP-DOX in a subcutaneous A549 xenograft model. Consistent with previous results, A5-LNP-DOX treatment significantly suppressed tumor growth and reduced PXN expression, cell proliferation, and microvessel density (Supplementary Fig. 9a–e).
To further evaluate the biosafety of CD155-targeted nanobody-based therapies, systemic toxicity was assessed across all treatment groups. As shown in Supplementary Fig. 10a, there were no significant differences in body weight among the PBS, Ctrl Nb, A5 Nb, and LNP-DOX groups. A5-LNP-DOX treated mice exhibited a modest ( ~ 10%) reduction in body weight compared to PBS controls; however, this change was transient and not associated with signs of distress or morbidity. Nevertheless, there were no significant differences in serum GOT (AST) and GPT (ALT) levels among groups, including A5-LNP-DOX, indicating maintained liver function (Supplementary Fig. 10b). Histopathological examination of major organs, including the lungs, liver, kidneys, spleen and heart, revealed no evidence of tissue damage or inflammation in any treatment group (Supplementary Fig. 10c), further supporting the absence of systemic toxicity.
Collectively, these results demonstrate that A5-LNP-DOX delivers potent antitumor effects without inducing organ toxicity or compromising physiological integrity. The selective delivery of doxorubicin via CD155-targeted nanobody-liposomes enables effective tumor suppression while maintaining an excellent safety profile in vivo.
Comments (0)