Cell lines
The cell lines of HEK293T, MDA-MB-468, Hs578T and MCF7 were cultured in DMEM Medium (Gibco, Cat: C11995500BT) with 10% Fetal bovine serum (FBS, ExCell, Cat: FSD500). The cell lines of HCC1806 and HCC1937 were cultured in RPMI 1640 medium (Gibco, Cat: C11875500BT) with 10% FBS. The cell lines of BT549, BT474 and SK-BR-3 were cultured in 1640 medium with 10% FBS and 5 μg/ml Insulin (VivaCell Biosciences, Cat: C6010-1000). The cell line of SUM149PT was cultured in Ham’s F-12 medium (VivaCell, Cat: C3132-0500) with 5% FBS, 10 mM HEPES (Solarbio, Cat: H1095-100ml), 1 μg/ml Hydrocortisone (MedChemExpress, Cat: HY-N0583), and 5 μg/ml Insulin. The cell line of T47D was cultured in 1640 medium containing 10% FBS and 8 μg/ml Insulin. The cell lines of MDA-MB-231 and MDA-MB-231-Luc were cultured in DMEM/F12 (1:1) medium (Gibco, Cat: C11330500BT) containing 10% FBS. The cell line of MCF10A was cultured in DMEM/F12 (1:1) medium containing 5% horse serum (HS, Gibco, Cat: 16050122), 0.5 mg/ml Hydrocortisone, 20 ng/ml EGF (PeproTech, Cat: AF-100-15-100 μg), 10 μg/ml Insulin and 100 ng/ml cholera toxin (Beyotime, Cat: P7418-100 μg). All cell lines used in this study have been authenticated by STR analysis, and all cells were free from mycoplasma contamination and cultured in a humidified incubator (Thermo Scientific, Heracell 150i) at 37 °C with 5% CO2.
Animals
The female BALB/c nude mice aged between 5 and 7 weeks were purchased from Slaccas (Changsha, Hunan, China). The feeding and experiments of animal were conducted in accordance with the protocol which is obtained the approvement of the animal ethics committee of Kunming Institute of Zoology, Chinese Academy of Sciences (IACUC-PA-2022-03-029).
Patient samples and immunohistochemistry
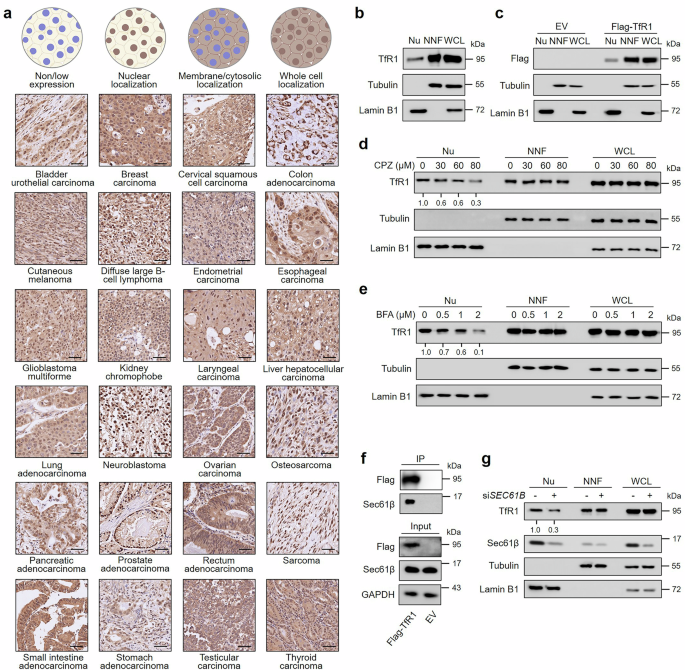
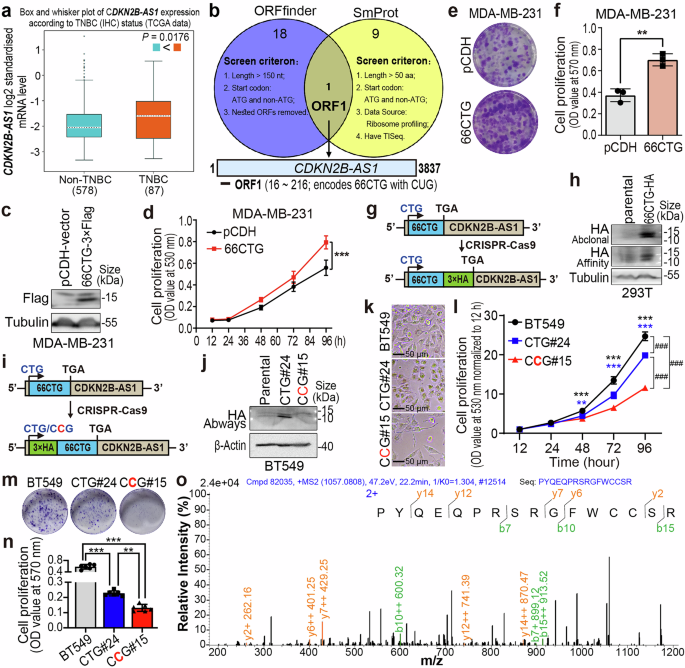
All experiments (including RT-qPCR and IHC) involving in the clinical TNBC tissue samples were approved by the ethics committees of each participating hospital and Kunming Institute of Zoology, Chinese Academy of Sciences (KIZRKX-2022-012). The samples of tumor tissue were provided by patients with their agreement. The tissue samples of eight cases of clinical breast cancer (including cancer tissues and adjacent normal tissues) were obtained from the First Affiliated Hospital of Kunming Medical University. The paraffin-embedded tissue sample chips containing eighty-nine cases of triple-negative breast cancer were obtained from Henan Provincial People’s Hospital, which were prepared by continuous splicing. Hematoxylin-eosin (HE) staining and immunohistochemistry (IHC) were performed by the Pathology Department of The First Affiliated Hospital of Kunming Medical University using antibodies against 66CTG (GL Biochem, Cat: AB012233, 1.6 μg/ml), c-Myc (MedChemExpress, Cat: HY-P80626, 0.6 μg/ml), Cyclin D1 (ABclonal, Cat: A19038, 1 μg/ml). The specificity of the 66CTG antibody for IHC was confirmed by detecting the expression level of 66CTG in the MDA-MB-231-66CTG-3×Flag cell line (see Supplementary Fig. 4j, k for details). The interpretation and analysis of histopathological data were carried out by specialized pathologists. The expression levels of 66CTG, c-Myc, and Cyclin D1 were evaluated using the IRS Scoring Method, which combines the proportion of positive tumor cells (score range: 0 to 4) and staining intensity (score range: 0 to 3). The IRS total score is calculated as (Proportion Score) × (Intensity Score). Protein expression levels are categorized into four grades: (1) Grade 0, IRS score = 0, indicating negative expression (no detectable expression); (2) Grade 1, IRS score = 1–4, indicating low expression (weak or focal expression); (3) Grade 2, IRS score = 5–8, indicating moderate expression (intermediate expression); (4) Grade 3, IRS score = 9–12, indicating high expression (strong and diffuse overexpression). The clinicopathological data of 8 breast cancer and 89 TNBC tissue samples could be found in Supplementary Dataset 1 and 2, respectively. And the original images of immunohistochemical staining for 66CTG, c-Myc, and Cyclin D1 in the continuous splicing paraffin-embedded chips (related to Fig. 4g and Supplementary Fig. 4l) could be available from Supplementary Dataset 10.
Cell transfection
For HEK293T cells, polyethyleneimine (PEI) (Polysciences, Cat: 24765-100) was used to transfect plasmids, and Lipofectamine 2000 (Thermo Fisher, Cat: 11668-019) was used to transfect siRNAs. For other breast cancer cell lines, Lipofectamine 2000 was used to transfect plasmids or siRNAs.
Genome editing using CRISPR-Cas9 system
The sgRNAs targeting 66CTG were cloned into the LentiCRISPRv2 system. The ssODN (single-stranded DNA oligonucleotide) template was resuspended to a final concentration of 10 μM. HEK293T (2.5 × 10⁵/well) and BT549 (2.5 × 10⁵/well) cells were seeded in 12-well plates. On the next day, the LentiCRISPRv2-sgRNA (500 ng) and the ssODN template (1 μl) were co-transfected into either HEK293T or BT549 cells using Lipofectamine 2000. Forty-eight hours after transfection, cells were dissociated into single cell and diluted to a final concentration of 0.5 cells per 100 μl, before being seeded into 96-well plates. One week later, wells containing monoclonal cells were selected and allowed to expand for an additional 2–3 weeks. The cells were then harvested for RNA extraction. Screening of cloned cells with successfully inserted HA tag sequences was conducted using RT-qPCR. For positive clones, the corresponding bands were further amplified by PCR, and the amplified products were purified via gel recovery. The purified products were subsequently cloned into the pCE2-TA/Blunt-Zero vector, followed by sequencing for identification. The sequences of sgRNAs, ssODNs, and qPCR primers can be found in Supplementary Table 1.
Gene overexpression (OE)
The DNA sequences of 66CTG and 66ATG, fused with a 3×Flag tag at the C-terminus, were cloned into the lentiviral vector of pCDH-CMV-MCS-EF1-puro (notag) at the BamHI and EcoRI restriction sites. This resulted in the construction of the plasmids pCDH-66CTG-3×Flag and pCDH-66ATG-3×Flag, facilitating the overexpression of 66CTG and 66ATG, respectively. The DNA sequence of c-Myc was cloned into the pCDH-CMV-3×Flag-MCS-EF1-puro (with the EcoRI and BamHI restriction sites) or pCDH-CMV-MCS-EF1-puro (notag) (with the BamHI and EcoRI restriction sites) lentiviral vector to create the plasmid pCDH-3×Flag-c-Myc or pCDH-c-Myc (notag) for the overexpression of c-Myc. A total of 5 μg of the overexpression lentiviral plasmid and 10 μg of packaging plasmids (including 5 μg pMDLg/pRRE, 3 μg pVSV-G, and 2 μg pRSV-Rev) were co-transfected into HEK293T cells using PEI. 48 h after transfection, the harvested viral supernatant was subsequently used to infect the TNBC cell lines, including MDA-MB-231, HCC1806, BT549, and MDA-MB-468. Puromycin selection was then carried out to obtain stable transfected TNBC cell lines that overexpressing 66CTG or c-Myc.
Gene expression knockdown
Gene knockdown was achieved by using siRNA and shRNA. For transient transfection, siRNA is transfected into breast cancer cells with lipofectamine 2000. After 48 h of transfection, the gene knockdown is assessed using qPCR or Western blot assays. For stable knockdown, the shRNA sequence targeting 66CTG was cloned into the pSIH-H1-puro lentiviral vector. Subsequently, 2 µg of the pSIH-sh66CTG expression plasmid DNA, along with 3.3 µg each of the pPACKH1-GAG, pPACKH1-Rev, and pVSV-G packaging plasmids (totaling 12 µg), were transfected into HEK293T cells by using PEI to produce viral supernatant. MDA-MB-468 cell line was infected with this viral supernatant containing sh66CTG and subsequently selected with puromycin 48 h post-infection. The sequences of siRNAs and shRNAs can be found in Supplementary Table 1.
Protein extraction and western blotting (WB) analysis
The lysis buffer (50 mM Tris-HCl pH 7.4, 1 mM EDTA, 150 mM NaCl, 1% Triton X-100) containing Protease Inhibitor Cocktail (MCE, Cat: HY-K0010) was used to extract the protein from cells and tumor tissues on ice for 30 min. WB was performed by using 11% SDS-PAGE gel and Thermo Scientific PageRuler Prestained Protein Ladder (Cat: #26616). The gel containing protein smaller than 35 KDa was transferred to 0.2 μm PVDF membrane (Merck millipore, Cat: ISEQ00010) at 100 V for 30 min, and the gel containing protein bigger than 35 KDa was transferred to 0.45 μm PVDF membrane (Merck millipore, Cat: IPVH00010) at 100 V for 90 min in cold room. After incubation with the primary and secondary antibodies, the substrate membrane was incubated in ECL solution (Abbkine, Cat: BMU102-CN) for 1 min and then was exposed on ImageQuant LAS 4000 gel imaging system (Cytiva, GE ImageQuant LAS 4000) and ChampChemi ® Chemiluminescent/Fluorescent/Gel Imaging and Analysis System (SINSAGE, cat: ChampChemi®910Plus). The detail information of the antibodies and reagents used in Western blotting is provided in Supplementary Table 2. The 66CTG antibody (rabbit polyclonal) was obtained from GL Biochem (Shanghai) Ltd. (Product No: AB012233). Its specificity was confirmed through 66CTG knockdown and overexpression experiments. The original and uncropped films of Western blot in this study could be found in Supplementary Dataset 8.
RNA isolation and RT-qPCR assays
TRIzol (Thermo Fisher Scientific, Cat#15596026) was used to extract the total RNAs of cells and cancer tissues in accordance with its protocol. The concentration and quality of the extracted RNA were determined by a NanodropTM 2000 Spectrophotometer (Thermo Fisher Scientific). Subsequently, total RNA was reverse transcribed into cDNA by using the HiScript IV 1st Strand cDNA Synthesis Kit (+gDNA wiper) (Vazyme, Cat#R412-01) for long cDNA or the HiScript III RT SuperMix for qPCR (+gDNA wiper) (Vazyme, Cat# R323-01). qPCR assay was conducted using the Taq Pro Universal SYBR qPCR Master Mix (Vazyme, Cat# Q712-02) and detected on the Applied Biosystems 7900HT Fast Real-Time PCR System (Applied Biosystems, Cat# 4351405). The sequences of qPCR primers can be found in Supplementary Table 1.
RNA sequencing
Total RNA of BT549 cells (5 × 10⁵ cells/sample) which have been transfected with the siRNAs of control (NC), 66CTG or c-Myc was extracted by using TRIzol (Thermo Fisher Scientific, Cat#15596026) to commercial RNA-seq analysis (Beijing Tsingke Biotech Co., Ltd., Beijing, China). The significantly differential expressions of genes were selected with log2 [Fold Change] < −0.4 and with P-value < 0.05. The analysis data could be found in Supplementary Dataset 3–7. The raw sequence data generated in this study have been archived in the Genome Sequence Archive (GSA; National Genomics Data Center, China National Center for Bioinformation) with the accession identifier HRA011629. These data can be accessed publicly via the GSA-Human portal: https://ngdc.cncb.ac.cn/gsa-human.
Mass spectrometry and 4D label-free quantitative proteomics
The detection and analysis of the 4D label-free quantitative proteomics on endogenous 66CTG in BT549 cells were performed by Applied Protein Technology (Shanghai, China). Briefly, 5 × 10⁶ BT549 cells were harvested and lysed using 700 μl of SDT lysis buffer (100 mM Tris-HCl pH 7.6, 4% (w/v) SDS) with a Protease Inhibitor Cocktail (MCE, Cat: HY-K0010). The total protein was reduced and alkylated, then enzymatically digested into peptide fragments, followed by HPLC separation (nanoElute, Bruker). The separated peptide fragments were analyzed using a mass spectrometer (timsTOF Pro, Bruker). The analysis results of mass spectrometry were compared with the 66CTG sequence to determine the expression of endogenous 66CTG in cancer cells (OMIX ID: OMIX010222).
SRB assays
For cell survival, BT549 (7 × 10³/well) and MDA-MB-468 (8 × 10³/well) cells were seeded in 96-well plates on the first day and transfected with siRNAs on the next day. Forty-eight hours post-transfection, the cells were fixed with Trichloroacetic acid (TCA, 10% (w/v)) (Macklin, Cat: T818878) for 30 min at room temperature. For cell proliferation, the 4 × 10³ cells (including BT549, MDA-MB-231, and HCC1806) were seeded for each well in 96-well plates. Twelve hours later, a portion of the cells was fixed with 10% TCA to serve as a seeding control. The remaining wells were fixed at 24, 48, 72, and 96 h, respectively. The fixed plates were then washed with ddH2O and air-dried at room temperature. Subsequently, the plates were stained with 0.04% (w/v) Sulforhodamine B sodium salt (SRB, 50 μl for each well) (Sigma-Aldrich, Cat: S1402) in 1% (v/v) acetic acid (Sangon Biotech, Cat: A501931) for 1 h at room temperature. After staining, the plates were washed five times with 1% (v/v) acetic acid in ddH2O and air-dried at room temperature. Finally, each well of plates was added 100 μl of 10 mM Tris base solution (pH 10.5), and then the plates were shaken for 20 min before measuring absorbance at 530 nm by using a microplate reader (Agilent, BioTek Epoch).
Colony formation assays
A total of 1 × 10³ cells were seeded into each well of a 6-well plate, and then incubated in a CO2 incubator at 37 °C for 2–3 weeks to form colonies of substantial size (approximately 50 cells per colony). After washing with 1× PBS twice, cells were fixed with 4% paraformaldehyde (PFA) (Phygene, Cat: PH0427) for 30 min at room temperature. 1 ml of 0.5% (w/v) crystal violet solution (Solarbio, Cat: IC0600-100mg) was added to each well and used to stain the cells for 1 h at room temperature. The plate was washed five times with ddH2O and allowed to air-dry. After imaging, each well was added 800 μl of 33% (vol/vol) acetic acid to solubilize the dye, followed by shaking for 30 min. The absorbance was then measured by using a microplate reader (Agilent, BioTek Epoch) at 570 nm.
Cell cycle analysis by flow cytometry
Each well of a 6-well plate was seeded with 2.0 × 10⁵ to 2.5 × 10⁵ cells. The next day, cells were transfected with siRNAs by using Lipofectamine 2000. Forty-eight hours after transfection, cells were collected and fixed with 75% ethanol for 30 min at room temperature (or stored for 1 to 2 weeks at 4 °C). Cells were then washed twice with 1× PBS and resuspended in 200 μl of 1× PBS containing 3 × 10⁵ cells. To treat the cells, 0.5 μl of 10 mg/ml RNase A (Beyotime, Cat: ST576) was added, followed by the addition of 3 ~ 5 μl of 10 mg/ml Propidium Iodide (PI) (Beyotime, Cat: ST1569-50mg) for staining in the dark for 30 min. After filtering the cells through a 200-mesh nylon membrane (Bioroyee, Cat: BH1811), flow cytometry was performed to analyze the cell cycle. Subsequently, FlowJo V10 software was used to analyze the data.
Co-immunoprecipitation (co-IP) and ubiquitination assays
A total of 9 × 10⁵ HEK293T cells were seeded in a 6 cm dish, and then were transfected with plasmids by using PEI the following day. 48 h after transfection, MG132 (20 μM) was added to treat the cells for 4 h. Each dish of cells was lysed on ice with 400 μl of lysis buffer (50 mM Tris-HCl pH 7.4, 1 mM EDTA, 1% Triton X-100, 150 mM NaCl) with Protease Inhibitor Cocktail (MCE, Cat: HY-K0010) for 30 min. The protein lysate was divided into two equal portions: one portion is for normal co-IP; the other portion is for ubiquitination IP. The portion for ubiquitination IP was further lysed on ice for 15 min following the addition of 10 μl of 20% (w/v) SDS, and then boiled for 15 min to denature. After centrifugation at 12,000 rpm for 10 min at 4 °C, the supernatant of the portion for normal co-IP was collected in a new 1.5 ml tube. Some protein sample was prepared as the Input control. The remaining protein sample was incubated with Anti-Flag (MedChemExpress, Cat: HY-K0207) or Anti-Myc (MedChemExpress, Cat: HY-K0206) magnetic beads at 4 °C for 4–6 h. The immunoprecipitation (IP) complexes were washed with wash buffer (50 mM Tris-HCl pH 7.4, 150 mM NaCl, 0.1% NP-40, 2 mM EDTA pH 8.0) five times, each lasting 5 min with shaking at 4 °C. Each sample was added with 40 μL of 1x loading buffer and heated at 98 °C for 10 min to denature. The IP samples were analyzed by Western blotting (WB) using an 11% SDS-PAGE gel, and the samples of ubiquitination IP were analyzed by a 6% SDS-PAGE gel.
Animal studies/breast orthotopic xenograft model
Female nude mice were anesthetized by using 7.5 mg/kg of xylazine and 75 mg/kg of ketamine. 2 × 10⁵ cells of MDA-MB-231-Luc (including MDA-MB-231-Luc-pCDH, MDA-MB-231-Luc-66CTG, and MDA-MB-231-Luc-66ATG), and 1 × 10⁶ cells of MDA-MB-468 (including MDA-MB-468-shCON, MDA-MB-468-sh66CTG#1, and MDA-MB-468-sh66CTG#5) were respectively resuspended in 100 μl of ice-cold medium/Matrigel (BD Biosciences, Cat: 354234) at a 1:1 ratio and orthotopically injected into the fourth pair of mammary fat pads. Using vernier caliper to measure the size of the transplanted tumors every 3 days from the eighth to the twelfth day after injection. The formula: tumor volume (cm³) = π (length × width²)/6 was used to calculate the tumor volume.
For the detection of bioluminescent, mouse was administered with D-luciferin (Bridgen, Cat: D12505) via intraperitoneal injection. 5 min later, the mouse was anesthetized with 7.5 mg/kg of xylazine and 75 mg/kg of ketamine. The IVIS Lumina XR system (Caliper Life Sciences, USA) was used to capture the bioluminescent images. The original bioluminescent images for Fig. 4a could be found in Supplementary Dataset 9. Each tumor tissue sample was divided into three parts: one for total RNA purification, one for protein extraction, and the third for paraffin embedding. In the xenograft model of MDA-MB-468, to ensure sufficient tumor tissue for paraffin samples, the left and right tumor tissues from the same mouse were pooled for RNA and protein extraction, as some tumors were too small to provide enough tissue individually.
Quantification and statistical analysis
Data were analyzed by using the soft of GraphPad Prism 10.0. When the P-value is less than 0.05, the result can be considered statistically significant. In figures, the error bars represent the standard deviation derived from three or more independent experiments. Statistical significance was assessed using a two-tailed Student’s t-test, one-way or two-way ANOVA, followed by Dunnett’s test. The information of detailed statistics for each experiment is presented in the respective figure legends.

Comments (0)