Study design and subjects’ selection
Subjects for this study were selected retrospectively from the Geneva Memory Center (GMC) cohort between 2016 and 2021, a naturalistic cohort of individuals with varying degrees of cognitive decline, from subjective to objective, who are under observation at the GMC of the Geneva University Hospitals. GMC subjects undergo a comprehensive diagnostic workup, including clinical and neuropsychological assessments, a neurological exam, and MRI. Thanks to several interconnected research projects, some subjects also undergo amyloid PET scans or other procedures (CSF, blood, Tau PET). Further information is available in [12].
Inclusion criteria for this retrospective study required the availability of both relative CBF (rCBF) assessed through pulsed ASL and standardized uptake value ratio (SUVr) in early frames of amyloid-PET (ePET).
Subjects were divided into two groups: CU and CI. The CU included subjects without cognitive impairment (worried well and subjective cognitive decline), while CI included subjects with MCI or dementia defined based on clinical diagnostic criteria [13, 14].
The study protocol, including imaging studies, was approved by the local ethics committee (CCER numbers: 2020–00403 and PB_2016 - 01346), and the research was conducted in accordance with the Declaration of Helsinki and International Conference on Harmonization Good Clinical Practice guidelines. All subjects or their relatives provided voluntary written informed consent.
Imaging protocolMRI
Brain scans were acquired in the Division of Radiology of the Geneva University Hospitals using a 3 T MRI scanner (Magnetom Skyra, Siemens Healthcare, Erlangen, Germany) with 64-channel head coil. The MRI protocol included a structural T1-weighted 3D sequence (repetition time/echo time [TR/TE] = 1930/2.36 ms; flip angle = 8°; resolution = 0.9 mm isotropic; 208 sagittal slices) and a pulsed ASL (pASL) sequence with flow-sensitive alternating inversion recovery (FAIR) labeling scheme (bolus duration/inversion time = 800/2000 ms, flip angle = 180°; in-plane resolution = 3 × 3 mm2, reconstructed resolution = 1.5 × 1.5 mm2 with interpolation; 40 slices; volumes = 4). This PASL sequence was of the 3D hybrid echo type, called “turbo gradient spin echo” (TGSE) by Siemens, corresponding to Philips’s GRASE scheme. A segmented acquisition of 12 segments was used. Turbo factor was 18, and EPI factor was 21. Square FOV size was 192 × 192 mm, and matrix size was 64 × 64. TE was 16.38 ms and TR 5000 ms.
Amyloid- PET
Amyloid-PET images were acquired using 18 F-Flutemetamol or 18 F-Florbetapir using a Siemens Biograph mCT or Biograph Vision PET-CT scanner (Siemens Medical Solutions, Hoffman Estates, IL, USA) following a previously described protocol [15]. Early-phase amyloid-PET (18 F-Florbetapir [eFBP] and 18 F-Flutemetamol [eFMM]) image acquisition began immediately after tracer injection (via venous cannula) [16, 17], with static images acquired for 5 min (eFBP) or 10 min (eFMM). Data were collected in a list mode and reconstructed using 3D OSEM 4 interactions 8 subsets and a 2-mm Gaussian filter at full width and half maximum (FWHM), resulting in images with 400 × 400 matrix with 1.01-mm isotropic voxels.
Image processing and quantitative analysis
PASL data were analyzed using FSL 6.0.3 (part of FSL FMRIB, Oxford, UK) and BASIL toolbox (part of FSL). As per [18], BASIL assumes by default a single well-mixed tissue compartment model with no dispersion of the bolus of labeled blood water (https://asl-docs.readthedocs.io/en/latest/basilcmd.html). This model was used for quantifying CBF with default relaxation values (T1 = 1.3 s, T1b = 1.65 s). Equilibrium blood magnetization was estimated from the calibration image using CSF as reference region, and adaptive spatial regularization on perfusion was also applied. CBF maps were rigidly registered to the corresponding T1-weighted image (FLIRT) and spatially normalized to the 2-mm MNI space (FNIRT). To ensure robustness of ASL data, a visual quality assessment of pulsed ASL acquisition was performed by FBP (neuroradiologist with 17 years of experience in ASL reporting). Ninety-eight out of 144 acquisitions were excluded since the presence of artifacts (head motion, signal drop, geometric distortion, or macro-vascular bright spots) [19] and/or delayed arrival time of the cerebral flow did not allow the detection of the spin-marked signal at the level of the cerebral tissue [20]. While the former is represented by intra-arterial serpiginous pulsed ASL signal within basal cisterns and cortical sulci, the latter represents a combination of ATA and low pulsed ASL signal in arterial border zones. This ATA and border zone sign artifacts occur when the transit time of arterial blood from the labeling plane to the imaging plane is greater than the post-labeling delay (PLD, e.g., subjects with diminished cardiac output or arterial stenosis) [21]. In our study, the ASL signal intensity was normalized to the eight top slices of the cerebellum, leading to individual rCBF maps. We applied this restriction in order to consider only those slices with good quality and stable values, as incomplete coverage, artifacts, or reduced signal can be present in the lower cerebellar slices of ASL. Cerebellum has been widely used for normalization in perfusion-weighted MRI studies when considering cognitively impaired/Alzheimer’s disease individuals as this region should be preserved, though other areas as putamen [7] or pons [22] have been also used in previous studies comparing ASL and PET data. However, in this study, we decided to use the cerebellum and to further restrict it to the superior slices as they were well perfused in both ASL and PET, and they are supplied by superior cerebellar arteries (SCA), very close to posterior arteries and posterior communicating arteries of the Willis polygon. This can potentially limit the influence between anterior and posterior interconnections in normal conditions. It is also important to recognize that achieving efficient labeling is more difficult in the posterior circulation than in the anterior circulation, mainly because of their greater tortuosity in the neck, as often demonstrated in studies focusing on selective flow territory mapping with ASL [23, 24]. This is due in part to degenerative changes in the spine (such as uncovertebral hypertrophy and osteophytes), which occur during aging and indent the vertebral arteries, inducing alterations in their course, which become tortuous and elongated. This is even more challenging when using pCASL schemes than PASL, as the spatial labeling location is very important for the labeling efficiency and should be thus carefully considered in similar studies. PET images were processed using in-house MATLAB code and SPM12 software package (Wellcome Department of Cognitive Neurology, London, UK) as described in a previous study [15]. Both pulsed ASL and ePET were processed in the same MNI space. ePET images in the MNI space were intensity normalized using the same reference region as for pulsed ASL, resulting into standardized uptake value ratio (SUVr) maps.
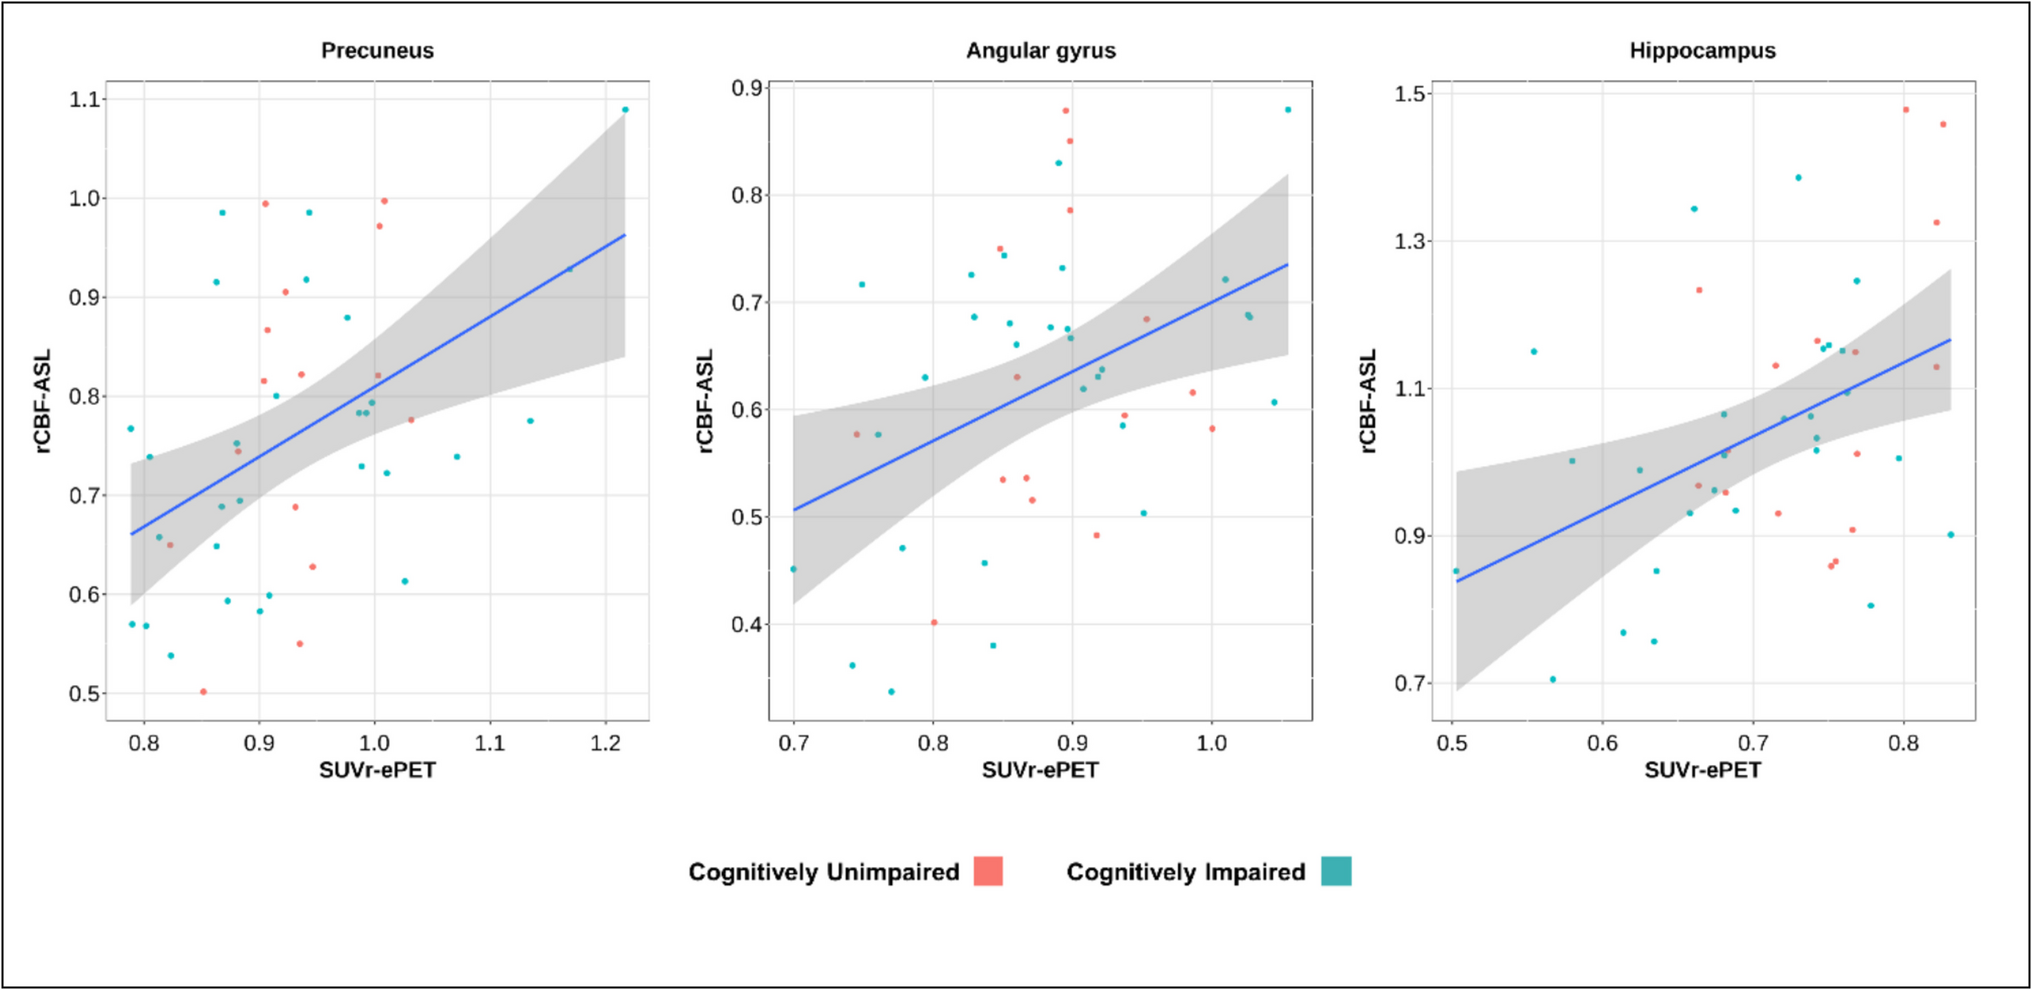
For each subject, we restricted the analysis of both maps to 17 anatomical regions selected from the Automated Anatomical Labeling Atlas (AAL3, Supplementary Fig. 1): 11 cortical areas (superior frontal, superior parietal, posterior cingulate, precuneus, superior temporal pole, superior temporal, inferior temporal, middle temporal, insula, angular gyrus, calcarine) and 6 subcortical areas (amygdala, hippocampus, caudate, pallidum, putamen, thalamus). Moreover, we extracted a composite mask including typical AD hypometabolic regions (metaROI) [25, 26].
Statistical analysis
Demographics and clinical information are reported as mean ± standard deviation. We considered outliers of the rCBF values if the values were above or below two standard deviations from the mean and consequently removed the brain region. To evaluate the association between rCBF and SUVr, we performed multiple linear regression models between ASL and ePET measurements corrected by age across the 18 brain regions, correcting for multiple comparisons using the Bonferroni-Holm (BH) method. In addition, to compare the replicability of both techniques, we have calculated the within-subject coefficient of variation (wsCV) for each region. To guarantee that both ASL and ePET measurements have the same range in the wsCV calculation and Bland–Altman plots, they were standardized according to the respective mean. The wsCV was calculated by first determining the standard deviation of the difference between rCBF and SUVr for each subject and then dividing this by the mean of those differences. The resulting value was multiplied by 100 to express the wsCV as a percentage, indicating the relative variability between rCBF and SUVr. The differences between CU and CI in both rCBF and SUVr in the aforementioned 18 regions were tested using linear regression models adjusted by age. We set the alpha value for 5%; thus, we considered statistically significant results if p < 0.05.

Comments (0)