Assessment of expected metformin efficacy in reducing the hepatic glucose output
In this work, we predicted the effect of metformin treatment on central hepatic metabolic functions in juvenile MASLD patients using an elaborated and validated kinetic model of human liver metabolism. The credibility of our kinetic model HEPATOKIN1 for model-based predictions of changes in liver metabolism has so far been substantiated by experimental and clinical data in several applications [16, 17, 23,24,25].
As the treatment of adolescents with metformin is controversial because of possible side effects and limited success [4], a patient-specific in silico assessment of the expected efficacy of metformin treatment may be an important assistance for the physician's final decision to start treatment with metformin. Therefore, our study pursued two objectives: (i) To assess how metformin may impact on central metabolic functions of the liver and (ii) to demonstrate the usefulness of physiologically based metabolic models for the pre-screening of patients concerning the efficacy of a planned drug therapy.
Our analysis showed that the metabolic changes induced by metformin in the liver of adolescent patients with MASLD vary to a large extent. The average reduction in the 24 h hepatic glucose output achieved by a normal single daily dose was 19% in our paediatric cohort. This reduction rate is in line with data reported in the literature. Direct measurement of the hepatic glucose output in nine adult T2DM patients using 13C nuclear magnetic resonance spectroscopy yielded an average reduction of 24% after three weeks of metformin treatment, resulting in an average lowering of the fasting plasma glucose level by 30% [26]. Other studies reported a reduction of the HGP between 15 and 30% [27, 28]. Approximately 15% of our patients were predicted to be non-responders, with metformin-induced reductions in liver glucose output being less than 15% of the cohort mean. It should be noted that the large variability of the computed individual responses to metformin is exclusively due to individual differences in the protein levels of metabolic enzymes, which we used to scale the maximal enzyme activities.
Assessment of expected metformin efficacy in reducing hepatic triglyceride storage
A number of vivo studies in genetically modified mice or dietary models of MASLD rats or mice have demonstrated the effectiveness of intrahepatic lipid reduction by metformin. However, there are also a few contradictory reports (for details, see the review in [12]). The results of our computational study did not provide evidence for a significant lipid-lowering effect of metformin. However, it should be noted that the anti-steatotic effect observed in animal models was attributed to effects of metformin which are not included in our model. These effects include the activation of transcription factors such as TFEB or Stat3, which control autophagy in hepatocytes and thereby lower the abnormal cellular lipid content.
Temporary impairment of central metabolic liver functions
Due to the short plasma elimination time of metformin, all changes in hepatic metabolism occur only transiently during the first 4–6 h after drug ingestion. When averaged over a full 24-h period, of all the metabolic variables included in our comprehensive model, only the intended reduction of glucose output and the parallel reduction in lactate uptake were significant. However, a significant reduction in hepatic energy metabolism, urea formation, ketone body production and cytosolic/mitochondrial redox potentials was predicted for a time period of about four hours after the administration of metformin. (see Table 1). It is beyond the scope of this study to determine whether these transient reductions in central liver function should lead to dietary and physical activity recommendations for patients on metformin therapy.
Lactate increase as an indicator of metformin efficacy?
As shown in Fig. 4, an approximately linear relationship was observed between the extent of metformin-induced reduction of the hepatic glucose output and lactate uptake. This fact could potentially be used to determine the efficacy of metformin on hepatic metabolism by measuring under standardized conditions (daytime, overnight fasting) the rise of the plasma lactate level within one hour after administration.
Metformin’s mode of action
A reliable model-based simulation of metformin effects in liver metabolism requires knowledge of the enzymes affected by the drug and the kinetic parameters relevant to this effect (e.g. IC50 values). Due to its broad use in the treatment of T2DM, there are numerous studies on the molecular basis of metformin, particularly in liver metabolism. It seems certain that the main effect is the inhibition of GPD2, which leads to an inhibition of gluconeogenesis and a shift in the cytosolic redox potential [26]. The originally favoured inhibition of complex 1 of the respiratory chain is now considered less likely due to the high IC50 value, which is far above the plasma concentration of metformin. Nevertheless, this potential mechanism has also been included in the model. In our simulations, we assumed a rapid equilibration of the metformin concentration between plasma, cytosol, and mitochondrial matrix. However, the exchange rate of metformin between cytosol and mitochondrial matrix is not known. Several authors have hypothesized that metformin accumulates in mitochondria (see e.g. [7, 20]. If so, the Nernst equation indicates that for a physiological mitochondrial membrane potential of −180 mV, the thermodynamic equilibrium is reached after a 1,000-fold accumulation of a positively charged molecule if the molecule has one charge. Since metformin is a positively charged molecule and assuming the presence of a still unknown carrier for metformin in the inner membrane, its mitochondrial concentration would reach the millimolar range despite a cytosolic concentration within the micromolar range [5]. In addition, assuming a plasma membrane potential of −36 mV and the absence of kinetic constraints on metformin transporters (OCT and MATE), the cytosolic concentration of metformin would be four times that of plasma. This however seems highly unlikely, as effective concentrations in the mM range would strongly inhibit the respiratory chain complex I (Ki = 0.5 mM) and thus be highly toxic.
Inferring the metformin response from clinical data
The inclusion of paediatric patients with different degrees of insulin resistance (IR) made it possible to relate the metformin-induced reduction of the hepatic glucose output (ΔGlu24) to a large panel of clinical parameters used to assess the severity of MASLD and dysregulation of the glucose metabolism. For only two parameters, baseline plasma lactate and plasma insulin 60 min after oral glucose challenge (Ins60), a significant correlation with ΔGlu24 could be established. Increased values of at least one of these two parameters may suggest a higher glucose-lowering effect of metformin. Combining the two parameters by an “or” relation to classify our patients grossly as responders and non-responders yielded a sensitivity of 0.82 and a specificity of 0.70. Hence, plasma lactate values higher than 8 mg/dl or plasma insulin values higher than 400 mU/l at 60 min after a glucose challenge may serve as fairly useful indicators for an above-average hepatic response to metformin.
Interestingly, although both HOMA-IR and Ins60 are clinically accepted parameters for the diagnosis of diabetes and prediabetes, respectively, only Ins60 showed a significant correlation with Glu24. We explain this discrepancy by the fact that increased fasting plasma glucose and plasma insulin levels are caused by IR in various organs (liver, spleen, muscles, adipose tissue), whereas the increase in plasma glucose and thus plasma insulin after glucose challenge is primarily determined by the capacity of the liver to take up most of the glucose during the first passage. This is supported by studies on the diagnostic significance of the glucose tolerance test for the evaluation of metabolic liver function [29].
Limitations of the approach
A necessary prerequisite for the application of our method is the availability of protein abundance data for liver enzymes, commonly determined in a biopsy sample. It also has to be noted that the presented approach enables only the prediction of short-term metformin effects as drug-induced transcriptional changes [30] would require repeated re-scaling of the model with protein expression data obtained at different time points after the start of the therapy.
Our study operates under the assumption of a uniform metformin distribution across the liver, which may not accurately reflect local variations in microstructure attributable to differences in steatosis, fibrosis, or blood flow. Additionally, liver zonation, which refers to the variability in hepatocyte function based on localization along the liver acinus, could further contribute to heterogeneity, especially considering the zonation of glucose metabolism [25, 31]. Moreover, we analysed the effects of metformin administration at a predefined time point (6 h in the morning). The impact of varying this timing, especially in relation to the diurnal fluctuations in plasma glucose levels, has yet to be explored.
Insulin resistance (IR), i.e. insufficient glucose uptake by cells after insulin stimulation, primarily affects adipose tissue, muscles and liver. For our patients, the relative contribution of the liver to IR was not known and was therefore not considered in the transfer function of the model, which determines the phosphorylation level of key enzymes in dependence of the plasma insulin level.
For all patients, the same diurnal standard plasma profile of metabolites and hormones was used. Very likely, individual differences in the plasma profile of nutrients and hormones will further increase the predicted metabolic variability in metformin response.
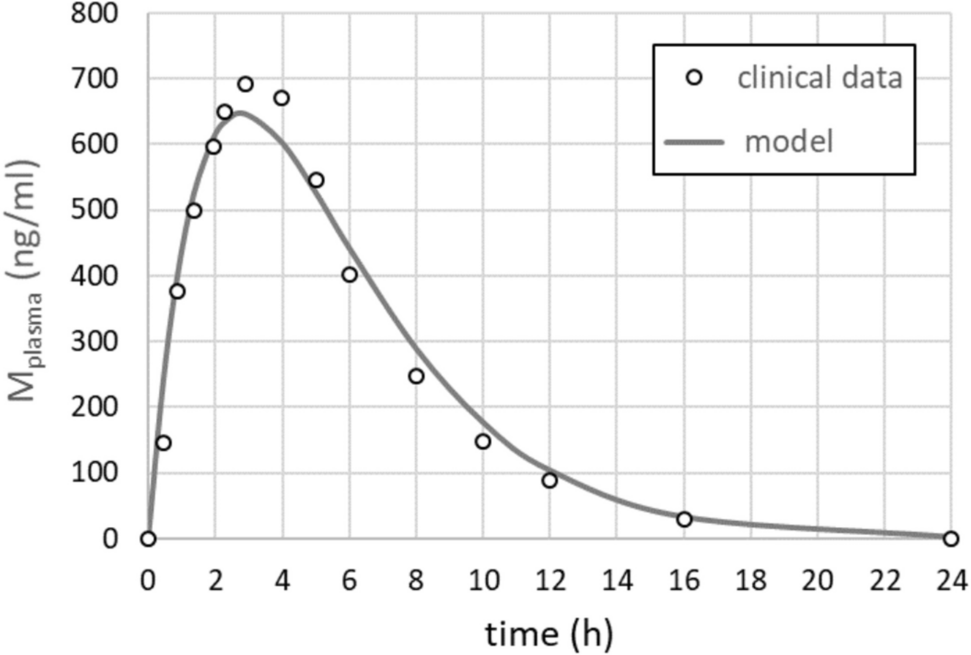
As metformin plasma profiles for children and adolescents are not available, we took the 24 h—mean plasma profile determined by Mak et al. [19] as model input for all patients of our cohort. Individual deviations from this standard profile due to differences in the metabolization capacity of the liver (CYP2 C11 und CYP2D1), secretion capacity of the kidney and the total plasma volume will influence the results of our calculations, but a quantitative assessment of such effects was not possible in this study due to the lack of the corresponding data.
Our model-based method allows an estimation of the short-term effect of metformin on the glucose output of the liver while it does not account for systemic effects caused by extrahepatic mechanisms such as its impact on other organs or gut microbiome. For example, a glucose-lowering gut-liver crosstalk has been described which is based on higher plasma lactate and acetate levels [32]. Such effects could, in principle, be incorporated by direct measurement of nutrients and hormones in the blood of the individual patients. Additionally, long-term transcriptional adaptations to metformin treatment were not considered, as they would require dynamic proteomic data across multiple time points. Future work should aim to expand the current model by integrating gut-liver interactions and longitudinal patient data to capture the full spectrum of metformin's metabolic effects.

Comments (0)