
Remember me

Informed consent from all patients providing peripheral blood samples or synovial fluid was obtained. The analysis of human materials was approved by the Ethics Committee of Shanghai Ninth People’s Hospital, Shanghai Jiao Tong University School of Medicine (SH9H-2024-T246-1). The patients with RA fulfilled the 2010 ACR/EULAR criteria for RA.46 Peripheral blood samples were obtained from the Department of Laboratory Medicine at Shanghai Ninth People’s Hospital. Synovial fluid samples were collected from the Orthopedic Specimen Bank at Shanghai Ninth People’s Hospital. These included RA patients diagnosed by the Department of Rheumatology and referred to the Department of Orthopedics for knee replacement surgery, as well as OA patients admitted to the Department of Orthopedics for knee replacement surgery. Demographics and clinical features of patients involved in the collection are listed in Tables S1–S3.
MiceTet2−/− (JAX stock no. 023359) and Irg1−/− (JAX stock no. 029340) mice were purchased from the Jackson Laboratory. TNF-Tg (Cyagen stock no. C001250) mice were purchased from Cyagen. The animals were backcrossed onto C57BL/6J (Cyagen stock no. C001089) backgrounds, respectively, for more than seven generations. DBA/1J mice were purchased from GemPharmatech (stock no. N000219). All mice were used for analysis regardless of sex. All mice were housed in pathogen-free conditions with constant ambient temperature (22 °C ± 2 °C) and humidity (55% ± 10%), with an alternating 12-h light/dark cycle. All mice were euthanized by carbon dioxide overdose followed by cervical dislocation. All animal studies were approved by the Institutional Animal Care and Use Committee at Ninth People’s Hospital, School of Medicine, Shanghai Jiao Tong University (SH9H-2024-A1288-1).
CIA model and ITA/OI interventionCIA model was performed according to a previously published protocol.47 Briefly, 8-week-old DBA/1J mice were immunized intradermally at the base of the tail with 100 μg of Chicken type II collagen (Chondrex,20012) emulsified in complete Freund’s adjuvant (Chondrex, 7009) in equal volumes. Twenty-one days later, a booster immunization was performed using 100 μg of Chicken type II collagen in incomplete Freund’s adjuvant (Chondrex, 7002). For 8-week-old C57BL/6J mice, both the initial and booster immunizations were administered subcutaneously, using 200 μg of Chicken type II collagen emulsified in complete Freund’s adjuvant (Chondrex, 7023).48 Clinical score was assessed after the booster immunization using the following system detailed previously: 0, normal; 1, mild, but definite redness and swelling of the ankle or wrist, or apparent redness and swelling limited to individual digits, regardless of the number of affected digits; 2, moderate redness and swelling of ankle or wrist; 3, Severe redness and swelling of the entire paw including digits; 4, maximally inflamed limb with involvement of multiple joints. The scores of all four limbs were summed, yielding total scores of 0 to 16 per mouse. Regarding the treatment of CIA animals, Itaconate (Sigma, I29204) and OI (MCE, HY-112675) was first dissolved in DMSO (100 mg/mL) (MCE, HY-Y0320) and further diluted with 40%((2-Hydroxypropyl)-β-cyclodextrin) in PBS to a final concentration of 10 mg/mL. DBA/1 mice were administered OI at 100 mg/kg or vehicle every other day by i.p. injection.
μCT analysisμCT analysis of fixed tibia or rear paw was conducted using a Skyscan 1176 (Bruker) at 50 kV, 100 μA, and a resolution of 9 μm. The acquired images were reconstructed with NRecon softwarev1.7 (Bruker). The region from 50 to 250 slices below the growth plate was analyzed for BV/TV, Tb.Th, Tb.N, and Tb.Sp using the program CTAn v1.16 (Bruker). Six sites in the ankle joint were evaluated: the talus, navicular bone, medial cuneiform bone, and the bases of the first, second, and third metatarsals. Each site was rated on a scale from 0 to 3 (0 = normal; 1 = pitting; 2 = full-thickness holes in small to medium areas; and 3 = full-thickness holes in medium to large areas), with a maximum total score of 18. The final erosion score for the arthritic hind paw was obtained by averaging the scores assigned by two observers.49 We used ankles for μCT analysis because, in human patients with RA, official radiographic quantification of bone erosion (Sharp score) is typically performed on the wrists or ankles.
Histological staining and immunofluorescence stainingFor hard tissue sections, the mice were intraperitoneally injected with 8 mg/kg calcein solution at 10 weeks of age and 20 mg/kg alizarin red at 11 weeks of age. At 12 weeks, the mice were euthanized, and their femurs were harvested. The femurs were not decalcified and were embedded in methyl methacrylate (MMA) resin.50 Sections were cut to a thickness of 5 μm using a Leica RM2255 microtome (Leica) and used for Von Kossa and TRAP staining. Blank sections were utilized for the analysis of double fluorescence labeling. For decalcified paraffin-embedded sections, the tissue was first fixed in 4% paraformaldehyde. After routine fixation, the samples were decalcified in 10% EDTA (pH 7.4) for 2 weeks. Following decalcification, the samples were processed for paraffin embedding and were then cut into sections with a thickness of 4 μm using a Leica RM2255 microtome. HE and TRAP staining were performed according to the manufacturer’s protocols for histological evaluation of the ankl joints in mice.
In vitro differentiation of macrophages and osteoclastsBMMs were extracted by flushing the femurs and tibias of 4 to 6-week-old WT, Irg1−/−, or Tet2−/− mice on a C57BL/6J background and cultured in alpha-modified Eagle’s medium (α-MEM, Hyclone, SH30265.01) containing 10% FBS (Hyclone, SH30406.05) and 1% penicillin-streptomycin (NCM Biotech, C100C5). Cell viability was maintained with 50 ng/mL recombinant mouse M-CSF (SinoBiological, 51112-MNAH). For macrophage activation, BMMs were cultured in complete medium supplemented with 100 ng/mL LPS (Sigma, L2880) or 100 ng/mL recombinant TNF-α (SinoBiological, 50349-MNAE). For osteoclast induction, BMMs were cultured in complete medium containing 50 ng/mL recombinant mouse M-CSF and 100 ng/mL recombinant mouse RANKL (SinoBiological, 50343-M01H).
For all the cultures, media was changed every two days until indicated timepoints. For the TRAP staining experiment, BMMs were seeded at a density of 8 000 cells/well in a 96-well plate and induced to differentiate into osteoclasts for five days. The cells were then stained with Tartrate-Resistant Acid Phosphatase Dye (JoyTech, 1-0002) and photographed. For the bone resorption assay, BMMs were seeded at a density of 8 000 cells/well on Osteo Assay Surface plates (Corning, 3988) or bovine bone slices (JoyTech, 2-0002) and induced to differentiate into osteoclasts for seven days. Images were captured using a bright-field microscope or scanned with a scanning electron microscope.
Human monocytes cultureHuman monocytes were isolated PBMCs of RA patients by density gradient centrifugation using Ficoll-PaqueTM PLUS (Cytiva, 17-1440-02) and overnight adhesion in 12-well plates in RPMI 1640 medium (Hyclone, SH30809.01) containing 10% FBS and 1% penicillin-streptomycin. Cultured monocytes were treated with Phorbol 12-myristate 13-acetate (PMA, MCE, HY-18739) 5 ng/mL for 24 h to induce their differentiation into RA-MDMs. Afterwards, cultured RA-MDMs were treated with or without 100 μmol/L OI for 12 h for RT–qPCR analysis or 24 h for flow cytometry analysis.
Flow cytometryMouse synovial tissues were isolated from knee joints, digested with 1 mg/mL type I collagenase (Sigma, C0130) in HBSS (Gibco, C14175500BT), and incubated at 37 °C and 5% CO2 under gentle shaking for 1 h. Disaggregated tissue elements were passed through a 70 µm cell strainer. Single-cell suspensions from mouse tissues and in vitro culture were stained with Fixable Viability Stain 780 (FVS780, BD Biosciences, 565388) and indicated fluorochrome-conjugated antibodies against cell-surface markers including Brilliant Violet 421™ anti-mouse F4/80 Antibody (BioLegend, 123131), Brilliant Violet 510™ anti-mouse CD45 Antibody (BioLegend, 157219), FITC anti-mouse/human CD11b Antibody (BioLegend, 101205), PE Rat Anti-Mouse CD86 (BD Biosciences, 553692), Brilliant Violet 421™ anti-mouse/human CD11b Antibody (BioLegend, 101235) and FITC anti-human CD86 Antibody (BioLegend, 374203). For staining intracellular markers, including Alexa Fluor® 647 Rat Anti-Mouse CD206 (BD Biosciences, 565250) and APC anti-human CD206 (MMR) Antibody (BioLegend, 321109), the Cytofix/Cytoperm™ Fixation and Permeabilization Solution (BD Biosciences, 554722) was used after surface marker staining. Data were acquired using Cytek® Aurora (Cytek Biosciences) and analyzed using FlowJo v10.9.0 (BD Biosciences).
RNA-sequencingTotal RNA from osteoclasts differentiated for three days and mouse hind paw tissues was extracted and purified with the RNeasy Mini Kit (QIAGEN, 74104). Sequencing was performed at BGI and Majorbio. Differential gene expression analysis between groups was conducted using DESeq2,51,52 with criteria of Fold Change ≥ 2 and Adjusted P value ≤ 0.001, depending on the project. For between-sample differential gene analysis, PoissonDis was used with conditions of Fold Change ≥ 2 and FDR ≤ 0.001. A heatmap of differentially expressed gene clusters was generated using the heatmap function. Based on GO and KEGG annotations, differentially expressed genes were functionally classified. KEGG enrichment analysis was performed using the phyper function in R, and GO enrichment analysis was done with the TermFinder package. Candidate genes with a Q value ≤ 0.05 were considered significantly enriched.
Single-cell RNA-seq data processingRaw data consisting of 314 011 cells were downloaded from Synapse (https://doi.org/10.7303/syn52297840).27 Quality control and preprocessing were performed using established bioinformatics tools to ensure data integrity. Following this, data normalization, dimensionality reduction, and clustering analyzes were conducted referencing the strategy outlined in the original publication. Differential expression analysis and functional enrichment analysis were employed to identify key genes and pathways, shedding light on biological processes and cellular heterogeneity. The results were visualized using various visualization tools to provide comprehensive insights into the data. The results published here are in whole or in part based on data obtained from the ARK Portal (arkportal.synapse.org).
MetabolomicsThe metabonomic analysis of synovial fluid was performed by Metabo-Profile Biotechnology Co. Ltd, China, using the commercial Q300 Kit (Metabo-Profile) following the standard processing protocol.53 Internal standards were added to the derivatized samples, which were then randomly analyzed and quantitated using an ultra-performance liquid chromatography coupled to tandem mass spectrometry (UPLC-MS/MS) system. The raw data generated were processed using the QuanMET v2.0.
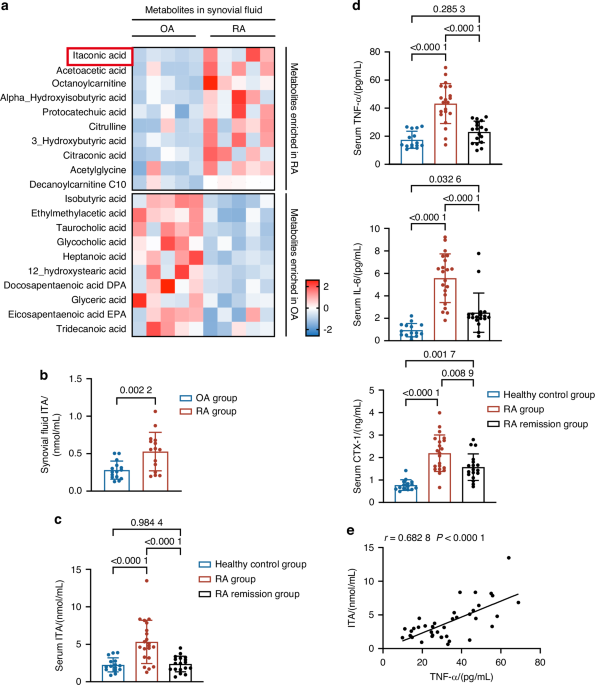
LC–MS/MS and GC-TOFMSThe cell and cell supernatant extracts were analyzed using an ultra-high performance liquid chromatograph (Acquity UPLC I-Class, Waters) coupled to a triple quadrupole mass spectrometer (Xevo TQ-XS, Waters). C13-labeled ITA was added as an internal standard. The data were analyzed using MassLynx v4.2. Serum and synovial fluid were analyzed by a gas chromatograph (7890, Agilent) coupled to a time-of-flight mass spectrometer (Pegasus 4D, LECO). The data were processed with ChemStation vC.01.07.
RNA purification and RT–qPCRTotal RNA from cells was extracted and purified using the RNeasy Mini Kit (QIAGEN). RNA was reverse transcribed using the PrimeScript™ RT Reagent Kit (TaKaRa, RR037). The diluted complementary DNA (cDNA) was used in RT-qPCR reactions containing TB Green® Premix Ex Taq™ (TaKaRa, RR420) and gene-specific primers. The reactions were performed on a QuantStudio 6 Flex real-time PCR system (Applied Biosystems). β-Actin was used as a housekeeping control. The primers are listed in Table S4.
Western blotCells were collected and lysed in RIPA buffer (Beyotime, P0013C) supplemented with protease inhibitors. Protein samples were subjected to separated on 4%–20% ExpressPlus™ PAGE Gel (GenScript, M42015C), transferred to PVDF membranes (Millipore, ISEQ00010), and blocked with 5% non-fat milk. Overnight incubation was performed at 4 °C with primary antibodies: IRG1 antibody (1:1 000, Abcam, ab222411), MMP9 antibody (1:1 000, Abcam, ab228402), Cathepsin K antibody (1:1 000, Abcam, ab37259), ACP5 antibody (1:1 000, Affinity, DF6989), and β-actin antibody (1:1 000, Affinity, T0022). Following primary antibody incubation, the membranes were probed with secondary antibodies for detection: Mouse IgG, HRP-linked antibody (1:5 000, CST, 7076) and Rabbit IgG, HRP-linked antibody (1:5 000, CST, 7074). Imaging was performed using e-BLOT Touch Imager (eBLOT).
ELISAPeripheral blood from humans was centrifuged at 2 000 × g for 30 min, and the serum was collected and stored at −80 °C for subsequent experiments. Human CTX-1(Elabscience, E-EL-H0835), human TNF-α (Elabscience, E-EL-H0109), and human IL-6 (Elabscience, E-EL-H6156) were measured according to the manufacturer’s protocols.
DNA dot-blotThe DNA dot blot assay was conducted as previously described with some modifications.54,55 Briefly, genomic DNA was extracted from osteoclasts and denatured at 95 °C for 10 min. The DNA was then spotted onto a nitrocellulose membrane (Whatman). The membrane was subjected to UV light for 30 min to cross-link the DNA and subsequently stained with 0.03% methylene blue solution. After blocking with 5% non-fat milk in TBS–Tween 20 for 1 h, the membrane was incubated overnight at 4 °C with 5hmC antibody (1:500, Active Motif, 39769). Following incubation with Rabbit IgG, HRP-linked antibody (1:5 000, CST, 7074) for 1 h at room temperature, the membrane was scanned using a Typhoon scanner (GE Healthcare).
TET2 in vitro activity assayThe Epigenase 5mC-Hydroxylase TET Activity/Inhibition Assay Kit (Epigenase, P-3086-96) was used following the manufacturer’s protocol to assess TET2 enzyme activity. Briefly, 4 μg of nuclear extracts in a 4 μL volume were added to a 50 μL total reaction mixture. After incubating at 37 °C for 90 min, the absorbance was measured at 450 nm.
hMeDIP-qPCRGenomic DNA was extracted from the samples using a standard phenol-chloroform extraction method as described.56 Genomic DNA was sonicated (320 W, 5 min), denatured at 95 °C for 10 min, and immunoprecipitated with 2 μg/mL 5hmC antibody (Active Motif, 39769) or 2 μg/mL Rabbit IgG, monoclonal [EPR25A]—Isotype Control (Abcam, ab172730) overnight at 4 °C with gentle rotation. Subsequently, 50 µL of Pierce Protein G agarose (Thermo Fisher, 20399) was added to the antigen-antibody complex and incubated with gentle rotation for 2 h at room temperature. After washing with PBS, immune complexes were eluted with 100 µL of 0.2 mol/L glycine HCl buffer (pH 3.0) and neutralized with 10 µL of 1 mol/L Tris (pH 8.0). DNA was then extracted using QIAquick PCR Purification Kit (QIAGEN, 28004) and analyzed by qPCR. The primers used are listed in Table S3.
Statistical and reproducibilityAll statistical analyzes were performed using GraphPad Prism software v8.0 (GraphPad Software) and are presented as mean ± standard deviation (SD). Comparisons between two groups were made using unpaired two-tailed t-test or paired two-tailed t-test, while comparisons among three or more groups were made using Kruskal–Wallis test, one-way analysis of variance (ANOVA), or two-way ANOVA. Statistical results are indicated by P values in the figures, and P < 0.05 was considered statistically significant. Unless otherwise stated, all experiments were repeated in triplicate or more (Fig. 6).
Fig. 6
Schematic summary of TNF-α-driven macrophage-derived ITA in suppressing RA-associated osteoclast hyperactivation through Tet2 inhibition
Comments (0)