
Remember me
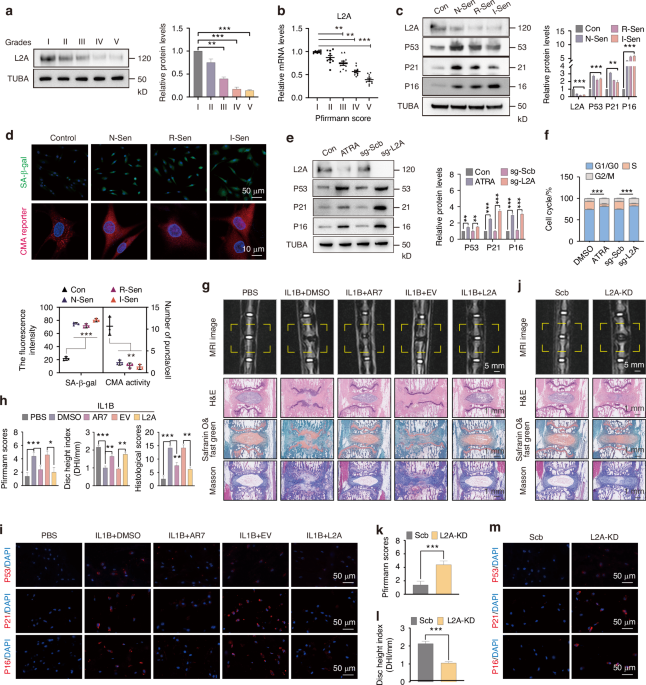

To investigate the CMA levels during IDD, we detected the expression of LAMP2A (L2A) in degenerated human disc samples. The results showed that the protein and mRNA levels of L2A decreased with the severity of IDD (Fig. 1a, b). We used MDM2 inhibitor (nutlin-3a, N-Sen) and inflammatory factor (IL1B, I-Sen) to induce NPC senescence, and used replicative cell senescence (Passage 9, R-Sen) as a positive control. The results showed that the expression levels of L2A were significantly decreased in N-Sen, I-Sen, and R-Sen, accompanied by increased expression of senescence-related proteins TP53/P53, CDKN1A/P21, and CDKN2A/P16 (Fig. 1c), indicating that CMA is inhibited in senescent NPC. At the same time, there was an increase in SA-β-gal activity and a decrease in CMA activity in the NPC of N-Sen, I-Sen and R-Sen groups (Fig. 1d). We further explored the role of CMA in maintaining the youthful state of NPC, and found the expression levels of senescence-related proteins (P53, P21 and P16) were increased in NPC treated with CMA inhibitor ATRA or sg-L2A transfection (Fig. 1e). At the same time, CMA inhibition promoted cell cycle arrest, as manifested by a decrease in the proportion of NPC in S phase (Fig. 1f). We further studied the effect of CMA activation on IDD induced by IL1B in the caudal disc of rats. MRI and histological staining showed that local injection of IL1B after 8 weeks induced disc degeneration (Fig. 1g, h). By co-injecting CMA activator AR7 or L2A overexpression lentivirus, the IDD degree was alleviated, represented by the decreased Pfirrmann scores, restored disc height (DHI), and reduced histological scores (Fig. 1g, h). Through the fluorescence intensity analysis of senescence-related proteins (P53, P21, and P16), we found that CMA activation improved NPC senescence induced by IL1B (Fig. 1i, S1a). In addition, local injection of AR7 or L2A lentivirus can also exert a protective effect in the rat IDD model induced by needle puncture (Fig. S1b). Further, we explored the effect of L2A knockdown (L2A-KD) on the progression of IDD. The results showed that local injection of sh-L2A lentivirus for 8 weeks induced IDD of rats, manifested by increased Pfirrmann and histological scores, and decreased DHI (Fig. 1j–l, S1c). Tissue immunofluorescence showed that the expression levels of P53, P21, and P16 in intervertebral disc cells were significantly increased after L2A-KD (Fig. 1m, S1d). In conclusion, these results suggest that CMA activity is crucial for maintaining the youthful state of the intervertebral disc.
Fig. 1
CMA is essential for maintaining the youthful state of the nucleus pulposus. a, b The protein and mRNA levels of L2A (LAMP2A) in human intervertebral discs with different degeneration grades. c The protein levels of L2A, P53, P21, and P16 in different senescent NPC models, N-Sen (Nutlin-3a-induced senescence), R-Sen (Replicative senescence, passage 9), and I-Sen (IL1B-induced senescence). d Immunofluorescence shows the levels of SA-β-gal and CMA activity in different senescent NPC models. CMA activity is represented by the average number of red spots per cell. e The protein levels of L2A, P53, P21, and P16 in NPC treated with ATRA or sg-L2A transfection. f Flow cytometry results of the cell cycle of each group. g The effect of CMA activation on IL1B-induced IDD. MRI imaging and histological staining were performed after sampling. h The grade of IDD in each group was evaluated by Pfirrmann scores, DHI, and histological scores, as described before.77i Immunofluorescence showing levels of P53, P21, and P16 in the rat discs. j–l The effect of L2A-KD on rat IDD, evaluated by Pfirrmann grading and DHI. m The effect of L2A-KD on in vivo levels of P53, P21, and P16. All graphs show the mean ± SEM of at least three independent experiments. *P <0.05, **P <0.01, ***P <0.001
Elevated DYRK1A drives senescence in CMA-downregulated NPCTo explore the mechanism by which CMA inhibition drives NPC senescence, we silenced CMA function using sg-L2A and performed TMT-labeled mass spectrometry analysis. The construction of sg-L2A targets a specific sequence of L2A without affecting the gene expression of other LAMP2 isoforms (Fig. S1e, f). Mass spectrometry screening results showed that DYRK1A, a pathogenic gene for human trisomy 21 Down syndrome, was significantly increased after L2A-KO (Fig. 2a). The gene encoding DYRK1A is located in the critical region for Down syndrome on human chromosome 21. The protein is 763 amino acids long and contains the classic CMA targeting sequence 201QIEVR205 (Fig. 2b). DYRK1A levels were increased in several CMA inhibition conditions (Fig. 2c). However, the mRNA level of DYRK1A was not affected (Fig. S1g). Immunofluorescence showed that the expression level of DYRK1A was increased after L2A-KO (Fig. 2d). After IL1B treatment, the expression of L2A was inhibited in NPC, accompanied by increased senescence-related proteins (P53, P21, and P16). DYRK1A levels were also increased after IL1B treatment (Fig. 2e), but they were decreased in I-Sen NPC after AR7 treatment or L2A overexpression (Fig. S1h). Notably, the use of DYRK1A inhibitor Harmine (Har) rescued NPC senescence caused by IL1B or L2A-KO (Fig. 2e). At the same time, cell cycle arrest caused by IL1B or L2A-KO was also inhibited by Harmine (Fig. 2f). The detection of BrdU showed that NPC proliferation was inhibited by IL1B or L2A-KO, while Harmine partially restored this process (Fig. 2g). We found that the increased expression of SA-β-gal induced by IL1B or sg-L2A transfection was reversed by Harmine (Fig. 2h). RT-qPCR results showed that IL1B or L2A-KO increased the mRNA levels of senescence-related proteins (P53, P21, P16) and SASP inflammatory factors (IL1B, IL6, IL-8), while the addition of Harmine inhibited these increases (Fig. S2a, b). By stably transfecting DYRK1A, we found that the expression of senescence-related proteins (P53, P21, and P16) in NPC was increased, but this effect was inhibited after co-transfection of L2A or AR7 co-treatment (Fig. 2i). At the same time, overexpression of DYRK1A also led to cell cycle arrest in NPC. Overexpression of L2A or co-treatment of AR7 can reverse the cell cycle arrest caused by DYRK1A overexpression (Fig. 2j, k). In addition, L2A overexpression could alleviate the activation of SA-β-gal in NPC caused by DYRK1A overexpression (Fig. 2l). Similarly, DYRK1A overexpression promoted the mRNA levels of senescence-related proteins (P53, P21, P16) and SASP inflammatory factors (IL1B, IL6, IL-8), which were reversed by co-overexpression of L2A or AR7 co-treatment (Fig. S2c, d). In rat models, local overexpression of DYRK1A also accelerates IDD progression, while L2A co-expression inhibits this process (Fig. S2e, f). In rat intervertebral disc tissue, lentiviral-mediated overexpression of DYRK1A upregulated the expression of senescence-associated proteins, including P53, P21 and P16, while overexpression of L2A ameliorated this aging phenotype (Fig. S2g, h). The NF-κB signaling pathway is a known pathway regulating NPC senescence and SASP activation in IDD.32 We wondered whether the mechanism by which CMA regulates NPC senescence through DYRK1A involves this canonical senescence pathway. Our results showed a significant decrease in the level of IKBA protein in NPC after DYRK1A overexpression (Fig. S3a). Concomitantly, immunofluorescence assays revealed an increase in RelA nuclear translocation (Fig. S3b), indicating that the NF-κB pathway was activated by DYRK1A overexpression. Notably, L2A overexpression rescued the DYRK1A-induced decrease in IKBA levels and inhibited RelA nuclear translocation, thereby suppressing NF-κB pathway activation (Fig. S3a, b). Collectively, our findings demonstrate that the senescence of NPC induced by CMA inhibition is associated with upregulation of DYRK1A, and DYRK1A-induced senescence of NPC can be ameliorated through either pharmacological inhibition of DYRK1A or activation of CMA.
Fig. 2
Elevated DYRK1A drives premature senescence in CMA-downregulated NPC. a TMT-MS analysis showing that DYRK1A levels were increased in NPC after L2A knockout. b Schematic diagram of the sequence of DYRK1A. c The protein level of DYRK1A in NPC treated with ATRA, si-L2A, or sg-L2A. d Immunofluorescence shows the level of DYRK1A in NPC after L2A knockout. e Immunoblotting shows the levels of L2A, DYRK1A, P53, P21, and P16 in NPC treated as indicated. NPC were treated with IL1B (10 ng/mL, 48 h) and Har (Harmine, 20 μg/mL, 48 h). f Flow cytometry showing the cell cycle of NPC treated as indicated. The proportion of NPC in the S phase was used for comparison. g Relative BrdU levels of NPC treated as indicated, measured at 450 nm. h SA-β-gal fluorescence levels detected by Fluorescein diβ-D-galactopyranoside (FDG) in NPC treated as indicated. i Western blot showing the protein levels of DYRK1A and senescence markers in NPC of each group. j Flow cytometry showing the cell cycle changes of NPC treated as indicated. k Relative BrdU levels of NPC treated as indicated. l Immunofluorescence showing SA-β-gal levels in NPC after DYRK1A and L2A overexpression. All graphs show the mean ± SEM of at least three independent experiments. *P <0.05, **P <0.01, ***P <0.001
DYRK1A is a bona fide substrate of CMA in NPCTo further explore the degradation pathway of DYRK1A, we treated NPC with MG132 and Chloroquine (CQ). The results showed that the level of DYRK1A did not change in the MG132-treated group, while it was increased significantly after CQ inhibited lysosomal enzymes (Fig. 3a). At the same time, the level of DYRK1A in NPC was gradually increased at 4 h, 8 h and 12 h after CQ administration (Fig. S3c). Further, we treated NPC with the macroautophagy inhibitor 3-methyladenine (3MA) and its activator rapamycin (Rap), respectively. The results showed that the protein level of DYRK1A was not affected, indicating that DYRK1A is not regulated by macroautophagy (Fig. 3b). However, the level of DYRK1A was significantly decreased after NPC were treated with several CMA activation conditions, including AR7, QX77, and starvation treatments (Fig. 3c). Further experiments showed that only CQ, but not MG132, could rescue the reduction of DYRK1A induced by L2A overexpression (Fig. 3d). Next, we studied the level of DYRK1A in lysosomes. We treated NPC with AR7 or Rap and isolated their lysosomes, and found that DYRK1A was significantly increased in the lysosomes of NPC treated with AR7, while it was not affected in the Rap treatment group (Fig. 3e). As a positive control for macroautophagy, SQSTM1 in lysosomes was increased after Rap treatment, but was not significantly affected by AR7 (Fig. 3e). Another important feature of CMA substrates is their structural association with CMA elements. We performed colocalization analysis on the fluorescence images of DYRK1A and L2A, and found that the two had significant overlap (Fig. 3f). In the protein sequence of DYRK1A, we found not only the classic KFERQ-like sequence 201QIEVR205 (Fig. 2b), but also several other hypothetical sites that meet the conditions after phosphorylation or acetylation. After treatment with phosphorylase inhibitors and deacetylase inhibitors in NPC, we found that the binding of DYRK1A to HSPA8 or L2A was not affected, indicating that the CMA target sequence of DYRK1A was not regulated by these two post-translational modifications (Fig. 3g). Q-A mutation is usually an effective way to disrupt the binding of CMA substrates and HSPA8.33 Further, we performed a structural mutation of Q201A on 201QIEVR205 of DYRK1A and explored the reactivity of HA-Q201A under starvation conditions. Immunoprecipitation results showed that starvation reduced the level of HA-DYRK1A in the WT group, while the HA-DYRK1A level in the Q201A group was not affected (Fig. 3h). Similarly, in response to CQ, the WT group, but not the Q201A mutant group, showed blocked degradation of HA-DYRK1A (Fig. 3i). There was co-immunoprecipitation of L2A and DYRK1A in the WT group, and this binding was enhanced after starvation treatment (Fig. 3j). However, no binding of HA-DYRK1A to L2A was shown in the mutant group (Fig. 3j). In the WT group, but not in the Q201A mutant group, we detected co-immunoprecipitation of DYRK1A and HSPA8 (Fig. 3k, S3d). In summary, the above findings indicate that DYRK1A is a bona fide CMA substrate in NPC.
Fig. 3
DYRK1A is a bona fide substrate of CMA in NPC. a Western blot showing DYRK1A levels after MG132 (5 μmol/L) or Chloroquine (CQ, 20 μmol/L) treatment for 12 h. b Immunoblots showing DYRK1A and SQSTM1 levels in NPC treated with 3MA (5 mmol/L) or Rap (Rapamycin, 1 μmol/L) for 12 h. c Immunoblots showing DYRK1A levels in NPC treated with AR7 (50 μmol/L), QX77 (25 μmol/L), and starvation for 24 h. d Western blot showing DYRK1A levels in NPC after L2A overexpression or combined with CQ/MG132. e Western blot shows the levels of DYRK1A and SQSTM1 in lysosomes or cytoplasm of NPC treated with AR7 or Rap. f Immunofluorescence showing that L2A and DYRK1A colocalized in NPC. g Immunoprecipitation showing the effect of phosphatase inhibitors and deacetylase inhibitors on the levels of DYRK1A bound to HSPA8 or L2A in NPC. h Western blot showing the effect of starvation on HA levels in NPC transfected with WT or Q201A mutant HA-DYRK1A plasmids. i Immunoblotting shows the effect of CQ (20 μmol/L) on HA levels in NPC transfected with WT or Q201A mutant HA-DYRK1A plasmids. j Co-immunoprecipitation analysis shows the effect of starvation on the level of L2A bound by HA-DYRK1A in NPC transfected with WT or Q201A. k Co-immunoprecipitation results showing the level of HA-bound HSPA8 in NPC transfected with WT or Q201A mutant HA-DYRK1A. All graphs show the mean ± SEM of at least three independent experiments. *P <0.05, **P <0.01, ***P <0.001, ns indicates not significant
FOXC1 phosphorylated by DYRK1A enters the nucleus and initiates cell cycle arrest and premature senescence of NPCWe found that DYRK1A mediated NPC senescence under CMA inhibition. After overexpression of DYRK1A in NPC, GSEA analysis showed significant changes in KEGG pathways related to the cell cycle (Fig. 4a). The regulation of cell growth, development, and senescence by DYRK1A is primarily mediated through phosphorylation modification of transcription factors. To identify DYRK1A-associated proteins, we performed immunoprecipitation (IP) coupled with mass spectrometry (MS) analysis (Fig. 4b), followed by stringent screening to identify significant transcription factors (TF). Through integrated analysis of the IP-MS data, transcriptome data from NPC cells overexpressing DYRK1A, and the GO gene set associated with negative cell cycle regulation, we conclusively identified FOXC1 as the sole transcription factor meeting all the predefined criteria (Fig. 4c). From the aspect of protein structure, we performed molecular docking simulation and found that DYRK1A and FOXC1 have a tight structural binding (Fig. 4d). Meanwhile, PTM analysis of FOXC1 showed that phosphorylation was its most important post-translational modification, with up to 19 phosphorylation sites (>90%) (Fig. 4e). From the perspective of protein interaction, we examined that DYRK1A and FOXC1 were co-immunoprecipitated (Fig. 4f). Although DYRK1A level was increased after sg-L2A transfection, the overall level of FOXC1 was not affected significantly (Fig. 4f). After the phosphorylation binding was destroyed with phosphatase CIP, we found that DYRK1A-bound FOXC1 was significantly reduced (Fig. 4g). Next, we used dot blot to detect changes in FOXC1 phosphorylation levels. Immunoprecipitation showed that FOXC1 bound serine/threonine and tyrosine, and the phosphorylation level of FOXC1 also changed under CMA and DYRK1A inhibitors. After treatment with the CMA inhibitor ATRA, the total phosphorylation levels of FOXC1 were increased (Fig. 4h). After inhibiting DYRK1A activity with Harmine (Har), the overall phosphorylation levels of FOXC1 were decreased (Fig. 4h). This indicated that CMA-DYRK1A axis affected the phosphorylation level of FOXC1, which could subsequently affect the function and localization of FOXC1. Next, we performed nuclear-cytoplasmic separation to detect FOXC1 levels under L2A-KO or Harmine treatment. After L2A-KO, the level of FOXC1 in the nucleus was increased significantly, while the cytoplasmic level was decreased accordingly. It is worth noting that the combined treatment with Harmine reversed this effect (Fig. 4i). Cell immunofluorescence also showed that after L2A-KO, the nuclear translocation of FOXC1 was enhanced, while it was significantly inhibited after the function of DYRK1A was inhibited by Harmine, even below the initial level (Fig. 4j). Therefore, the phosphorylation degree of FOXC1 by DYRK1A could regulate the nuclear localization of FOXC1.
Fig. 4
FOXC1 phosphorylated by DYRK1A enters the nucleus and initiates cell cycle arrest and premature senescence of NPC. a GSEA analysis showing that cell cycle pathways were significantly enriched after DYRK1A overexpression in NPC. b IP-MS analysis showed that FOXC1 was enriched in the immunoprecipitated complexes of DYRK1A. c Cross-analysis of TF predicted by transcriptomic data of DYRK1A overexpression, IP-MS results, and GO gene sets that negatively regulate the cell cycle revealed that FOXC1 was the potential target. d Protein binding analysis of DYRK1A and FOXC1 by ZDOCK.78e PTM analysis of phosphorylation in FOXC1. f Immunoprecipitation blot showing that DYRK1A and FOXC1 were bound. g The effect of phosphatase CIP on the levels of DYRK1A-bound FOXC1. h Dot blots show the effect of ATRA and Har on the phosphorylation of FOXC1. i Immunoblots show the effect of L2A knockout or combined with Har on the nuclear and cytoplasmic distribution of FOXC1 in NPC. j Immunofluorescence showing the effects of sg-L2A and Har on the nuclear and cytoplasmic distribution of FOXC1 in NPC. k The effect of DYRK1A overexpression or combined with FOXC1 knockdown on the cell cycle of NPC. All graphs show the mean ± SEM of at least three independent experiments. *P <0.05, **P <0.01, ***P <0.001
Further, we studied the effects of FOXC1 under the regulation of DYRK1A on the cell cycle and senescence of NPC. After DYRK1A overexpression, the mRNA levels of cell cycle arrest markers (MKI67, PCNA, and p27) and cell senescence markers (P53, P21 and P16) in NPC were increased, while knockdown of FOXC1 rescued these changes (Fig. S3e, f). Similarly, knockdown of FOXC1 also inhibited the increase in SA-β-gal activity induced by DYRK1A overexpression (Fig. S3g, h). We utilized the infrared fluorescent tracker of SA-β-gal to track in vivo senescent cells in a live rat model. We found that DYRK1A overexpression for one month resulted in a significant promotion of SA-β-gal activation in the intervertebral disc of rats (Fig. S3i). Furthermore, local L2A overexpression or FOXC1 knockdown via lentivirus could reduce the levels of DYRK1A-induced SA-β-gal (Fig. S3i). Flow cytometric analysis revealed that si-FOXC1 rescued the cell cycle arrest of NPC induced by DYRK1A overexpression or L2A knockdown (Fig. 4k, S3j). Immunoblotting further demonstrated that DYRK1A overexpression or L2A knockdown significantly increased the expression of proteins associated with cellular senescence, and these effects were offset by FOXC1 gene silencing (Fig. S3k–m). In addition, while DYRK1A overexpression promoted the activation of NF-κB signaling, the canonical senescence pathway in IDD, as evidenced by increased nuclear translocation of RelA and reduced IKBA levels, FOXC1 knockdown was able to mitigate the effects of DYRK1A and suppress the activation of the NF-κB pathway (Figs. S3n, S4a). Lentiviral-mediated in vivo knockdown of FOXC1 effectively ameliorated rat IDD induced by DYRK1A overexpression, as evidenced by elevated disc height (DHI) and improved Pfirrmann and histological scores (Fig. S4b, c). Moreover, tissue immunofluorescence analysis demonstrated that FOXC1 knockdown significantly reduced the expression levels of DYRK1A-induced senescence-associated proteins, including P53, P21 and P16 (Fig. S4d, e). In summary, the findings indicate that the phosphorylation-dependent activation and nuclear translocation of FOXC1 represent the molecular mechanism underlying DYRK1A-induced NPC senescence. The DYRK1A-FOXC1 axis serves as a critical regulatory target for CMA in modulating the transcriptional processes associated with NPC senescence.
CMA induces a fate switch of senescent NPC from cellular senescence to apoptosisGiven that senescent NPC play a key role in the accelerated degeneration of IVD,34,35 we next investigated how restoration of CMA activity affects IL1B-induced senescent NPC, I-Sen. Our findings revealed that overexpression of L2A in I-Sen NPC ameliorated the senescence phenotype, as demonstrated by decreased P53 fluorescence intensity and reduced SA-β-gal activity in live cells (Fig. 5a, b). RT-qPCR analysis further indicated that L2A overexpression significantly reduced the mRNA levels of key senescence markers, including P53, P21 and P16 (Fig. S5a), as well as the mRNA levels of SASP-related inflammatory factors, such as IL1B, IL6, and IL-8 (Fig. S5b). Additionally, overexpression of L2A not only improved cell cycle progression in I-Sen NPC (Fig. 5c) but also decreased the protein expression levels of P53, P21, and P16 in I-Sen NPC (Fig. 5d) and alleviated the expression of SASP factors (Fig. 5e). Flow cytometry analysis suggested that overexpression of L2A significantly reduced the expression level of P16 in I-Sen NPC (Fig. S5c). These findings collectively suggest that activation of CMA can effectively alleviate the senescent phenotype in I-Sen NPC.
Fig. 5
CMA induces a fate switch of senescent NPC from cellular senescence to apoptosis. a, b Immunofluorescence showing the effect of L2A overexpression on P53 and senescence levels in I-Sen NPC. c The effect of L2A overexpression on the cell cycle of NPC in the control or I-Sen group. d Western blot showing the effect of L2A overexpression on the levels of senescence-related proteins (P53, P21, P16) in I-Sen NPC. e Western blot showing the effect of L2A overexpression on the levels of SASP inflammatory factors (IL6, IL-8, IL1B, TNF) and MMP3 in I-Sen NPC. f After treatment with CMA activator AR7 in I-Sen NPC, RNA-seq revealed that apoptosis-related pathways were significantly enriched. g, h TUNEL staining shows the apoptosis level in I-Sen NPC after L2A overexpression. i, j Immunoblotting showing the effect of L2A overexpression on the expression of apoptosis-related proteins in I-Sen NPC. k, l The effect of L2A overexpression on mitochondrial membrane potential in NPC of each group. m The apoptosis levels in normal and senescent NPC (R-Sen and I-Sen) treated with AI-10 or combined with L2A overexpression. n The effect of L2A overexpression or combined with BNIP3 knockdown on the apoptosis of senescent NPC. All graphs show the mean ± SEM of at least three independent experiments. *P <0.05, **P <0.01, ***P <0.001, ns indicates not significant
To investigate the functional impact and underlying mechanism of restoring CMA activity in I-Sen, we conducted transcriptome-wide sequencing analysis of I-Sen following treatment with CMA activation. Pathway enrichment analysis revealed that CMA activation significantly enhanced apoptosis in I-Sen NPC (Fig. 5f). It is well-established that senescent cells undergo metabolic rewiring and develop resistance to apoptosis.36 Strategies targeting the elimination of senescent cells (senolytics) have demonstrated efficacy in ameliorating the senescent phenotype in degenerated tissues and organs. Notably, CMA has been reported to exhibit a dual role in regulating programmed cell death in non-senescent cells, such as ferroptosis, depending on cell type and context.37,38 Based on these observations, we propose that the improvement of the overall senescent phenotype in NPC mediated by CMA activation may involve the selective clearance of senescent NPC. Furthermore, CMA activation may influence the survival adaptability of senescent NPC and modulate their susceptibility to apoptosis. Subsequently, we demonstrated through TUNEL staining and immunoblotting that L2A overexpression-induced apoptosis in I-Sen NPC, as evidenced by an increased Bax/Bcl-2 ratio and enhanced expression of BNIP3 and cleaved caspase 3 (Fig. 5g–j), Furthermore, flow cytometry analysis showed that L2A overexpression significantly induced apoptosis in R-Sen and N-Sen NPC (Fig. S5d–i). Notably, the basal apoptosis level of I-Sen NPC was lower than that of normal NPC, potentially due to the elevated Bcl-2-mediated resistance to apoptosis in senescent NPC (Fig. 5g–j). Apoptosis is usually divided into intrinsic (mitochondrial) and extrinsic pathways.39 Mitochondrial staining analysis suggested that L2A overexpression might trigger intrinsic apoptosis through mitochondrial membrane potential damage (Fig. 5k, l).
To further investigate the role of L2A overexpression in apoptosis susceptibility under AI-10, a well-known apoptosis inducer, we performed flow cytometry analysis. The results indicated that AI-10 induced apoptosis in both R-Sen and I-Sen NPC groups. However, the apoptotic response to AI-10 was weaker in senescent NPC compared to normal NPC (Fig. 5m). Importantly, L2A overexpression enhanced the susceptibility of senescent NPC to AI-10-induced apoptosis, while reducing the apoptotic response in normal NPC (Fig. 5m). Additionally, L2A overexpression directly induced apoptosis in I-Sen NPC, an effect that was alleviated upon BNIP3 knockdown via si-BNIP3 (Fig. 5n). These findings suggest that normal and senescent NPC exhibit distinct responsiveness to CMA activation. While CMA activation exerts an apoptosis-protective role in normal NPC, it promotes apoptosis in senescent NPC. Interestingly, apoptosis rescue experiments revealed that BNIP3 knockdown not only inhibited L2A-induced apoptosis in I-Sen NPC (Fig. 5n) but also counteracted the anti-senescence effect of L2A. This was evidenced by the increased protein and mRNA levels of senescence-related proteins (P53, P21, P16) and SASP inflammatory factors (IL1B, IL6, and IL-8) (Fig. S6a–c). We further performed in vivo experiments to investigate the effects of L2A overexpression and BNIP3 knockdown on intervertebral disc senescence. Utilizing an infrared fluorescent probe targeting SA-β-gal, we tracked senescent NPC in vivo and observed that L2A overexpression significantly alleviated NPC senescence induced by IL1B injection. Conversely, sh-BNIP3 lentivirus abolished the senescence-protective effect of L2A (Fig. S6d). At the cellular level, flow cytometry was employed to quantify P16 expression in I-Sen NPC, while fluorescence-based assays were used to measure intracellular P53 levels and live-cell senescent signals (Fig. S6e, f). These findings demonstrated that BNIP3 knockdown inhibited the beneficial effects of L2A overexpression on mitigating NPC senescence, thereby underscoring the crucial role of CMA in regulating the balance between senescence and apoptosis in NPC. Collectively, CMA activation drives a shift in NPC fate from senescence to apoptosis, thereby facilitating the elimination of senescent cells and alleviating the overall aging process of the disc.
Restoring CMA activity in senescent NPC inhibits glutamine synthesis, thereby promoting GLS1-dependent apoptosisThe regulation of cell fate by CMA is often determined by the function of its target substrates. To investigate the mechanism underlying CMA activation-induced apoptosis of senescent NPC, we analyzed mass spectrometry data that identified potential CMA substrates, which showed that cellular metabolism pathways were the most significantly enriched following L2A-KO (Fig. 6a). This suggests that CMA may influence the function and survival of senescent NPC through metabolic regulation. Among the predicted CMA substrates identified in the list, GLUL emerged as a protein of particular interest (Fig. S7a). GLUL is a key enzyme required for intracellular glutamine synthesis. Notably, metabolic reprogramming is a hallmark of cellular senescence, especially the reprogrammed glutamine metabolism that provides potential targets for senolytics.9,40 Glutamine metabolism not only plays a role in cellular energy metabolism but also contributes to the survival adaptability of senescent cells through acid-based regulation.9 Through quantification of glutamine levels, we observed that senescent NPC exhibited significantly higher baseline glutamine levels compared to their normal counterparts. Importantly, both cell types displayed reduced glutamine levels following L2A overexpression (Fig. 6b). Conversely, L2A knockout led to an increase in glutamine levels (Fig. 6c). Given the critical role of glutamine flux in sustaining the survival of senescent cells,9 we investigated whether the CMA activation-dependent reduction of glutamine levels in senescent NPC influences their apoptotic response. Flow cytometry analysis revealed that L2A overexpression enhanced apoptosis in senescent NPC, an effect that was abolished by glutamine supplementation (Fig. 6d). Notably, normal NPC exhibited minimal changes in apoptosis regardless of CMA activation or glutamine addition, suggesting a differential sensitivity to glutamine metabolism between normal and senescent cells. This discrepancy may stem from the distinct metabolic requirements of these cell states. In senescent cells, lysosomal damage and H+ leakage are commonly observed, necessitating the neutralization of the intracellular acidic environment via glutamine metabolism to maintain survival.41 Consistent with this, we identified key features of lysosomal dysfunction in senescent NPC, including decreased lysosomal acidity (Fig. 6e, f) and extensive colocalization of the lysosomal membrane damage marker galectin-3 with LAMP1 (Fig. 6g).
Fig. 6
Restoring CMA activity in senescent NPC inhibits glutamine synthesis, thereby promoting GLS1-dependent apoptosis. a Proteomic analysis of L2A-KO NPC showing that cellular metabolism was enriched. b The glutamine levels in control or I-Sen NPC after L2A overexpression. c The effect of L2A knockout on glutamine levels. d The effect of L2A overexpression or combined with glutamine on the apoptosis level of control or I-Sen NPC. e, f The acidity of lysosomes in normal or senescent NPC. g The colocalization of the membrane damage marker Galectin-3 and LAMP1 in control or I-Sen NPC. h The protein levels of GLS1 and GLUL in normal or senescent NPC. i, j The effect of L2A overexpression on the expression of GLS1 and GLUL in normal and I-Sen NPC. k The effect of L2A or combined with GLUL overexpression on glutamine levels in I-Sen NPC. l Immunoblotting showing the effect of L2A or combined with GLUL overexpression on apoptosis in I-Sen NPC. m GLS1 inhibitors CB-839 and BPTES inhibited I-Sen NPC apoptosis after L2A overexpression. n The effect of L2A overexpression and CB-839 on GLS1 filaments in I-Sen NPC. All graphs show the mean ± SEM of at least three independent experiments. *P <0.05, **P <0.01, ***P <0.001, ns indicates not significant
Active glutamine metabolism is an important feature of senescent cells.41 In our study, comparative analysis revealed significant upregulation of glutamine synthetase GLUL and glutamine degrading enzyme GLS1 in various senescent models of NPC compared to normal NPC (Fig. 6h). Immunoblotting results demonstrated that GLUL levels, but not GLS1, were notably reduced in NPC following CMA activation (Fig. 6i, j). GLUL overexpression successfully mitigated the decrease in glutamine levels induced by L2A overexpression (Fig. 6k). Importantly, co-overexpression of GLUL rescued apoptosis of senescent NPC induced by L2A overexpression (Fig. 6l). Additionally, while DYRK1A has been shown to be upregulated in senescent NPC (Fig. 2e), knockdown of DYRK1A did not significantly influence the apoptosis of senescent NPC or the associated changes in glutamine levels (Fig. S7b, c), suggesting that the CMA-DYRK1A pathway may not intersect with the CMA-GLUL-Gln axis. Previous studies have demonstrated that GLS1 forms filamentous polymers under glutamine deficiency, which triggers cell apoptosis.42 In the present study, we extended these findings by demonstrating that administration of GLS1 inhibitors, including CB-839 and BPTES, significantly decreased L2A overexpression-induced apoptotic protein levels in senescent NPC (Fig. 6m). This suggested that GLS1 played a critical role in the apoptotic toxicity of senescent NPC following CMA activation. Furthermore, immunofluorescence staining revealed that GLS1 in senescent NPC formed filamentous aggregates upon L2A overexpression (Fig. 6n). Notably, treatment with CB-839 to inhibit GLS1 activity reduced these filamentous aggregates (Fig. 6n). In addition, TUNEL staining demonstrated that GLS1 inhibitors could
Comments (0)