
Remember me
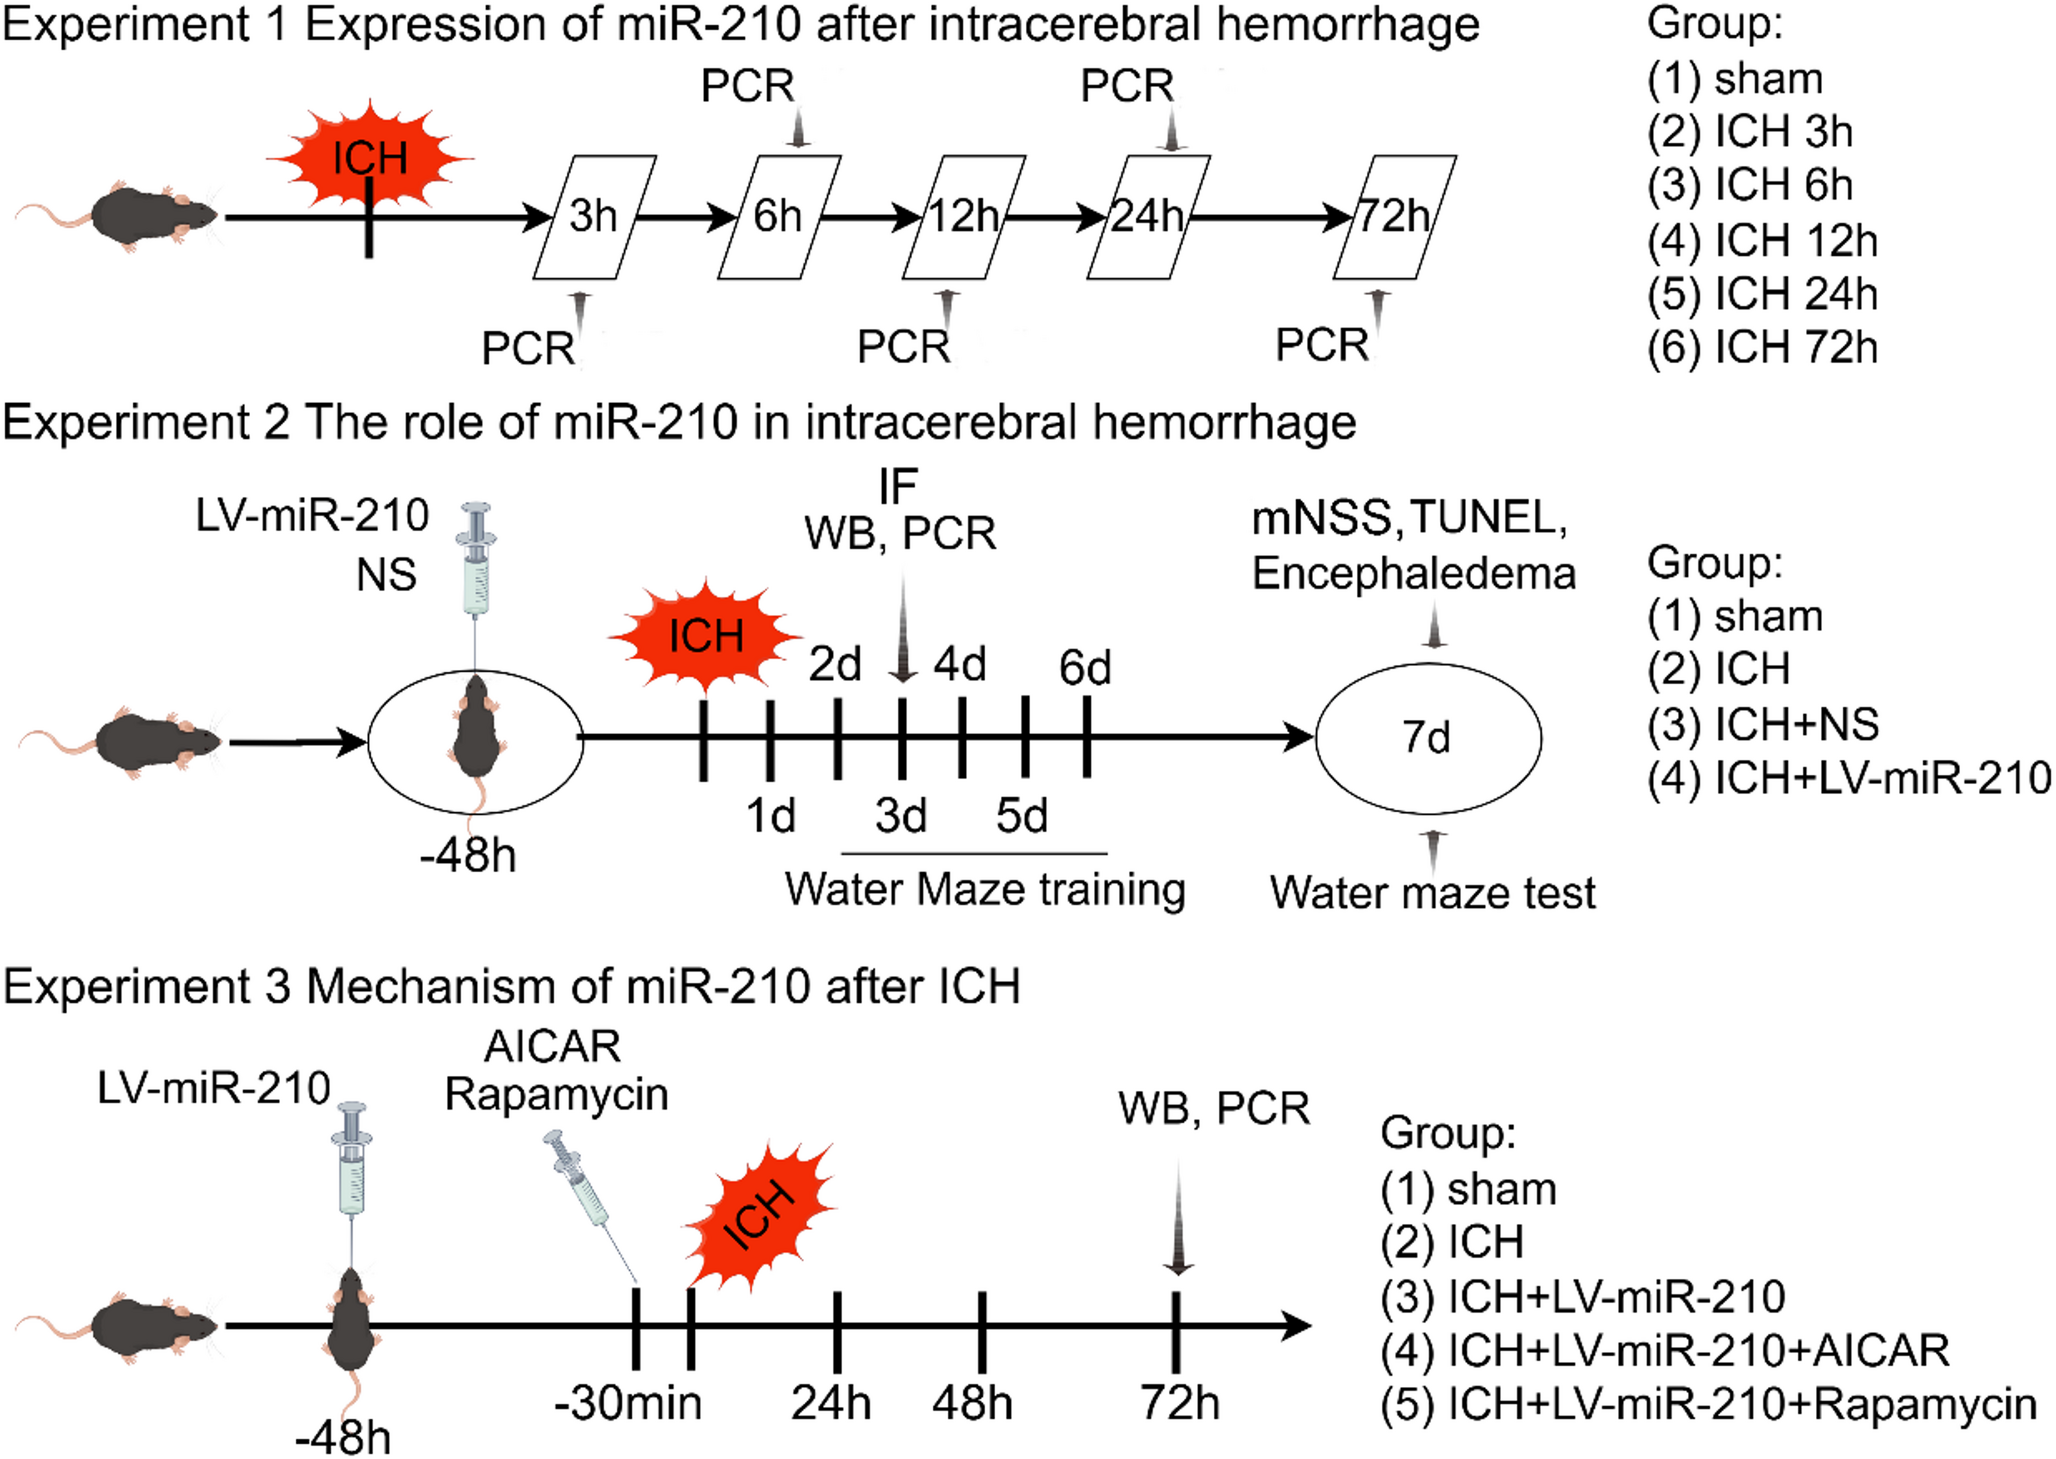
The experimental procedures involving 142 male C57/BL6 mice (8 weeks old, weighing between 20 and 25 g) in this study were approved by the Animal Ethics Committee of Nantong University. Mice were randomly assigned to three experimental cohorts (Fig. 1.1), and the allocation of the groups was concealed from the researchers to ensure objectivity. These mice were housed in a controlled environment with optimal conditions of temperature, humidity, and a standardized 12-hour light-dark cycle. Prior to the induction of ICH, the mice were allowed at least three days of acclimation with unrestricted access to food and water.
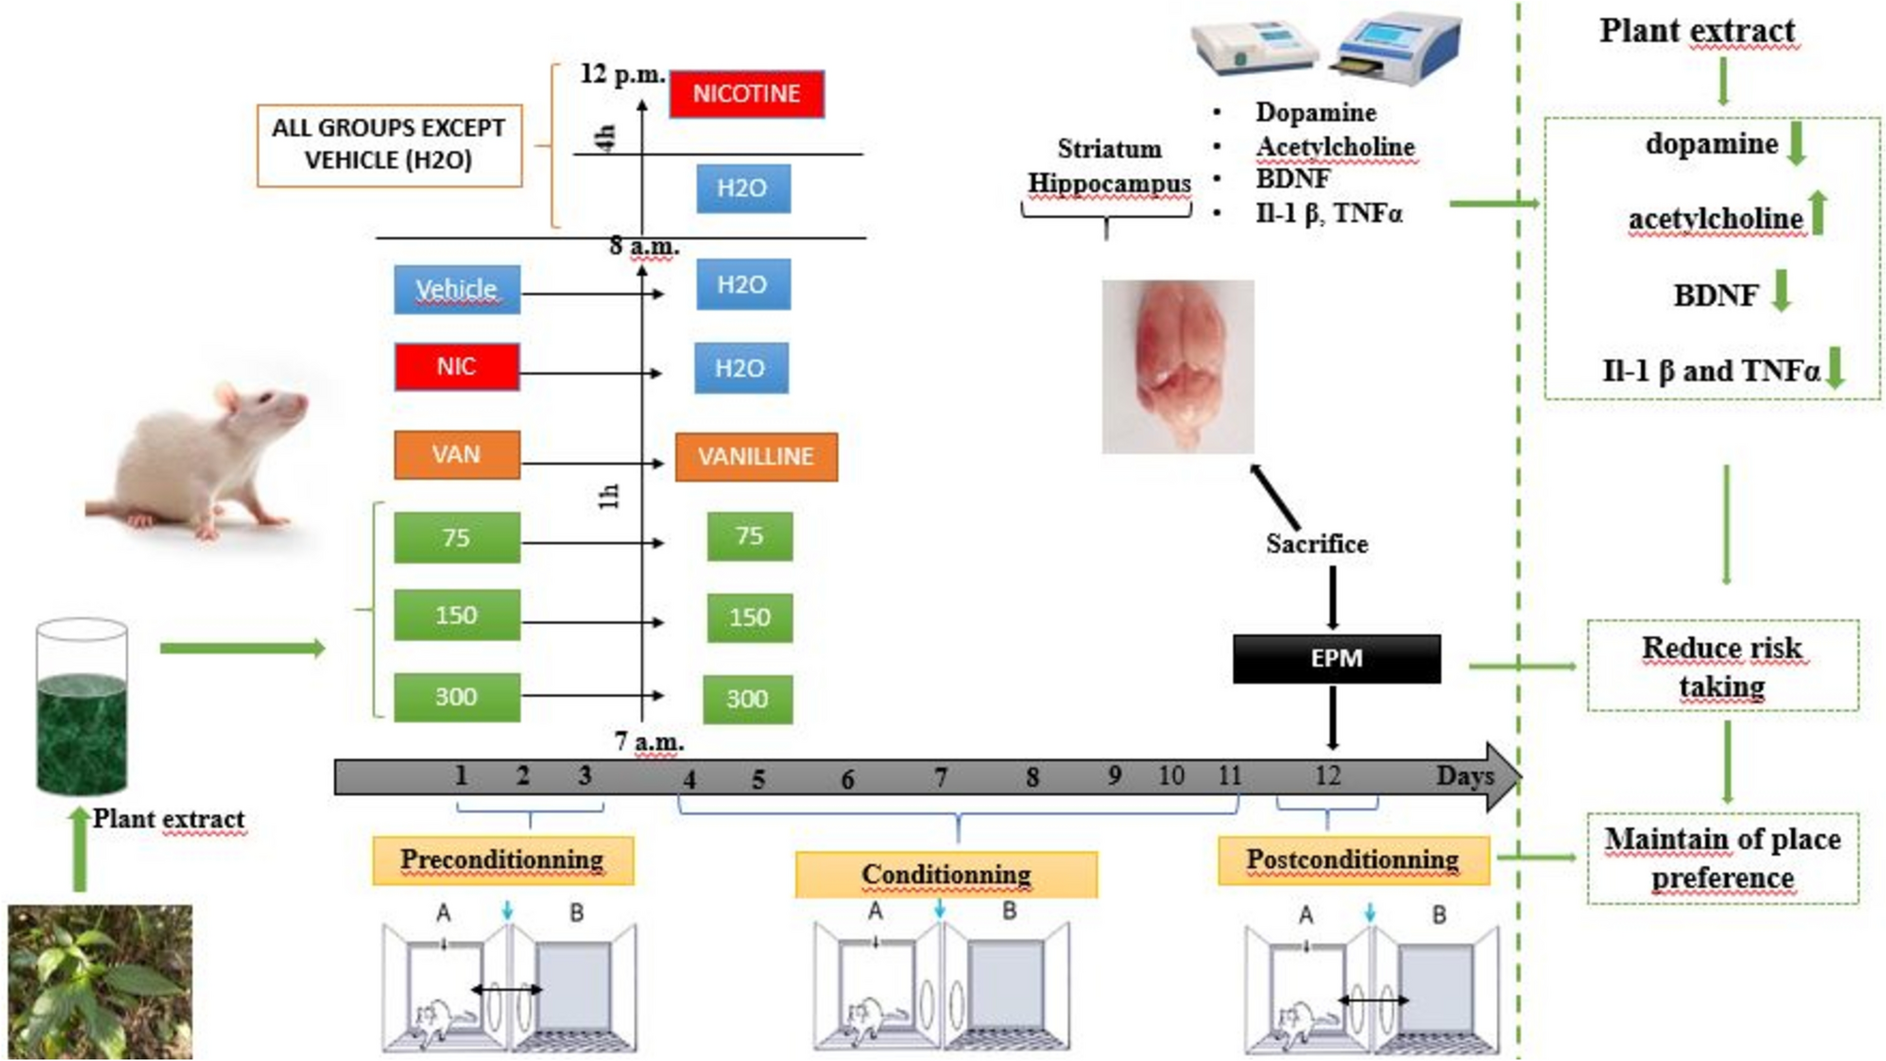
Fig. 1.1
In Vivo experimental workflow and cohort stratification
Establishment of the ICH ModelAn ICH mouse model was created through intracranial collagenase injection, following methods outlined in previous literature [4]. The mice were anesthetized with a 2.5% avertin solution (Sigma‒Aldrich, St. Louis, MO), administered intraperitoneally (IP) at a dose of 0.14 ml per 10 g of body weight. Under a stereoscopic microscope and using a microsyringe pump, 6 µl of collagenase VII (Sigma‒Aldrich, St. Louis, MO) were precisely infused into the left basal ganglia. The injection coordinates were set at 0.2 mm posterior to the coronal suture, 2.2 mm lateral to the sagittal suture, and 3.5 mm deep from the dura mater, in accordance with established guidelines [20]. Post-injection, the needle was kept in place for 5 min before being gently withdrawn, and the cranial hole was sealed with bone wax. For the sham control group, the needle insertion was performed without any collagenase injection.
Injection of DrugsLV-miR-210-copGFP, obtained from Youxi Weinan Biotechnology Co., Ltd. (located in Fujian, China), was utilized in this study. Precisely, 2.2 µl of LV-miR-210 solution containing a total titer of 2 × 10^9 TU/ml, or an equivalent volume of saline, was infused into the lateral ventricle of the mice. The injection coordinates were established as 0.3 mm posterior to bregma, 1.0 mm lateral, and 2.3 mm deep, with the injection proceeding at a rate of 0.2 ml/min.
Furthermore, rapamycin and AICAR, both acquired from MedChemExpress (headquartered in Monmouth Junction, NJ, USA), were used in the experiment. The mice were injected with 2 µl of 1 µM/ml rapamycin and 2 µl of 0.2 µM/ml AICAR [21, 22], respectively, using the same injection technique as previously described.
The lentiviral concentration and time gradient experimental results, statistical trends of mNSS Score changes following surgery, and pharmacological safety and efficacy evaluations post-administration are presented in Figure S1 and Supplementary file 1.
Cell Culture and Experimental DesignHT22 cells were cultured in DMEM medium supplemented with 10% fetal bovine serum at 37 ° C with 5% CO₂, and the medium was changed every 48 h. The cells were treated with 200 µmol/L hemin [23] to establish an in vitro intracerebral hemorrhage model, which was divided into control group. The expression of miR-210 (gapdh normalized) was analyzed by qPCR in Hemin groups (3 h, 6 h, 12 h and 24 h), and 12 h was the best exposure time for subsequent intervention. Drug combination therapy studies combined LV-miR-210 with either AICAR (1.0 mmol/L, AMPK activator) or rapamycin (250 nmol/L, mTOR inhibitor) during hemin exposure [24], resulting in five groups: Sham group, ICH group, ICH + LV-miR-210 group, ICH + LV-miR-210 + AICAR group and ICH + LV-miR-210 + Rapamycin group. The protein levels of autophagy (LC3I/II, Beclin1), apoptosis (Bax, Bcl-2) and AMPK/mTOR signaling pathway (p-AMPK/AMPK, p-mTOR/mTOR) were analyzed by Western blot with β-actin as loading control. Cell grouping is shown in Fig. 1.2, Cell transfection and screening are detailed in Supplementary file 2.
Fig. 1.2
In vitro experimental workflow and cohort stratification
qPCR AnalysisRNA was extracted from brain tissue samples (n = 6 in each group, and 2 d after ICH induction in the sham group) using a total RNA extraction solution (Solarbio, Beijing, China; catalogue: R1100). RNA concentration was determined using a NanoDrop One spectrophotometer (Thermo, USA). The isolated RNA was then reverse transcribed into cDNA with PrimeScriptTM RT Master Mix (TakaraBio, Japan; catalogue number: RR036A-1). qRT-PCR analysis was performed using BeyoFastTM SYBR Green qPCR Mix (2x, Low ROX) (Beyotime, Jiangsu, China; catalogue number: D7262) on a 7500 instrument (Thermo Fisher, USA). Target gene expression levels were normalized to GAPDH using a real-time fluorescent quantitative PCR system. The specific primers for qRT-PCR are listed in Table 1.
Table 1 Primer sequences utilized for qPCR analysisAssessment of Neurological DeficitsNeurological deficits were assessed using the modified Neurological Severity Score (mNSS), a composite scale evaluating motor, sensory, cognitive, reflex, and abnormal movement functions, with scores ranging from 0 (normal) to 18 (maximal deficit) [25]. Higher scores indicate more severe neurological impairment. The mNSS was recorded for each experimental group at 7 d post-intracerebral hemorrhage (ICH) to quantify neurological dysfunction.
Brain Edema AssessmentTo measure brain water content, the standardized dry-wet technique was used. Following euthanasia, the mice brains were swiftly removed, and their wet weight was recorded. The brains were then dried at 100℃ for 24 h to obtain the dry weight. Afterward, the percentage of brain water content was derived using the formula: [(wet weight minus dry weight) divided by wet tissue weight] multiplied by 100% [26].
Western Blot AnalysisTissue samples from the left hemisphere of mice were acquired for research purposes. Extraction of proteins was carried out using a tissue lysis buffer that incorporated phosphatase inhibitors, protease inhibitors, and phenylmethylsulfonyl fluoride to ensure thorough extraction of soluble proteins. A Thermo Fisher Scientific quinolinic acid kit facilitated the measurement of protein concentration. An equivalent quantity of protein was electrophoresed onto 10% SDS-PAGE gels. Post-electrophoresis, the proteins were transferred onto a PVDF membrane with a pore size of 0.45 μm for further analysis. A blocking procedure was performed using 5% non-fat milk for 2 h at 4 °C. Following this, the membranes were incubated overnight with specific antibodies directed against Bcl-2, Bax, LC3, Beclin 1, AMPK, p-AMPK, mTOR, p-mTOR, and β-actin, sourced from Proteintech Group (China) and Bioworld Technology (USA), among others, at a dilution of 1:800. Subsequently, the membranes were incubated with a secondary antibody, chosen based on the species and isotype of the primary antibody, for 2 h at 4℃ with a dilution of 1:5000. Enhanced chemiluminescence was employed to visualize the immune signals.
ImmunofluorescenceAfter a 30-minute re-warming, the sections were washed three times with PBS containing 0.3% Triton X-100, each wash lasting 10 min. They were then blocked with 10% fetal bovine serum (FBS) for 1 h at 37℃. Subsequently, the sections were incubated overnight at 4℃ with primary antibodies, such as anti-Iba-1 (Proteintech Group, USA; 10904-1-AP), anti-GFAP (Abcam, UK; ab278054), anti-NeuN (Abcam, UK; ab104224), and others, diluted 1:50. After three 5-minute PBS washes, the sections were treated with fluorescent secondary antibodies for 2 h at room temperature. Following three additional 5-minute PBS washes, they were stained with DAPI for 30 min. The sections were examined under a fluorescence microscope.
TUNEL StainingA TUNEL kit from Abbkine (catalogue number: KTA2010) was used to detect apoptosis in brain cells. Brain tissue sections were warmed to 37℃ for 30 min and then fixed with 4% paraformaldehyde for 15 min. After two washes with PBS, the sections were treated with 20 µg/mL proteinase K at 37℃ for 5 min. They were then washed with buffer for 5 min and incubated in a DNA labelling solution at 37℃ for 1 h. After rinsing with PBS for 5 min, the sections were incubated in an antibody solution at 25℃ for 30 min. Following a rinse with double-distilled water and an additional 5-minute incubation, the sections were mounted and sealed using DAPI Fluoromount-G.
Maze of WaterTo evaluate cognitive functions (learning and memory) in mice, the Morris water maze test was conducted [22]. Training began the day after ICH. In each session, a mouse was placed in the center of one quadrant, facing the pool wall, and allowed to swim freely. Over five consecutive days, each mouse underwent four daily trials, followed immediately by placement in a dry cage after each trial. To ensure the recovery of strength and the maintenance of body temperature, the trials were performed 15 min. On day 7, the memory of each mouse was tested by placing the mouse in the quadrant farthest from the platform. ANY-maze, a path analysis software, was employed to assess latency, swimming speed, swimming distance, and additional parameters.
Statistical AnalysisData were expressed as mean ± SEM. Comparisons of means among multiple groups were analyzed using one-way ANOVA. Image processing and data analysis were conducted using ImageJ software and GraphPad Prism (version 9.0). A P < 0.05 was considered statistically significant.
Comments (0)