
Remember me
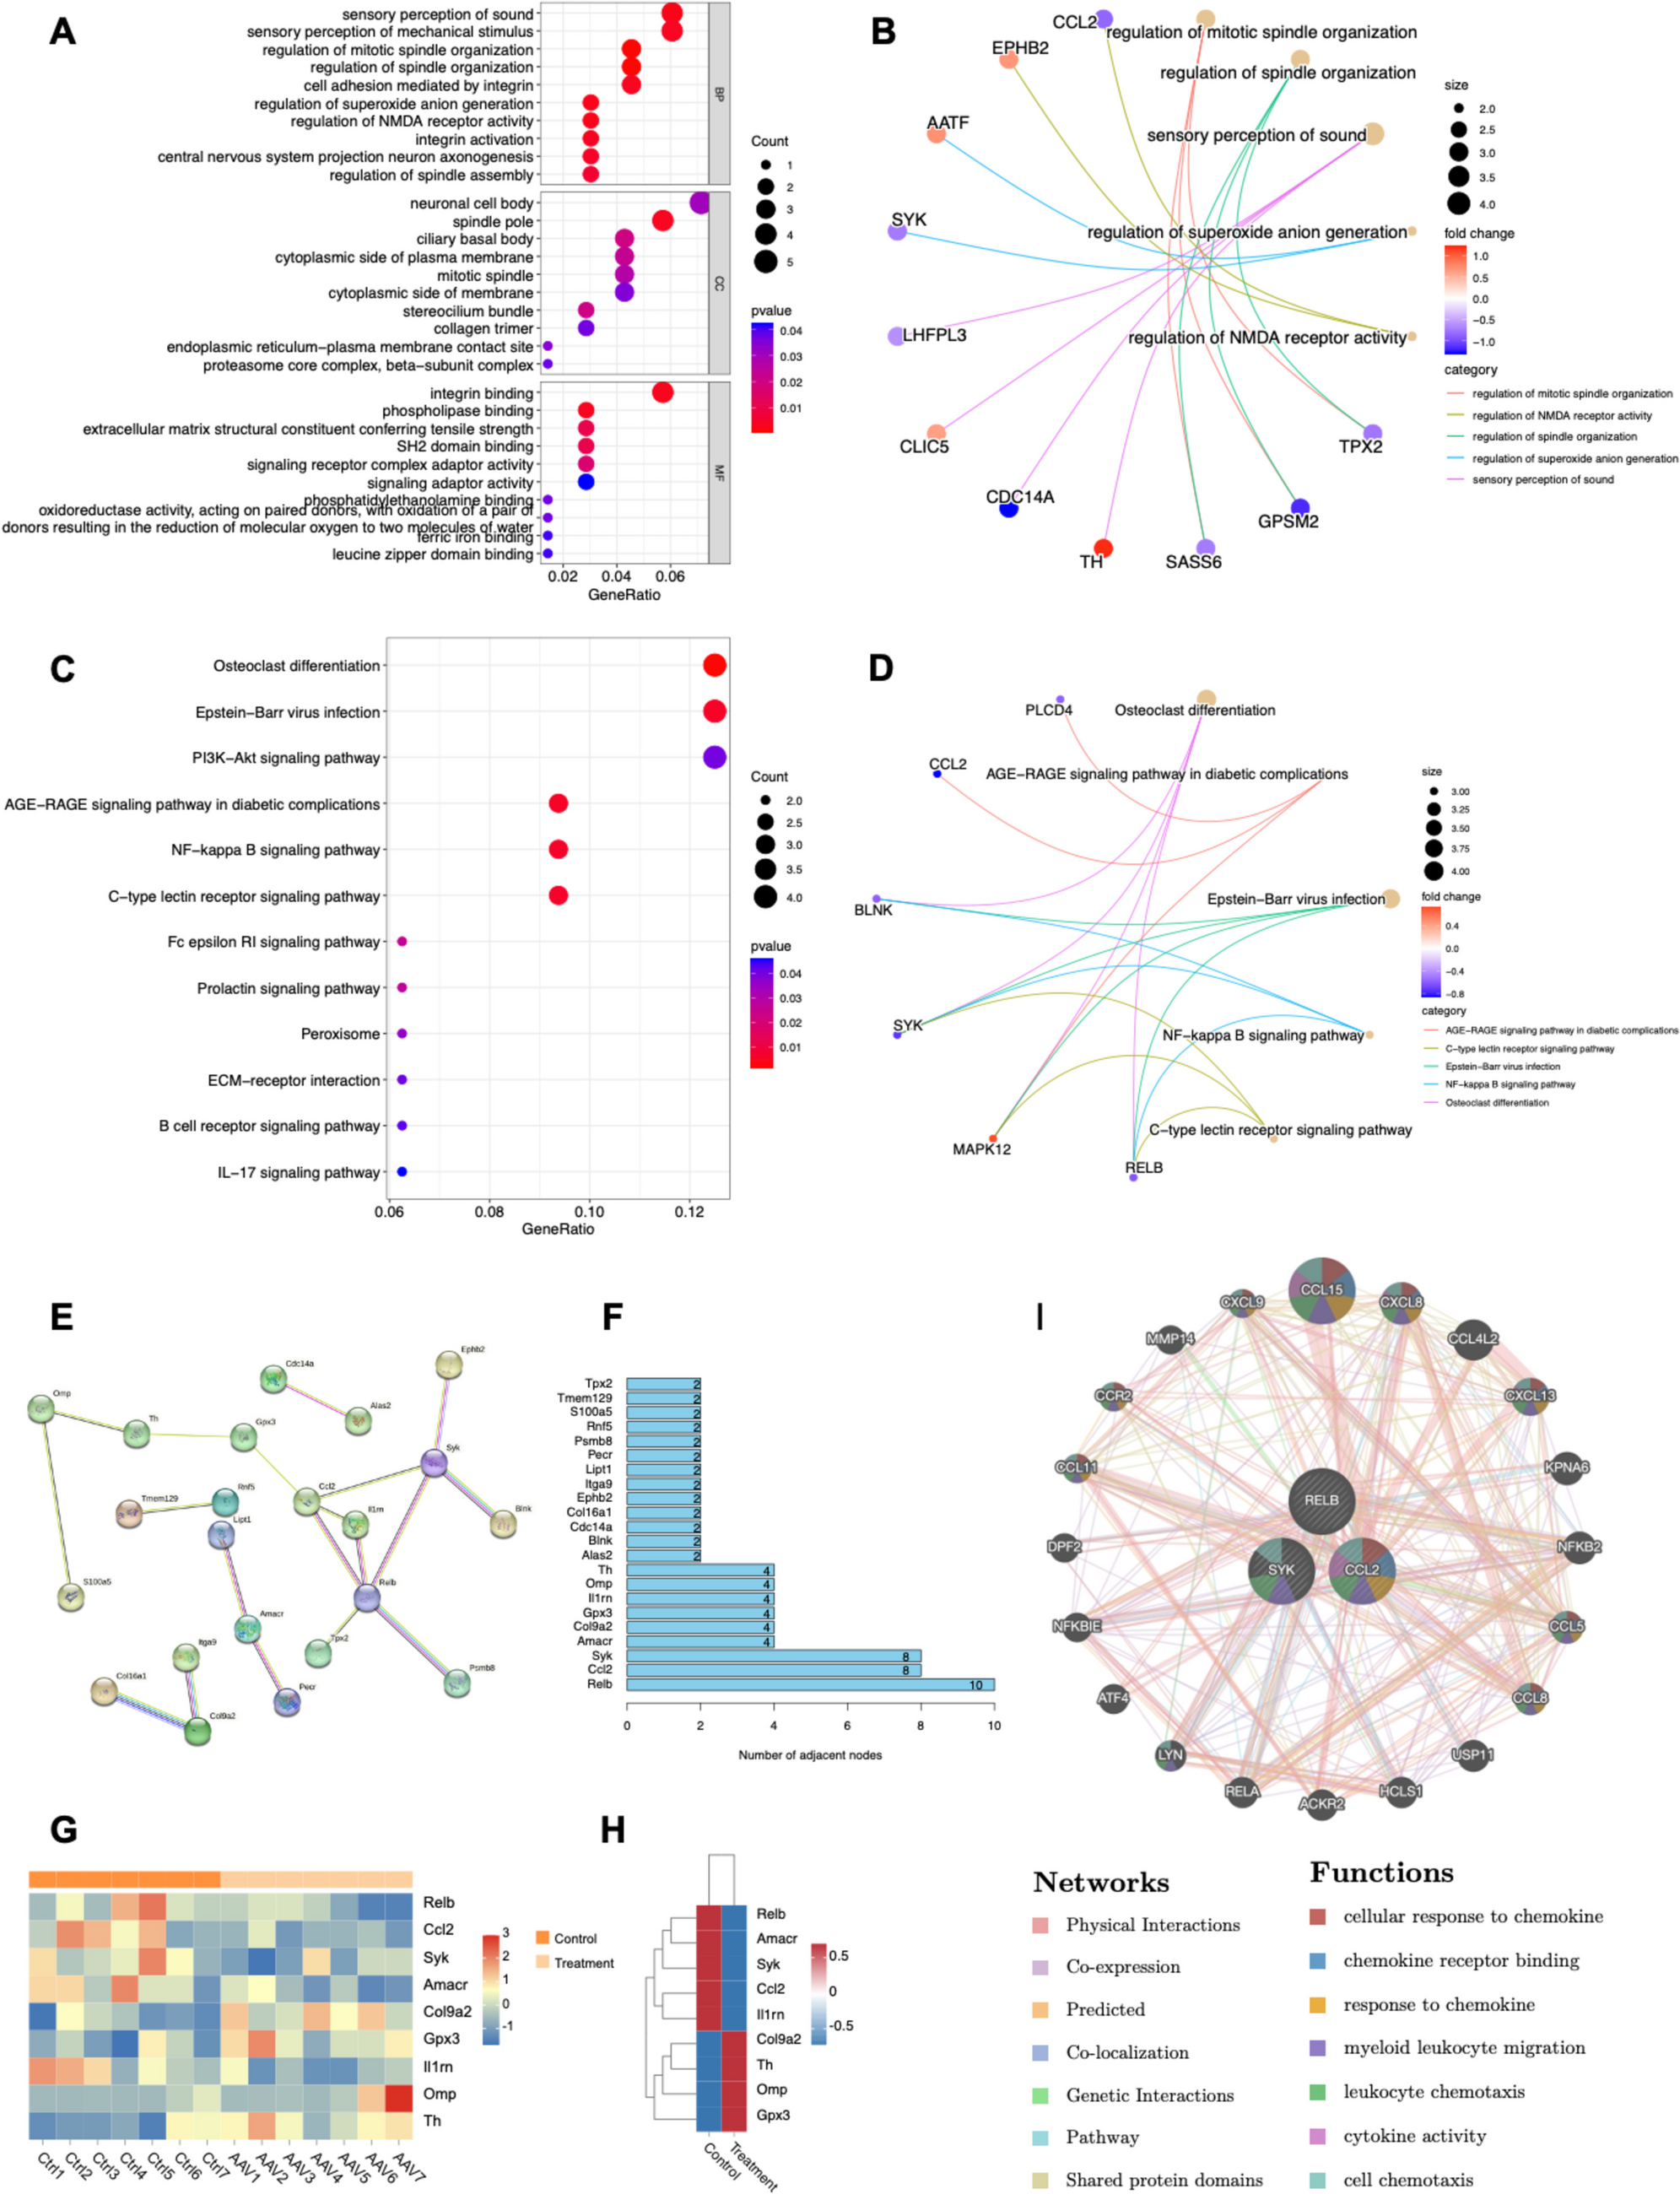

To investigate the transcriptomic changes following the intracranial injection of adeno-associated virus (AAV), we conducted an in-depth analysis of mRNA datasets from both untreated mouse brains (n = 7) and AAV-integrated mouse brains (n = 7). Utilizing a linear model approach, we analyzed RNA-seq data covering 53,801 genes. Differential expression analysis identified a total of 11,980 differentially expressed genes (DEGs). Applying stringent p value and logFC filtering criteria (pFilter = 0.05, logFCfilter = 1), we ultimately identified 98 significantly differentially expressed genes. Specifically, compared to the control group, 47 genes were downregulated, and 51 genes were upregulated in the AAV-integrated group. We then extracted gene names and mapped them to Entrez ID, successfully mapping 73 genes. To elucidate the functional implications of these genes and proteins, we performed GO and KEGG pathway analyses. GO analysis revealed that DEGs were enriched in biological processes such as sound perception and mechanosensory perception, as well as cellular components like neuronal soma and spindle pole. The molecular functions enriched by DEGs included integrin binding and phospholipase binding (Fig. 1A, B). KEGG analysis indicated that DEGs were enriched in pathways such as osteoclast differentiation, Epstein-Barr virus infection, and PI3K-Akt signaling (Fig. 1C, D).
Fig. 1
Integrating the transcriptional landscape of adeno-associated virus in the brain. A Performing GO analysis based on differentially expressed genes identified from transcriptome sequencing. The size of the circles represents the number of differentially expressed genes, with the color of the circles ranging from red to blue indicating increasing significance. B Association diagram illustrating the relationship between key genes and the key biological activities identified through GO analysis. C Conducting KEGG analysis based on differentially expressed genes identified from transcriptome sequencing. The size of the circles corresponds to the number of differentially expressed genes, with colors ranging from red to blue indicating increasing significance. D Association diagram illustrating the relationship between key genes and the key pathways identified through KEGG analysis. E Protein–protein interaction network analysis constructed using the STRING database. F The top 12 differentially expressed genes based on the number of key nodes identified through a combined analysis of KEGG and GO. G Heatmap illustrating the expression levels of key differentially expressed genes. The horizontal axis represents individual samples, while the vertical axis represents gene names. H Heatmap illustrating the expression levels of key differentially expressed genes. The horizontal axis represents control and treatment groups, while the vertical axis represents gene names. I Prioritizing the relevant genes through GeneMANIA for functional analysis
We constructed a protein–protein interaction network with a confidence score of 0.900 using the STRING database and identified 22 node genes from this network (Fig. 1E). Subsequently, we employed R language to quantify the interaction frequencies among these genes and visualized the results as a sorted horizontal bar chart (Fig. 1F). Based on higher interaction frequency, we selected nine genes, including RELB, CCL2, and SYK, as key targets for further investigation and generated a heatmap (Fig. 1G). The analysis revealed that following AAV treatment, the expression levels of RELB, AMACR, SYK, CCL2, and IL1RN were downregulated, whereas COL9A2, TH, OMP, and GPX3 showed upregulation within the treated group (Fig. 1H). Using the online tool GENEMANIA (Fig. 1I), we inferred the potential functions of RELB, CCL2, and SYK and prioritized their functional analysis. The findings indicated that CCL2 plays a more significant role in the process of AAV vector integration into the brain compared to RELB and SYK.
Differences in cellular characteristics between B lymphocytes and microgliaTo further evaluate the integration process of AAV vectors in the brain at the single-cell level, we selected four single-cell sequencing samples from the GEO database. The control group includes control samples of normal brain tissue, while the experimental group consists of brain tissues with integrated AAV9 vectors. Firstly, we conducted gene feature extraction and created violin plots (Fig. 2A). Correlation analysis revealed a high linear relationship of up to 0.96 between sequencing depth and the number of genes (Fig. 2C). Next, we generated a feature variance plot and annotated the top 10 feature genes (Fig. 2B). Finally, in the PCA dimensionality reduction analysis, we selected 1500 feature genes to streamline clustering time. Using the PCA results for clustering, we employed 20 principal components for t-SNE clustering analysis and visually annotated the grouped cells (Fig. 2D, Supplementary Fig. 1). Additionally, we identified differentially expressed genes for each cluster and created corresponding heatmaps to illustrate their individual expression profiles (Fig. 2E).
Fig. 2
Visual analysis of clustering for single-cell sequencing. A The violin plot illustrates the extraction of feature genes. The left chart compares the number of feature genes between the control group and the treatment group, while the right chart evaluates sequencing depth in both groups. The horizontal axis denotes the control and treatment groups (n = 4), respectively. The left vertical axis represents the count of gene features relevant to the research objectives, whereas the right vertical axis indicates the number of differentially expressed genes. B The feature variance plot highlights the top 10 feature genes along with their corresponding variance values. The horizontal axis lists various genes within the dataset, with the top 10 feature genes labeled accordingly. The vertical axis measures the variance value of each feature, where a higher variance signifies greater variability or information content within the dataset. C The scatter plot demonstrates the correlation between sequencing depth and the number of detected genes, exhibiting a correlation coefficient of 0.96. The horizontal axis represents sequencing depth, a critical metric that quantifies the amount and coverage of sequencing data, calculated as the total number of bases read per sample or the product of average read length and the number of reads per sample. The vertical axis reflects the number of genes successfully identified and counted at a given sequencing depth. A high correlation near 1 suggests that an increase in sequencing depth leads to a proportional increase in the number of detected genes, consistent with the principles and expected outcomes of high-throughput sequencing. D In the principal component analysis (PCA) result plot, the x-axis and y-axis represent the first principal component (PC1) and the second principal component (PC2), respectively. Each point in the plot corresponds to an individual observation, positioned based on its scores along these principal components. The relative positions of these points reflect the degree of similarity among the samples within the dataset. E The PCA heatmap illustrates the results for the top 20 clusters. The x-axis denotes different sample groups categorized by their spatial distribution following PCA analysis, while the y-axis represents differentially expressed genes. The color gradient indicates the magnitude of each element in the data matrix. F The t-SNE clustering visualization plot depicts the distribution of differentially expressed genes across various cell groups. Tsne_1 and Tsne_2 represent two dimensions derived from dimensionality reduction using the t-SNE algorithm, corresponding to the horizontal and vertical axes on the two-dimensional plane, respectively
To investigate differential genes between cell clusters, we performed group visualization by plotting single-cell clustering maps for both the control and experimental groups (Fig. 2F). We observed significant variations in microglia, B lymphocytes, CD8-positive T cells, and fibroblasts. Through statistical analysis, we identified 6828 differential genes related to microglia, 6075 differential genes related to B lymphocytes, 241 differential genes related to dendritic cells, and 106 differential genes related to fibroblasts. Since the number of differential genes in other cell types was minimal and had minimal impact, they were not considered.
An MDK-NCL-dependent immune suppression mechanism exists between cells during the integration process of AAV vectors in the brainTo thoroughly investigate the mechanisms of intercellular interactions, we performed a comprehensive analysis of cellular communication based on ligand-receptor pairs. By integrating data from the KEGG database (comprising 73%) and literature sources (comprising 27%), we elucidated the intricate interactions among fibroblasts, epithelial cells, B lymphocytes, CD8 + T cells, stromal cells, and microglial cells during brain integration mediated by adeno-associated virus (AAV) vectors (refer to Fig. 3A–D). Further examination of the cellular communication network revealed that the ligand-receptor pair consisting of MDK, and neuronal cell adhesion molecule (NCL) plays a pivotal role in this process (Fig. 3E).
Fig. 3
Study on the interaction between receptors and ligands in cellular biology. A Pie chart vividly illustrates the sources of data on cellular interactions. B Cellular communication diagram representing interactions between different cell types. Nodes represent cell types, edges represent interactions between cells, and the thickness of the edges represents the frequency of interactions. C Weighted cellular communication network diagram. D Individual cellular communication diagrams for each cell. E Cell communication bubble chart. Colors represent the strength of the interaction between cells based on receptor-ligand binding affinity. F The gene expression levels of MDK, SDC1, SDC2, SDC4, and NCL were analyzed in the transcriptome sequencing data
The MDK-NCL complex exhibits immunosuppressive properties, effectively modulating immune cell activity and influencing both the magnitude and direction of immune responses. During the integration of AAV vectors into the brain, the MDK-NCL complex may serve as a critical regulator, not only impacting immune system function and response but also potentially indirectly affecting AAV vector integration efficiency and immune tolerance by altering immune cell function and subsequent cellular interactions. To substantiate these observations, we analyzed the expression changes of key genes involved in the MDK-NCL ligand-receptor pair (including MDK, SDC1, SDC2, SDC4, and NCL) using transcriptome data (Fig. 3F). By correlating high-probability regions for the MDK-NCL pair in the bubble plot with gene expression levels from transcriptome data, we further validated the significance of this ligand-receptor pair in specific cellular communication processes. These findings enhance our understanding of the intricate nature of intercellular interactions and provide novel theoretical foundations and potential therapeutic targets for the treatment and prevention of neurological diseases.
Causal inference of AAV receptor integration based on Mendelian randomizationTo further elucidate causal hypotheses, we employed Mendel’s second law to infer the influence of biological factors on the target outcome by utilizing the impact of randomly distributed genotypes in nature on phenotypes. Initially, through conducting a GWAS study, we identified gene variant single nucleotide polymorphisms (SNPs) that were associated with the previous single-cell results, serving as “instrumental variables (IV).” Subsequently, we used these IVs to infer the impact of biological factors on AAV receptor integration. Since genes are randomly allocated and not influenced by confounding factors, utilizing genetic variants to study causal relationships can eliminate the influence of confounders on outcomes, thereby enhancing the reliability of causal inference. We employed five statistical methods for Mendelian randomization analysis, including MR Egger, weighted median, inverse variance weighted (IVW), simple mode, and weighted mode, and presented the results in forest plot format.
Based on IVW < 0.05, we identified nine relevant genes (ARHGAP31, CMPK2, DPY19L1, NEIL2, NPDC1, NUP85, OSGIN2, SAMD12, VIPR1) associated with B lymphocytes and AAV receptor integration outcomes (Fig. 4). Eight relevant genes (AK9, DPY19L1, MAP3K5, POLR1E, SAMD12, SLC22A5, SOX4, XBP1) associated with microglia and AAV receptor integration outcomes (Fig. 5). No relevant genes were found in the remaining cell types. Subsequently, we conducted heterogeneity analysis, pleiotropy analysis, and leave-one-out sensitivity analysis on the identified genes for further evaluation (Fig. 6E, Supplementary Fig. 2). The analysis suggests that the aforementioned genes may serve as potential factors influencing AAV receptor integration. Further research can delve into the specific mechanisms through which these genes operate in the process of AAV receptor integration, shedding light on their roles in modulating intracellular signaling and immune responses.
Fig. 4
A Mendelian randomization analysis forest plot for B lymphocytes
Fig. 5
A Mendelian randomization analysis forest plot for microglia
Fig. 6
Key gene interaction analysis for Mendelian randomization. A A volcano plot of exposure genes for B lymphocytes. Red indicates exposure genes with an odds ratio (OR) greater than 1, representing risk factors. Green indicates exposure genes with an OR less than 1, representing protective factors. B Prioritizing exposure genes for B lymphocytes using GeneMANIA for functional analysis. C A volcano plot of exposure genes for microglia. Red represents exposure genes with an odds ratio (OR) greater than 1, indicating risk factors. Green represents exposure genes with an OR less than 1, indicating protective factors. D Prioritizing exposure genes for microglia using GeneMANIA for functional analysis. E Heterogeneity analysis, pleiotropy analysis, and leave-one-out sensitivity analysis of the key exposure gene NUP85 in B lymphocytes and the key exposure gene XBP1 in microglia
Analysis of the mechanisms and key factors of immune cell-related genes in AAV receptor integrationTo further narrow down the scope of key genes, in the B lymphocyte-related genes, utilizing volcano plot visualization, it was revealed that ARHGAP31, CMPK2, DPY19L1, and SAMD12 were positively correlated with AAV receptor integration (OR > 1), while NEIL2, NPDC1, NUP85, OSGIN2, and VIPR1 were negatively correlated with AAV receptor integration (OR < 1) (Fig. 6A). Predicting the functions of these genes and analyzing their interaction networks, it was found that NUP85 played a particularly significant role. NUP85 is involved in crucial biological processes such as virus transport, gene silencing, and nucleoside diphosphate metabolism. Specifically, NUP85 may participate in regulating the process of virus entry into host cells, impacting its infectivity (Fig. 6B).
According to the research findings, it was observed that among the mononuclear cell-related genes, DPY19L1, MAP3K5, SAMD12, and AK9 showed a positive correlation (OR > 1) with the AAV receptor integration process. Additionally, POLR1E, SLC22A5, SOX4, and XBP1 were found to exhibit a negative correlation (OR < 1) with the AAV receptor integration process (Fig. 6C). Further gene function prediction and interaction network analysis revealed the distinct roles these genes play in regulating the AAV receptor integration process. Among them, XBP1 emerged as one of the most significant participants. Acting as a transcription factor, XBP1 is involved in multiple crucial biological processes, including endoplasmic reticulum protein folding, endoplasmic reticulum stress, and the unfolded protein response (Fig. 6D). In summary, the aforementioned results provide insights into the diverse roles and mechanisms of immune cell-related genes in the AAV receptor integration process, aiding in a deeper understanding of the biological events and interrelationships involved in this process.
XBP1 indirectly participates in the regulation of immune suppression in B cellsBased on key findings from transcriptome sequencing data, we identified CCL2 as the target gene for further investigation. Subsequently, through comprehensive analysis of single-cell transcriptome sequencing data, we successfully pinpointed B lymphocytes and monocytes as two critical immune cell types. In B lymphocytes, Mendelian randomization analysis confirmed NUP85 as a pivotal gene, while in monocytes, XBP1 emerged as an important candidate gene. The selection of CCL2, NUP85, and XBP1 for functional prediction and interaction analysis was based on their significant expression changes observed in both transcriptome and single-cell data, as well as their verified roles via Mendelian randomization analysis in specific cell types. To further elucidate the functions of these genes and the biological pathways they are involved in, we conducted KEGG and GO enrichment analyses (Fig. 7A). The KEGG analysis revealed that these genes participate in viral protein-cytokine interactions, chemokine signaling pathways, and cytokine-receptor interactions (Fig. 7B). According to the GO analysis results, these genes are involved in several key biological processes, including myeloid cell differentiation, cell chemotaxis, leukocyte migration, and chemotaxis, which play crucial roles in immune system regulation, infection defense, and tissue repair. Additionally, in terms of cellular components, the endoplasmic reticulum lumen emerged as an important structure, while in terms of molecular functions, these genes are implicated in chemokine receptor binding, cytokine receptor binding, and G-protein coupled receptor binding, among others (Fig. 7C).
Fig. 7
Functional prediction and interactome analysis of CCL2, NUP85, and XBP1. A Prioritizing CCL2, NUP85, and XBP1 using GeneMANIA for functional analysis. B Bar graph representing the predicted genes’ KEGG pathways following analysis using GeneMANIA. C Bubble chart representing the predicted genes’ GO biological processes following analysis using GeneMANIA. D The gene expression levels of CCL2, NUP85, and XBP1 were analyzed in the transcriptome sequencing data
While XBP1 is predominantly expressed in monocytes, it may indirectly influence B cell function by modulating the production of cytokines such as CCL2. As a chemokine, CCL2 plays a critical role in attracting and activating various immune cells, including B cells. Consequently, alterations in XBP1 expression within monocytes could impact B cell migration, activation, or differentiation through the regulation of CCL2 production. Moreover, XBP1 may also indirectly affect B cell function by influencing interactions between monocytes and B cells, such as antigen presentation and costimulatory signaling. This hypothesis was validated using transcriptome data analysis (Fig. 7D), which demonstrated decreased expression levels of CCL2 and NUP85, alongside increased expression of XBP1 following AAV injection. These changes in gene expression may significantly influence the brain’s immune microenvironment. Specifically, reduced expression of CCL2 and NUP85 may collectively contribute to an immunosuppressive state within the brain, mitigating unnecessary inflammatory responses and immune cell activation, thereby protecting the brain from potential damage. Additionally, elevated XBP1 expression may further modulate the brain’s immune microenvironment by regulating monocyte and other immune cell functions. Furthermore, increased XBP1 expression may suggest that cells are experiencing endoplasmic reticulum stress post-AAV injection, potentially related to the processing, trafficking, or expression of the AAV vector within cells, which could impact cell survival and proliferation.
Taken together, while there is currently insufficient direct evidence to demonstrate a direct interaction between XBP1 and B cells via the MDK-NCL signaling pathway, we propose a hypothetical mechanism: alterations in XBP1 expression in monocytes may indirectly influence B cell function by modulating pathways such as CCL2. This proposed mechanism offers a novel perspective on MDK-NCL-dependent immune suppression in the brain and suggests potential avenues for future research. Further experimental validation is essential to elucidate the precise nature and mechanisms of these interactions.
Comments (0)