
Remember me


The studies were approved by the University of Melbourne Ethics Committee (#10452) and adhered to the National Health and Medical Research Council of Australia’s guidelines for the care and use of animals in scientific research. Foxp3rfp+/+ and CD8GFP+/− mice were bred in the University of Melbourne Bioresources Platform. Foxp3RFP+/+ mice are engineered to express a red fluorescent protein (RFP) in Foxp3+ cells [4]. CD8GFP+/− mice (RRID: IMSR_JAX:008766, The Jackson Laboratory, USA; https://www.jax.org/strain/008766) express a green fluorescent protein (GFP) in CD8+ T cells. Female CD8GFP+/− mice were mated with CD8GFP−/− male mice to generate pregnant mice, and the heterozygous offspring were studied. All mice were housed at 21–22°C under a 12 h light/dark cycle, kept in group housing to promote social interaction, and had ad libitum access to food and water. All mice had a C57BL/6J background.
Oxygen-induced retinopathy and diabetes modelsInduction of retinopathy was performed as described previously [4, 16, 17]. As sex does not influence OIR [18], both male and female mouse pups were studied. Pups and their nursing mothers were exposed to hyperoxia (75% oxygen) for 22 h per day between postnatal days 7 and 12 (P7 and P12) in specialised chambers with an atmosphere that was maintained using a Pro-ox 110 gas regulator (Biospherix) attached to medical-grade oxygen cylinders (BOC Gas) to allow retinal neovascularisation to develop. Age-matched control mice were housed in room air (21% oxygen) from birth until P18 (Fig. 1a). The body weight for each pup was recorded (ESM Table 1) and pups were killed at P18 using sodium pentobarbitone (150 mg/ml, Virbac). For studies of diabetes, all 6- to 8-week-old male Foxp3RFP+/+ and CD8GFP+/− mice were assigned a number and then numbers were randomly selected by another researcher to receive streptozocin (50 mg/kg, Sigma) to induce diabetes or citric acid buffer (pH 4.5) by i.p. injection once each day for 5 consecutive days (Fig. 1b). Mice did not receive insulin. Female mice were not studied as they do not develop severe diabetic retinopathy. Blood glucose levels were measured 7 days after the first streptozocin injection and, if above 12 mmol/l, mice were considered diabetic. HbA1c levels were measured using a Cobas B 101 analyser (Roche).
Fig. 1
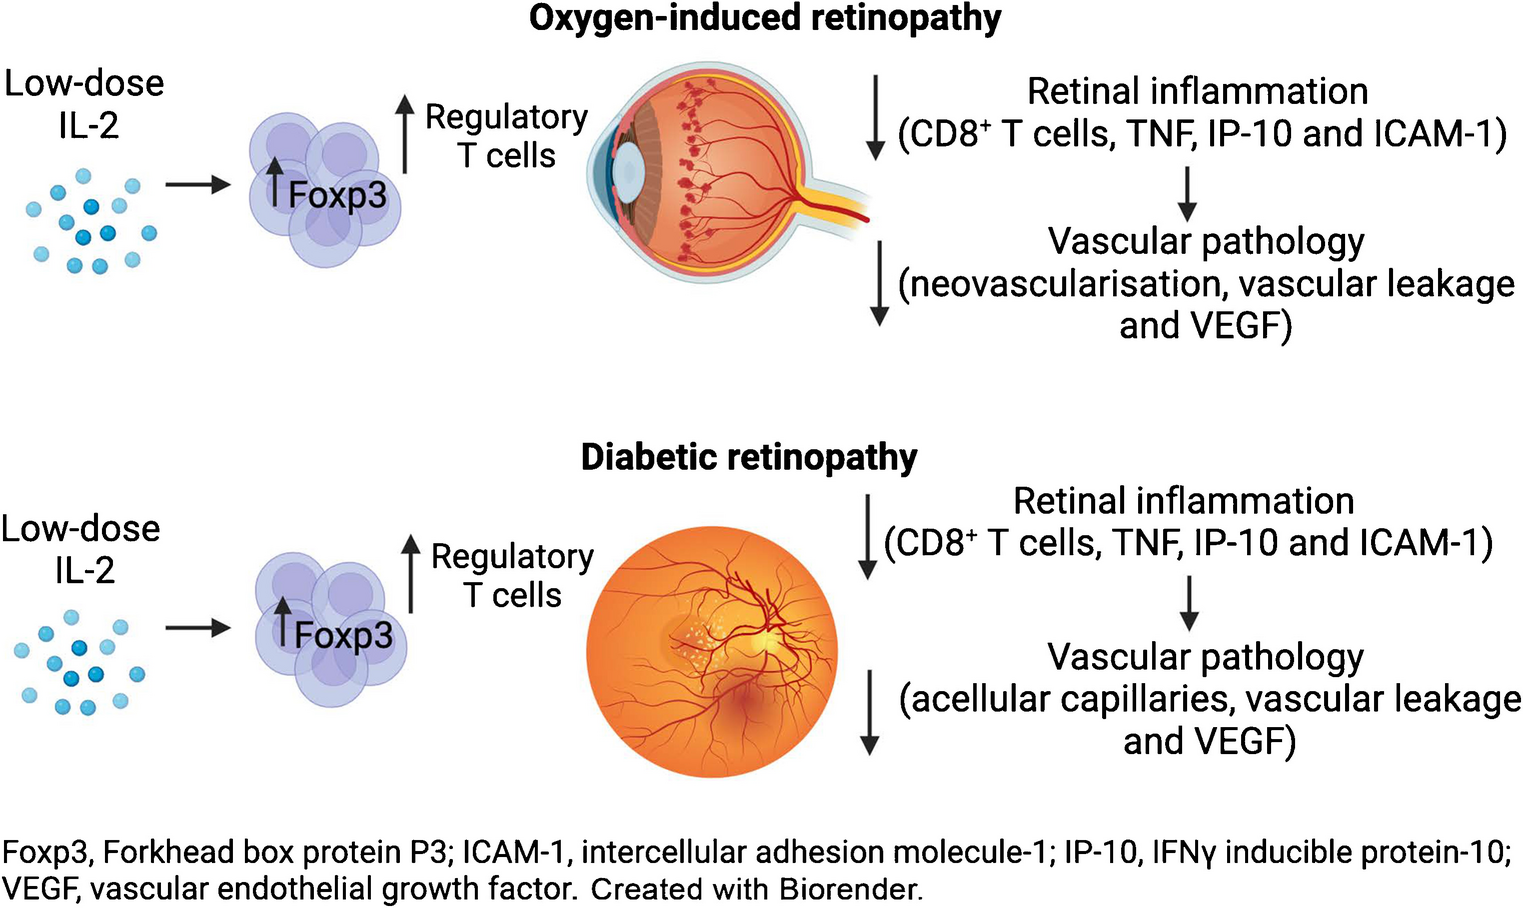
Experimental protocols and low-dose IL-2 treatment in mice. (a) Oxygen-induced retinopathy. Low-dose IL-2 was administered by daily i.p. injections for 5 days from P5 to P9 and then once every 3 days until P18. (b) Diabetic retinopathy. Seven days after the administration of streptozocin, diabetic mice were administered low-dose IL-2 by i.p. injection once per day for 5 days and then once every 3 days for 26 weeks. Created with BioRender
Treatment with IL-2IL-2 has a short half-life, being rapidly cleared from the circulation in <7 min [11]. Previous studies have determined a suitable schedule of administration to achieve an increased ratio of Tregs to T effector cells [19]. In mice, the induction phase to obtain the maximum increase in Tregs comprises a 5-day course of daily i.p. injections of IL-2. The maintenance phase to achieve sustained long-term increases in Tregs comprises i.p. injections once every 3 days [19].
As treatment with IL-2 can influence the abundance of effector immune cells such as NK cells, natural killer T cells (NKT cells) and CD8+ T cells, particularly when administered at high doses [20], the effect of low-dose IL-2 was compared with that of high-dose IL-2 in OIR studies. Litters of mice were randomised to be room air controls, OIR controls, OIR + low-dose IL-2 or OIR + high-dose IL-2, and studied at P18. Recombinant mouse IL-2 (#402-ML-500CF, R&D systems) in sterile water (pH 7.4) was administered as low-dose IL-2 (25,000 U) or high-dose IL-2 (250,000 U) via daily i.p. injections (50 µl) for 5 days from P5 to P9, then once every 3 days until P18, as described previously, in studies of diabetes [14, 20] (Fig. 1a). Control mice were administered vehicle (sterile water, 50 µl) using the same protocol. OIR mice were studied only if they showed consistent body weight gain in accordance with the criteria for OIR studies [4, 21]. In diabetes studies, 7 days after the administration of streptozocin, mice were randomised to receive low-dose IL-2 (25,000 U) or sterile water (controls) by i.p. injection (100 µl) once per day for 5 days and then once every 3 days for 26 weeks (Fig. 1b).
Flow cytometry of blood, pooled lymph nodes and spleenSamples were prepared as described previously [4]. Peripheral lymph nodes and spleens were mechanically disrupted and sieved through a 40 mm strainer to generate single-cell suspensions. For blood and spleen cells, 1 × RBC lysis buffer (#00–4333−57, eBiosciences) was used to remove erythrocytes. One million cells were incubated for 45 min at 4°C with the following antibody cocktails: (1) CD3 FITC (11–0032−82, RRID: AB_2572431, Thermo Fisher Scientific), CD4 BV786 (563727, RRID: AB_2728707, BD Biosciences), CD8 BV711 (563046, RRID: AB_2869451, BD Biosciences) and NK1.1 APC (550627, RRID: AB_398463, BD Biosciences) to detect NK, NKT and CD8+ T cells; and (2) CD3 APC-Cy7 (100222, RRID: AB_2242784, BioLegend), CD4 BV786 (563727, RRID: AB_2728707, BD Biosciences), CD8 BV711 (563046, RRID: AB_2869451, BD Biosciences), CD25 APC (561048, RRID: AB_10562035, BD Biosciences), cytotoxic T-lymphocyte-associated protein 4 (CTLA-4) PE (12–1522−82, RRID: AB_465879, Thermo Fisher Scientific), programmed cell death protein 1 (PD-1) PE-Cy7 (109109, BioLegend, RRID: AB_572016) and T cell immunoreceptor with immunoglobulin and immunoreceptor tyrosine-based inhibitory motif (ITIM) domain (TIGIT) BV421 (565270, RRID: AB_2688007, BD Biosciences) to detect Tregs and their activation markers. For intracellular staining of Foxp3+ Tregs, cells were further treated with fixation/permeabilisation solution (Thermo Fisher Scientific, 00–5523−00) according to the manufacturer’s protocols, and stained using Foxp3 antibody (Foxp3-PE-eF610, 61–5773−82, RRID:AB_2574624, eBiosciences). Cells were collected using a Fortessa X-20 flow cytometer (BD Biosciences) and analysed using FlowJo software (Tree Star version 10, BD Biosciences).
Quantification of Foxp3RFP+ and CD8GFP+ T cells in retinaEyes from Foxp3RFP+/+ and CD8GFP+/− mice were collected and fixed in 4% paraformaldehyde in 0.1 M PBS for 30 min. The eyes were immediately flat-mounted and stained with DyLight 594 (1/100, DL-1207, VectorLabs) or FITC-conjugated isolectin GS-IB4 (1/100, L2895, Sigma) overnight at 4°C. RFP-expressing Tregs and GFP-expressing CD8+ T cells were imaged using a Nikon A1r confocal microscope at 20× magnification. Imaging was performed in the inner retina associated with neovascularisation, comprising the inner limiting membrane and ganglion cell layer. In diabetic mice, imaging was performed between the inner limiting membrane and outer nuclear layer. Twelve non-overlapping fields per retina were imaged and Foxp3RFP+ Tregs and CD8+ T cells counted and expressed as the number of cells per field.
Retinal neovascularisation and vaso-obliterationQuantification in OIR retinas was performed as described previously [4, 6]. The eyes were fixed in 4% paraformaldehyde in 0.1 M PBS for 30 min at room temperature. Retinal flat mounts were stained with FITC-conjugated isolectin GS-IB4 and imaged using a Zeiss Axio microscope attached to an AxioCam MRc camera (Carl Zeiss). Entire retinal montages were obtained using the tiling tool in the AxioObserver software (version 5.3, Carl Zeiss). ImageJ (https://imagej.net/ij/) was used to quantify neovascularisation and vaso-obliteration using the threshold and freehand tools, respectively.
ELISAIn OIR studies, retinas were digested in 200 µl of TE-PER buffer (Invitrogen) containing a phosphatase/protease inhibitor cocktail (1/100, Thermo Fisher) using a bullet blender tissue homogeniser (Next Advance, New York, USA) at speed 9 for 5 min at 4°C. Protein lysates were centrifuged at 11,179 g for 10 min at 4°C, and supernatants were collected. Samples were run in duplicate for the ELISA assays using mouse albumin for vascular leakage (E-90AL, Immunology Consultants Laboratory, Portland, OR, USA) or mouse VEGF (DY493, R&D Systems) according to the manufacturer’s instructions. A limitation of the OIR studies is that vascular perfusion was not performed to exclude any contribution of albumin present in retinal blood vessels. In diabetic studies, vascular leakage was assessed by quantifying the albumin levels in the vitreous humour [17]. The total protein concentration of retinal homogenates and vitreous humour samples was measured using a Bradford assay (Bio-Rad). Albumin and VEGF levels were normalised to the total protein concentration.
Retinal acellular capillaries in diabetesEyes were fixed with 4% paraformaldehyde in 0.1 M PBS for 1 h, and stored in 0.2 M Tris buffer (pH 8) at 4°C until use [22]. Retinas were digested in trypsin (3% in 0.2 M Tris buffer, pH 7.4) on a shaker at 37°C for 1 h, and incubated in Tris buffer on a rotator to remove loosely attached cells. The retinal vasculature was mounted on a slide and stained using periodic acid/Schiff reagent and haematoxylin. Twelve non-overlapping fields per retina were imaged at 200× using a Nikon UI microscope, and the number of acellular capillaries counted as described previously [22, 23].
Real-time PCRThe methods used for real-time PCR are as described previously [4, 6]. Total RNA from a single retina was extracted using the RNeasy mini kit (Qiagen) and 500 ng RNA was subjected to DNase treatment (DNA-free kit, Ambion Life Technologies) and reverse transcription (Invitrogen). mRNA expression was normalised to that of 18s rRNA and is expressed as fold change using the comparative 2−ΔΔCt method. The primer sequences for VEGF A, TNF and intercellular adhesion molecule1 (ICAM-1) were as published previously [4, 6]. The primer sequences for IP-10 were 5′-ATCATCCCTGCGAGCCTATCCT-3′ (forward primer) and 5′-GACCTTTTTTGGCTAAACGCTTTC-3′ (reverse primer).
Statistical analysesStatistical analyses were performed using GraphPad Prism version 9.0. Sample size calculations were based on prior studies and power analyses, aiming for 80% statistical power to detect significant effect size and minimise animal use. Data are presented as means ± SD. Normality was tested using Shapiro–Wilk tests. For normally distributed data, all groups were compared using one-way ANOVA, followed by the Holm–Šídák post hoc test. For non-normally distributed data, the Kruskal–Wallis test, followed by Dunn’s post hoc test, was used. Results were considered statistically significant at two-tailed p values less than 0.05. Experimental groups were randomised, and each data point represents an individual mouse or sample. Investigators were blinded to the experimental groups.
Comments (0)