
Remember me

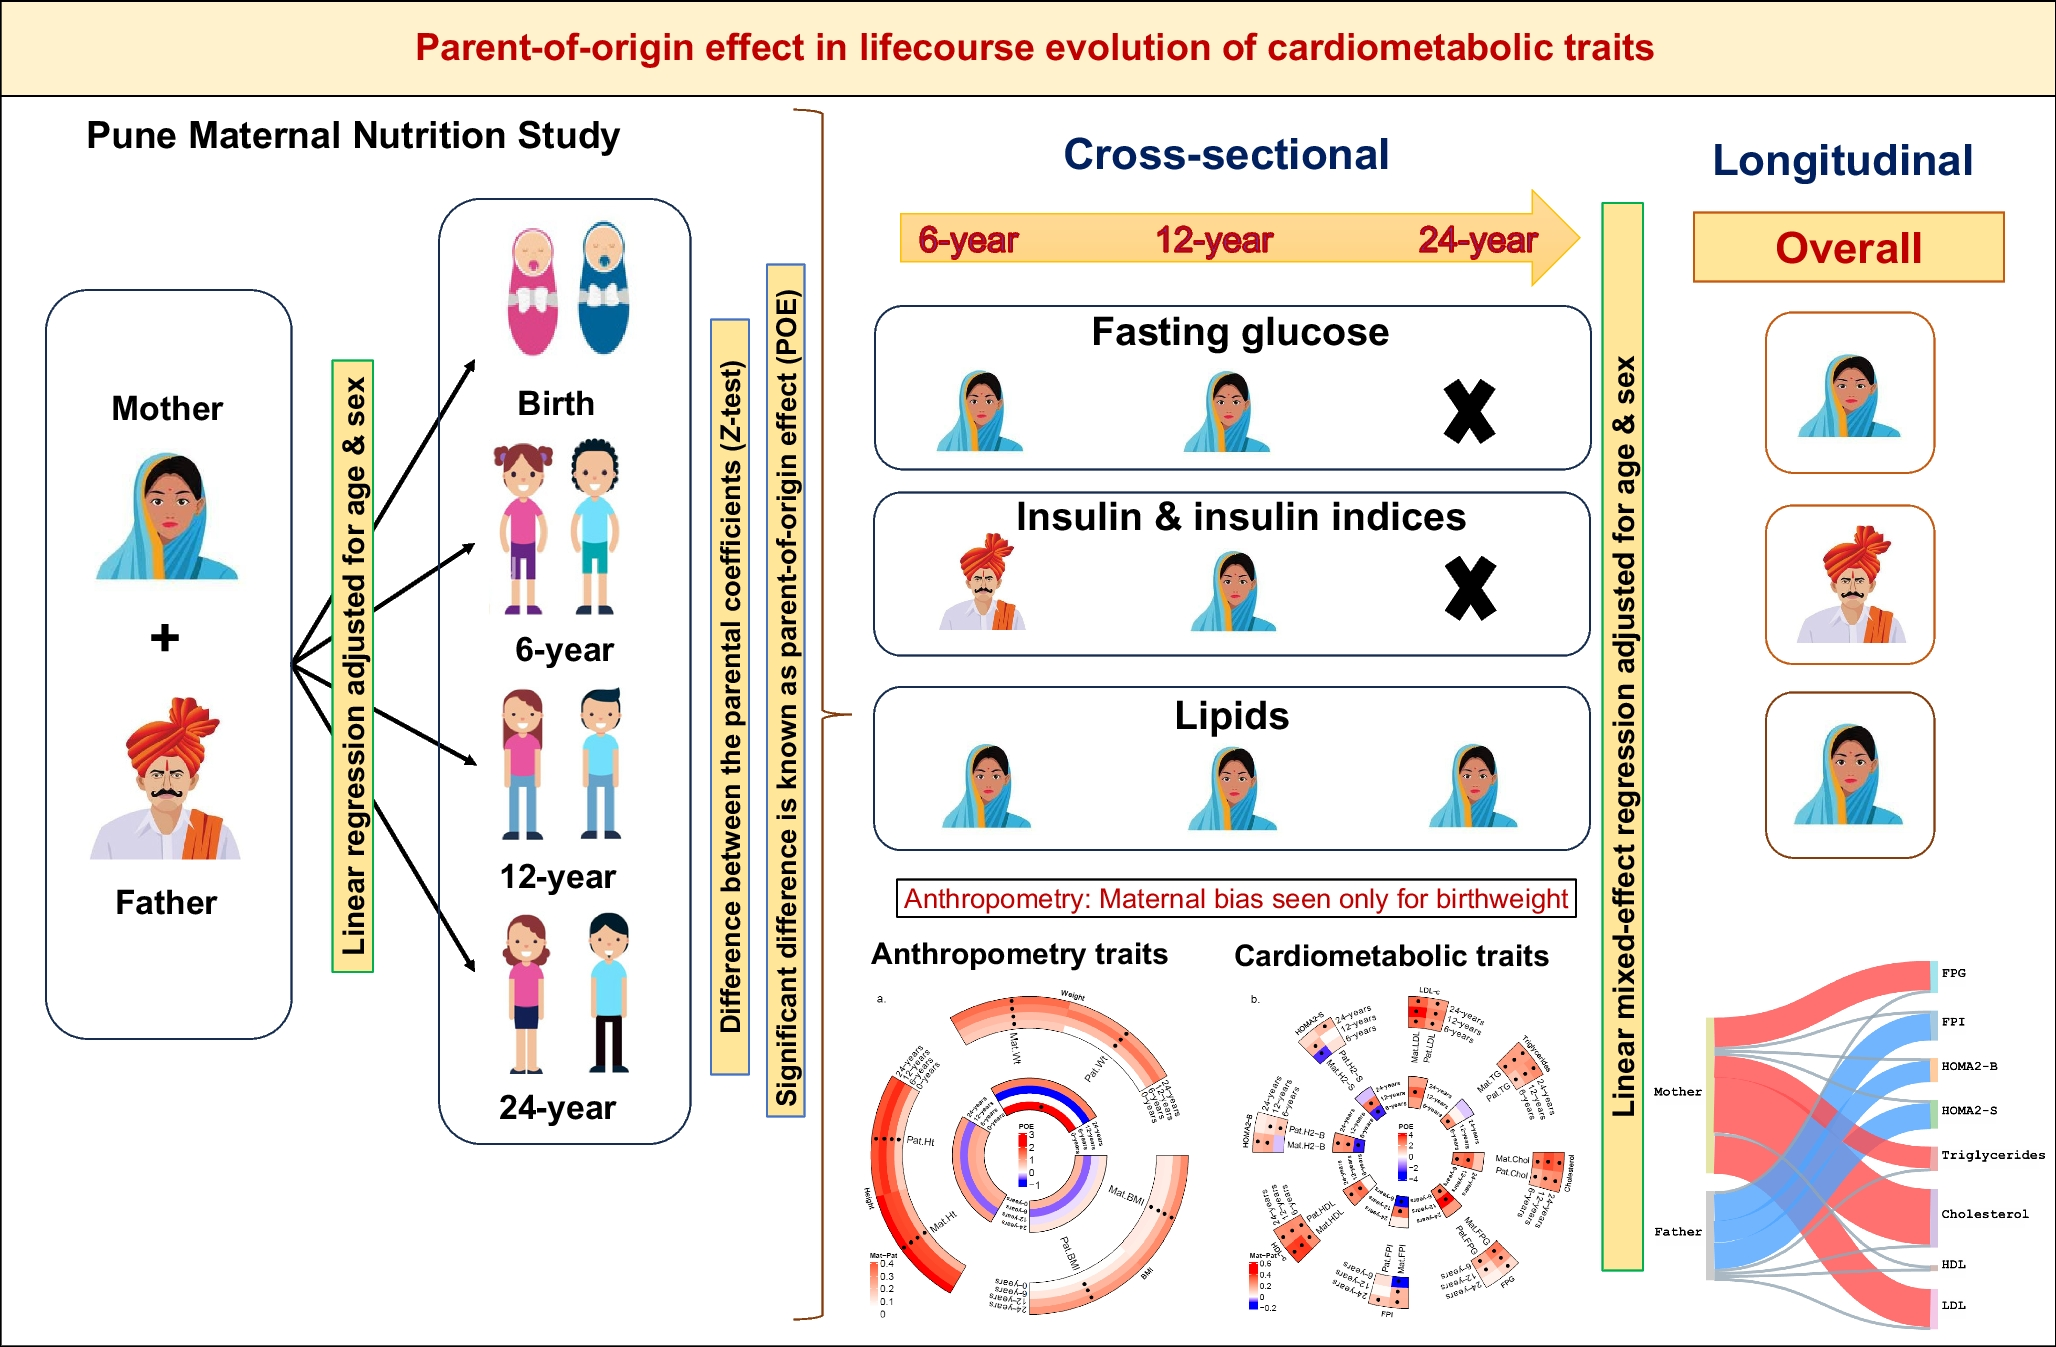

The PMNS birth cohort comprises approximately 700 parent–offspring trios with serial measurements for anthropometric traits at birth and at 6, 12 and 24 years old, and for cardiometabolic traits at 6, 12 and 24 years old (Fig. 1). The parents were on average short and underweight (based on WHO criteria for stunting and obesity [32,33,34]) before and during pregnancy. The offspring achieved greater height and weight than their parents, and had substantially higher levels of circulating macronutrients as adults (ESM Tables 2A and 2B). To investigate the proportion of offspring phenotypic traits attributable to parent phenotype variation through the life course, we calculated heritability estimates for cardiometabolic traits at available timepoints (ESM Tables 3 and 4). We next examined whether there was an association between the trait of the offspring and the trait of the mother (maternal effect) or between the trait of the offspring and the trait of the father (paternal effect). If offspring traits showed a significantly stronger association with the mother’s traits compared with the father’s, this would indicate a maternal bias or maternal parent-of-origin effect, and similarly for paternal bias (paternal parent-of-origin effect).
Anthropometric traitsMost of the traits were heritable at all timepoints, with an increasing trend in the parental effect from birth to 24 years (Fig. 2a and ESM Tables 3 and 4). A significant maternal parent-of-origin effect was observed for birthweight when male and female offspring were analysed together (Table 1, Figs 2a and 3a). Daughters showed a significant paternal bias for the sum of skinfolds at 6 years, but a stronger maternal effect at 24 years. At 24 years, daughters also showed a maternal bias for weight, BMI, waist and hip circumference and WHR, but a paternal bias for WHR was observed for sons (Table 1 and ESM Table 5).
Fig. 2
Circular heatmaps for (a) anthropometric traits and (b) metabolic traits, representing the phenotype associations between maternal traits or paternal traits and the offspring traits at the various timepoints. The outer circle represents the β coefficients for mother–offspring associations and father–offspring associations. The inner circle represents the parent-of-origin effects expressed as Z values. The black dots indicate a significant p value (p<0.05). Wt, weight; Ht, height; Chol, cholesterol; FPG, fasting plasma glucose; FPI, fasting plasma insulin; H2-S, HOMA2-S; H2-B, HOMA2-B; HDL-c and HDL, HDL-cholesterol; LDL-c and LCL, LDL-cholesterol; TG, triglycerides; Mat, maternal; Pat, paternal; POE, parent-of-origin effects
Table 1 Parent-of-origin test for offspring anthropometric traitsFig. 3
Individual Sankey diagrams representing the parent-of-origin effects (expressed as Z values) separately for each phenotype at each available timepoint: (a–d) anthropometric traits; (e–h) glycaemic traits; (i–l) lipids. A significant maternal bias is indicated in red, and a significant paternal bias is indicated in blue. Insignificant parent-of-origin effects are represented in grey. HDL-c, HDL-cholesterol; LDL-c, LDL-cholesterol
Glucose and insulin indicesFor fasting glucose concentrations, the maternal effects were significantly stronger than the paternal effects at 6, 12 and 24 years (Figs 2b and 3e, f and Table 2), in all offspring combined as well as sons only. These effects were seen only at 12 years old in daughters.
Table 2 Parent-of-origin effects for cardiometabolic traitsA contrasting shift from 6 years to 12 years was observed for the paternal and maternal effects in relation to insulin and its indices. For fasting insulin and HOMA2-S, there was a significant negative maternal association at 6 years, which shifted to a significant positive one at 12 years, reflecting a change in the direction of the parent-of-origin effect. For HOMA2-B, there was a stronger positive paternal effect at 6 years, which changed to a stronger positive maternal effect at 12 years and continued to show a maternal effect at 24 years (Figs 2b and 3g, h and Table 2).
In sons, fasting insulin and HOMA2-S showed a significant negative maternal association at 6 years, which shifted to a positive one at 12 years, and the parent-of-origin effects were significant only at 6 years. HOMA2-B showed a paternal bias at 6 years, which shifted to a maternal effect at 12 years. In daughters, a positive maternal bias was seen for fasting insulin and HOMA2-S at 12 years and for HOMA2-B at 24 years (Table 2).
Lipid levelsA strong and consistent maternal effect was seen for triglycerides, total cholesterol, HDL-cholesterol and LDL-cholesterol at all timepoints (Figs 2b and i–l). A similar association was seen when analyses were performed separately for sons and daughters (Table 2).
Longitudinal modelling by mixed-effect modelsGiven the availability of the measurements across multiple timepoints, we assessed the overall parent-specific effects using longitudinal mixed-effect models. A significant association of anthropometric traits with each of the parents was seen; however, no parent-of-origin effects were observed (ESM Table 6). For cardiometabolic traits, stronger maternal bias was observed for fasting glucose, triglycerides and cholesterol, while stronger paternal bias was observed for fasting insulin, HOMA2-B and HOMA2-S, when all offspring were analysed together, reflecting the pooled effect for each parent for all timepoints combined. Similar associations were also seen for sons separately, with addition of stronger maternal effects for HDL-cholesterol. However, for daughters, stronger maternal bias was seen only for cholesterol (ESM Table 7 and ESM Fig. 2).
Parent-of-origin effects in the PCS birth cohortTo assess whether similar patterns of parent-of-origin effects could be observed in another birth cohort, we used the data from the cohort in the PCS, comprising approximately 400 trios with follow-up at 4, 8 and 21 years. We used the models described above to assess heritability and parent-of-origin effects on cardiometabolic traits. Anthropometry data were available at 4, 8 and 21 years, and data for other cardiometabolic traits were available at 8 and 21 years.
For all offspring combined, as well as sons and daughters separately, heritability estimates were concordant with those seen in the PMNS for anthropometric and lipid traits. For anthropometric measures, the increasing trend in the paternal effects from 4 to 21 years in the PCS mirrored that in the PMNS from 6 to 24 years. For glucose–insulin traits, heritability estimates were significant for fasting glucose, HOMA2-B and HOMA2-S at 8 years, and that for fasting plasma glucose was significant at 21 years for all offspring combined. For the analysis of sons and daughters separately, heritability estimates were significant for fasting glucose at 8 and 21 years (ESM Table 8).
Some of the parent-of-origin effects in the PMNS were also seen in the PCS. Similar to the PMNS, no parental bias was seen for anthropometric traits, with the exception of a maternal bias for height at 8 years (ESM Table 9). We observed a maternal bias for fasting glucose and fasting insulin at 8 years, similar to that seen in the PMNS at 12 years for all offspring. A similar trend was seen for HOMA2-B and HOMA2-S at 8 years (ESM Table 10).
A consistent maternal bias was seen at 8 and 21 years for cholesterol, and a stronger maternal effect was seen at both timepoints for triglyceride levels for all offspring combined. A stronger maternal effect was also seen for HDL-cholesterol at 21 years for all offspring combined, similar to that seen in the PMNS at 24 years. Similar effects on cholesterol and HDL-cholesterol were also seen for sons and daughters separately (ESM Table 10).
Genetic parent-of-origin effects in PMNS KCNQ1 locusThe rs2237892 SNP at the KCNQ1 locus was previously shown to display parent-of-origin effects on type 2 diabetes risk and insulin secretion [8, 14, 26]. Here we examined whether the same variant showed similar effects on HOMA2-B at 6, 12 and 24 years, and found that the KCNQ1 variant showed significant parent-of-origin specific associations at 12 and 24 years, with the previously reported type 2 diabetes risk and insulin secretion-lowering maternal allele C lowering (and the alternate T allele increasing) HOMA2-B at 12 and 24 years. Although the same association was not statistically significant at 6 years, the direction of effect was the opposite, similar to that seen in the phenotype correlations (Table 3).
Table 3 Genetic parent-of-origin effects of variants at KCNQ1, KLF14 and MOB2 on relevant cardiometabolic traitsWe also found significant parental effects on birthweight, triglycerides at 6 years and HDL-cholesterol at 12 years (Table 3).
KLF14 locusA maternal parent-of-origin effect was seen for the rs4731702 variant at the KLF14 locus for triglyceride levels at 6 and 24 years. The type 2 diabetes risk-increasing maternal allele C [14] in the KLF14 variant increased triglyceride levels while the T allele decreased them. The maternal T allele also increased the sum of skinfolds at 6 years (Table 3).
MOB2 locusThe rs2334499 variant at the MOB2 locus showed significant maternal effects at 6, 12 and 24 years, with significant parent-of-origin effects at 12 years. Previous studies showed that the T allele of the MOB2 variant increased type 2 diabetes risk when inherited from the father but decreased type 2 diabetes risk when inherited from the mother [14]. In our study, the maternal T allele decreased HDL-cholesterol levels at 6, 12 and 24 years (Table 3).
Comments (0)