This study showed that clinically invisible microvascular changes of PD, VD and FAZ can be detected by OCTA in type 2 diabetes, especially in participants with SIDD and MOD, with a known duration up to 1 year, without any evidence of diabetic retinal neurodegeneration or functional deficits. Moreover, our findings indicate that MAs and signs of retinal neurodegeneration occur simultaneously.
Retinal microvascular parameters
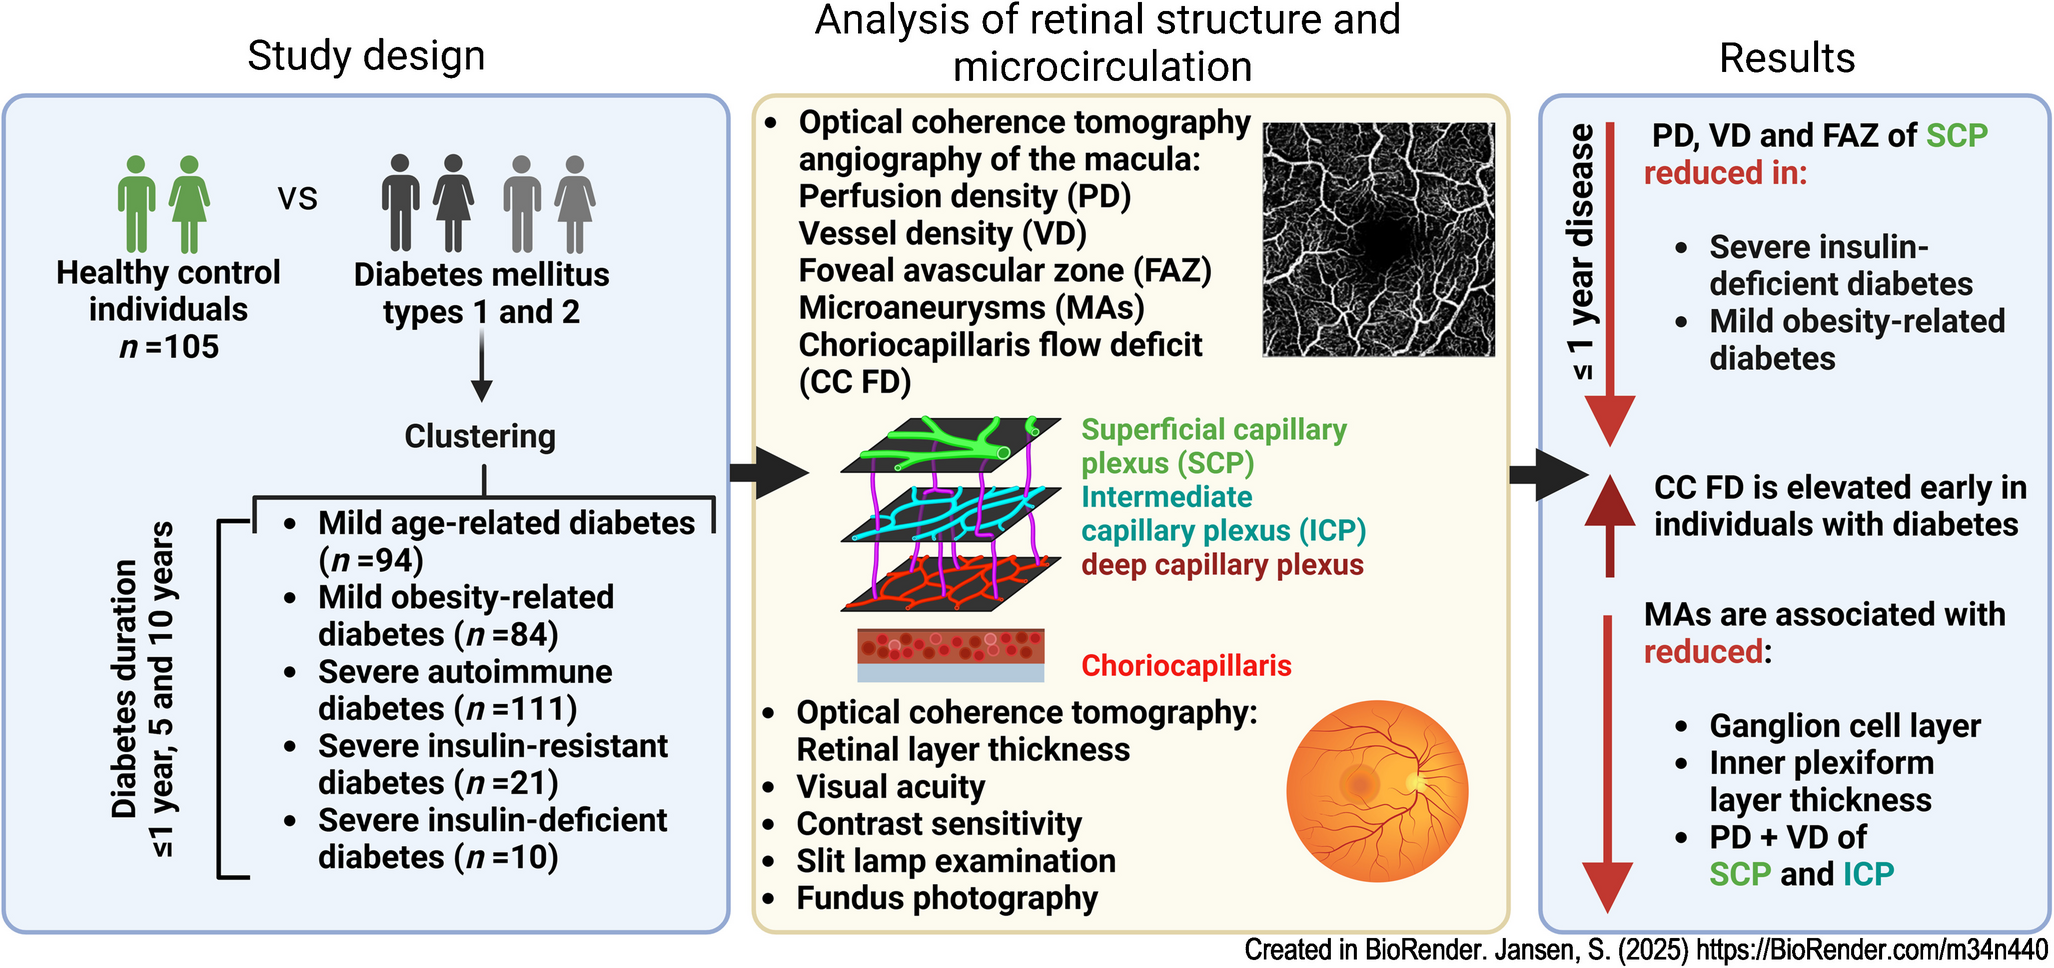
Consistent with other publications, we found an association between diabetes and reduced PD before clinical signs of diabetic retinopathy appeared [6, 21,22,23,24]. However, while reduced superficial macular capillary flow has previously been observed after more than a year of type 2 diabetes, we noted reduced PD and VD even within the first year after diagnosis.
Lee et al found reduced VD in the SCP in individuals with type 2 diabetes with a mean disease duration of 3.5 years [21]. Tan et al showed a reduced retinal capillary density in the macular SCP and DCP in individuals after a mean duration of type 2 diabetes of 5.5 years [22]. Vujosevic et al demonstrated microvascular changes, including capillary loss in both the superficial and deep plexus, in individuals with type 1 diabetes after 16.3 years and in those with type 2 diabetes after 7.7 years, as detected by OCTA [24].
Another important finding from our data is that the three levels of the capillary plexus are affected to varying degrees by diabetes. The earliest diabetes-related alterations are found in the choriocapillaris and SCP, and later in the DCP. The ICP is not involved within up to 10 years. An anatomical reason could be that the intermediate plexus is not always clearly defined [25].
Consistent with other publications, an enlarged FAZ, increased FAZ perimeter and reduced FAZ circularity in the SCP were observed in individuals with diabetes without diabetic retinopathy compared with healthy control individuals [26]. This increase in FAZ was detectable within the first year of the disease and was accompanied by reduced SCP perfusion, consistent with other studies [27]. Capillary occlusions are suspected to be the most likely cause of the increase in FAZ in diabetes [28].
We were able to demonstrate that the SIDD subtype, known for its high risk of developing diabetic retinopathy [13], and MOD, characterised by obesity and moderate insulin resistance [14], are more likely to exhibit microvascular changes in the SCP compared with SAID. In SIDD, the microvascular retinal changes in the SCP are different in comparison with all other clusters. This effect is intriguing as SIDD closely resembles metabolic features of type 1 diabetes, except for the absence of islet-directed antibodies. The older age at diagnosis in SIDD compared with type 1 diabetes, along with a relatively later start of insulin therapy and persistent hyperglycaemia, may explain the higher frequency of retinal microangiopathy observed in SIDD.
No early changes in VD or PD in the SCP were observed in type 1 diabetes, but a smaller FAZ perimeter and greater circularity were found compared with type 2 diabetes. This may be explained by both the lower age and lower rates of comorbidities such as hypertension, dyslipidaemia and obesity, which are known risk factors of endothelial dysfunction [29, 30]. In our cohort, individuals with type 1 diabetes showed a lower prevalence of hypertension as well as lower BMI (Table 1). However, the effect on perfusion remained statistically significant even after adjustment for these parameters. Moreover, individuals with type 2 diabetes are more likely to initially develop diabetic macular oedema than those with type 1 diabetes [31], while those with type 1 diabetes are more prone to diabetic retinopathy [32]. This could be explained by the longer asymptomatic phase of dysglycaemia before diagnosis and the associated longer exposure to metabolic dysregulation in type 2 diabetes with higher susceptibility to macular vascular damage [29]. Interestingly, Fleissig et al demonstrated a higher rate of crossing vessels through the fovea and a less severe FAZ in individuals with type 1 diabetes compared with those with type 2 diabetes, consistent with our findings. It is conceivable that individuals with type 1 diabetes release early protective factors that may lead to secondary capillary remodelling [33].
The altered choriocapillary perfusion observed early in type 1 and type 2 diabetes, as shown here and by others [27], may correspond to choriocapillaris occlusions caused by hyperglycaemia-induced leukostasis and inflammation [34].
MAs
Widefield swept-source OCTA is comparable to ultra-widefield fluorescein angiography in the detection rate of MAs, intraretinal microvascular abnormalities and neovascularisations [35]. Moreover, OCTA allows the detection of early ophthalmoscopically undetected retinal diabetic changes [36]. We showed that only 9% of the MAs detected by OCTA were visible in the fundus photography.
Another novel association we found was reduced GCL and IPL thickness as well as reduced PD and VD in individuals with diabetes when MAs were detectable on OCTA. Reduced perfusion in the SCP and ICP may be responsible for the thinning of GCL and IPL, which is described as the earliest neurodegenerative change before the onset of diabetic retinopathy [37, 38]. Qiu et al showed that the GCL cell complex correlates with the VD of SCP and DCP as well as the severity of diabetic retinopathy, suggesting an interaction between retinal microvasculopathy and neuronal degeneration [39]. We found no relationship between MAs in the DCP and the thickness of the INL and OPL, which are anatomically located at the same level [38].
Another important observation is the association between non-invasive detection of MAs using OCTA and blood pressure, which reflects perfusion disturbances and thus provides insights into cardiovascular and metabolic status. As Yao et al, we observed reduced PD and VD in the SCP of individuals with diabetes, but without evidence of an influence of blood pressure on retinal microcirculation [40]. One explanation could be that our cohort consisted of individuals highly motivated to adhere to the therapy recommendations [12].
Retinal neurodegenerative alterations
Several studies have indicated that the retinal neurodegenerative component already occurs before the onset of diabetic retinopathy substantiated by retinal thinning of the inner retina including the GCL, RNFL and IPL, and functional deficits demonstrated by colour vision deficits, delayed dark adaptation, visual field defects, poorer CS and abnormal multifocal electroretinogram [41,42,43]. A longitudinal study investigating neurodegenerative changes in the macular retinal layers in type 1 diabetes demonstrated a significant decrease in RNFL and GCL [44].
We recently demonstrated that individuals from the GDS baseline cohort showed no signs of neurodegenerative damage to the retina as detected by retinal thickness measurements using spectral-domain optical coherence tomography [15]. However, we now have evidence of neurodegeneration, as measured by reduced GCL, IPL and ONL in individuals with diabetes when MAs are present on OCTA. Since MAs were found more frequently after 5 and especially after 10 years, the neurodegenerative changes appear to be time-dependent and linked to vascular changes (Tables 14, 15). Otherwise, specific characteristics of our study cohort as a highly motivated and informed group with conscious disease management and exclusion of participants with very high HbA1c levels could account for the overall lack of evidence of general thinning of retinal inner layers. The resulting improved treatment adherence may prevent neurodegeneration [12].
Another interesting observation emerged from our diabetes subtype analysis, indicating that the SIDD subtype has lower RPE thickness than individuals with SAID. According to clinical and animal data, RPE damage in the early stages of diabetes could serve as an early biomarker for disease progression [45]. Consistent with our results, Yang et al found that RPE thickness in type 2 diabetes is associated with the risk of the microvascular phenotype (diabetic retinopathy, macular capillary loss) [45]. It is possible that the relatively late start of insulin treatment and metabolic control explains the higher risk of diabetic retinopathy and polyneuropathy [13], initially manifested by reduced capillary density in the SCP or RPE dysfunction, and, as we show, reduced choriocapillary flow.
Physiological effects
Consistent with previous studies, we found progressive thinning with age of total retinal thickness, and of GCL, IPL, ONL and RPE, and larger values of total retinal thickness, INL, ONL, RNFL and PD in male participants [46,47,48]. CS decreases with age and, in contrast to the literature, we found that CS is lower in male participants [49]. This finding might be consistent with the hypothesis that women tend to perform better in near vision, while men typically perform better in accurately perceiving and estimating the size of distant objects (hunter–gatherer hypothesis) [50].
Men exhibited a smaller FAZ than women, likely due to their greater central retinal thickness observed in our study. When the study was designed, it was decided to determine the gender of participants through self-report. This could result in discrepancies between self-assessment and biological sex and, under certain circumstances, comparability with studies that determined biological sex could be limited.
Limitations
As the primary aim of this study was to investigate early diabetes-associated changes in the capillary system of the macula, a cross-sectional design was used, which inherently limits the study. To rule out early functional neurodegeneration, it would be ideal to include multifocal electroretinography, along with CS assessments, which was not feasible in this large-scale study. Selection bias cannot be ruled out when evaluating the GDS cohort [12].
The heterogeneous OCTA data in diabetic retinopathy result from inconsistent nomenclature, varying quantification of OCT angiograms, OCT manufacturer-dependent algorithms, lateral resolution, scanning modes and different angiocube scan size, even with the same device [6].
A strength of the present study is the use of only one type of OCT/OCTA device and the combined approach of OCTA and OCT to evaluate neurodegenerative and microvascular changes. Another strength is the prospective long-term follow-up, including sophisticated metabolic phenotyping and quantitative assessment of diabetes-related chronic complications and comorbidities in all participants [12]. This advantage will be used to assess retinal microvascular and neurodegenerative changes in a longitudinal analysis in the future.
Conclusions
In the early stages of type 2 diabetes, particularly in individuals with SIDD and MOD, OCTA can detect alterations in capillary perfusion in the SCP of the macula. With longer disease duration, such alterations extend to both the SCP and DCP in type 1 and type 2 diabetes. Additionally, early alterations in the choriocapillaris in both diabetes types could serve as a potential early marker of the disease. Furthermore, OCTA-detected MAs, associated with thinning of the GCL and IPL and reduced PD in the SCP and ICP, may serve as biomarkers for preclinical retinal neurovascular damage. This study suggests that the SIDD subtype, characterised by early reduction in RPE thickness and microvascular changes, may represent the microvascular phenotype of type 2 diabetes.
All in all, these findings emphasise OCTA’s ability to detect early choroidal vasculopathy, reduced retinal perfusion and MAs associated with neurovascular alterations—key changes that occur before a decline in VA. Consequently, OCTA parameters could enable sensitive and comprehensive assessment of neurovascular interactions in the retina and potentially serve as endpoints for future intervention studies in preclinical diabetic retinopathy.


Comments (0)