
Remember me

This portion provides the details about the experimentation outcomes to verify the efficiency of the proposed approach using three datasets, i.e., two ultrasound and one histopathology dataset.
a.Dataset Description.
To evaluate the proposed segmentation model following datasets are utilized:
TNBC focuses on the Triple Negative Breast Cancer tissues, having 50 samples with 4022 annotations [36].
The UDIAT Dataset [37] is a publicly accessible small ultrasound dataset, which consists of only 163 BUS images and ground truths in PNG format. This repository was prepared in a diagnostic unit named UDIAT and then annotated by expert radiologists.
The BUSI repository [38] is also a publicly available ultrasound dataset that consists of three classes. The dataset consists of three classes, i.e., benign having 487 images, malignant having 210 images, and normal having 133 samples. In this experiment, we utilized the two classes for segmentation (malignant and benign), having relevant ground truth images.
b.Dataset Preparation for Experiments.
Due to variations in image sizes in images, all the datasets were resized to 256 × 256. Moreover, to smaller number of images in the dataset was augmented using various augmentation techniques. In the BUSI dataset, a few images contain 2 tumors in a single image, while having 2 ground truths in 2 separate images. So both ground truth images got concatenated to have a single ground truth image, as shown in Fig. 5.
Fig. 5 The alternative text for this image may have been generated using AI.
Processed Datasets (a) Tumor Image (b) Tumor GT 1 (c) Tumor GT 2 (d) Final GT
To evaluate the experiments, the dataset is partitioned into two subsections. 70% data is utilized for learning purposes, while the remaining 30% dataset is utilized for testing of the designed architecture.
c.Experimental Setup.
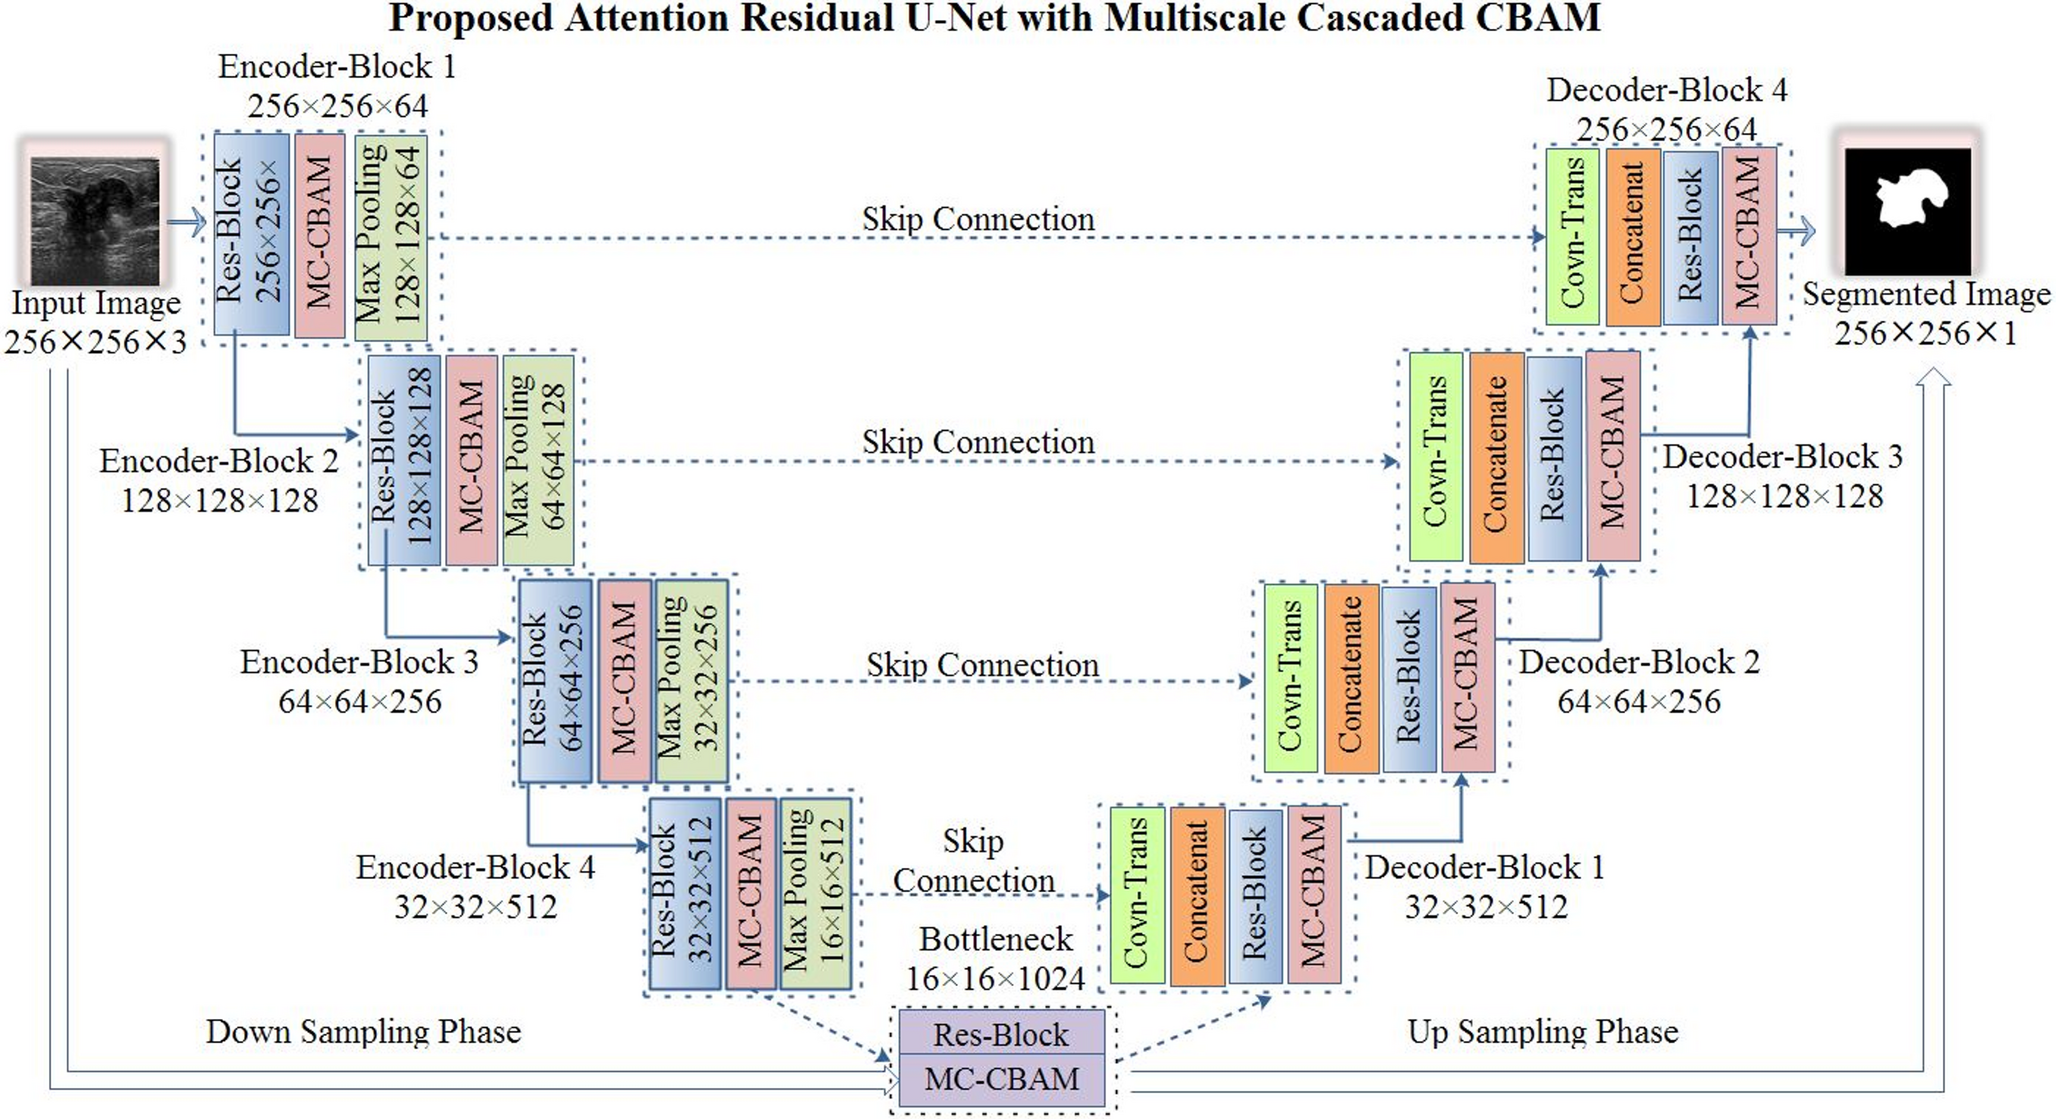
The designed architecture is a custom-designed architecture for the segmentation of BC. The architecture consists of a U-shaped encoder-decoder structure having the MC-CBAM integration, which improves the feature selection at both the channel and spatial levels. The experiments are carried out on a Kaggle GPU P100, 16GB VRAM. The model is built using the TensorFlow framework, having the optimizer called Adam and a training ratio of 1e-4. The framework was trained using the Adam optimizer, having an initial learning rate of 1e-4, which was determined empirically with the help of validation experiments. Several learning rates were tested, and 1e-4 provides the highest validation performance and stable convergence. The Adam optimizer is chosen for its skilled learning capacity with robustness for handling sparse gradients. The model was trained over 50 epochs with a batch size of 8 to balance the convergence stability and GPU limitations. To prevent overfitting and for better generalization, the configurations utilized the ReduceLROnPlateau callback, as it aims to observe the validation loss and also minimizes the learning rate by 0.2 when no improvements occur in five consecutive epochs. All the hyperparameters were empirically tuned using preliminary experiments to get the optimal Dice and IoU measures.
d.Evaluation Metrics.
To conduct the comparison between the design and existing techniques, the following evaluation measures are used:
Jaccard Coefficient, also called Intersection over Union (IoU), is given in Eq. 13.
$$\:Jaccard=\:\frac$$
(13)
Tversky loss [39] controls the balance between the FN and the FP with the help of weighted parameters α and β, as shown in Eq. 14; it is also a generalization of Dice loss.
$$\begin&\:}_=\\&1-\frac\\&,\:wheareas\:\:\text\text\:0.7\:\text\text\text\:\:\text\text\:0.3\end$$
(14)
The combined loss Function is utilized to improve the performance of segmentation; thus, the combined loss function integrates both Dice loss and Tversky loss as shown in Eq. 15.
$$\:}_=0.5\:\times\:\:}_+0.5\:\times\:\left(1-Dice\right)$$
(15)
The designed combined loss function takes advantage of both Dice and Tversky losses, as the Dice loss demonstrates the global area overlap between the GT and the PM, while the other one controls the trade-off between the FN and FP. Thus, this merger ensures robust learning while segmenting the irregular and small tumor regions.
e.Segmentation Results.
This subsection presents the outcomes of the segmentation method on the 3 datasets utilized. Table 2 depicts the results on both histopathology and ultrasound datasets.
Table 2 Segmentation results of proposed methodOn the TNBC dataset, the proposed U-Net model integrated with the Multi-Cascade CBAM (MC-CBAM) demonstrates effective results. The designed architecture obtained a high Dice of 80.54% and Jaccard of 67.43%. The outcomes shows that the proposed MC-CBAM module effectively captures both contextual and structural features, and produces better segmentation results. The illustration of the segmentation outcomes on the TNBC data samples is presented in Fig. 6.
Fig. 6 The alternative text for this image may have been generated using AI.
Segmentation results on tnbc dataset
Over the ultrasound datasets, the proposed framework provides the dice of 87.23% and Jaccard of 77.36% on the UDIAT, while on the BUSI, the designed model achieved the dice of 83.96% and Jaccard of 73. 25% respectively. The above statistics emphasize the effectiveness of the designed technique on the ultrasound dataset, as it can focus on both localized and comprehensive features. It helps to segment the irregular and fuzzy boundaries of the tumor region. The illustration of the segmentation outcomes on the UDIAT repository is presented in Fig. 7, and on the BUSI dataset is presented in Fig. 8.
Fig. 7 The alternative text for this image may have been generated using AI.
Segmentation outcomes on UDIAT dataset
The Figs. 6, 7, and 8 show the predicted outputs of the TNBC, UDIAT, and BUSI datasets. The predicted images are processed and colored. After that, the GTs were mapped on the Input samples to show the region of interest.
Fig. 8 The alternative text for this image may have been generated using AI.
Segmentation outcomes on BUSI dataset
f.Ablation Study.
In the ablation investigation, the impact of Multi-Cascade CBAM (MC-CBAM) block removal from the proposed U-Net framework is examined on both ultrasound and histopathology datasets. The removal of this block shows the notable degradation in the performance of segmentation across both modality datasets. The performance of Dice and Jaccard significantly reduces, which indicates that the attention mechanism placed in the MC-CBAM block is the most contributing element in the model’s capability, as it focuses on the various features that help to refine the small, fuzzy, and irregular borders in the tumor region. The impact and comparison of removing MC-CBAM are delivered in Table 3 on all datasets.
Table 3 Quantitative results of ablation experimentsTable 3 demonstrates the ablation study of different modules, as for the histopathology dataset, the absence of the MC-CBAM and residual connection shows the degraded segmentation interpretation with the Dice and Jaccard. For the ultrasound datasets, it is also shown that the performance declined for the UDIAT dataset as well as for the BUSI dataset. This highlights the significance of the MC-CBAM module with residual connection in the improvement of feature extraction, especially involving the small, irregular, and fuzzy borders. For the TNBC, UDIAT, and BUSI datasets, the integration of MC-CBAM and residual connection achieves the dice of 80.54%, 87.23% and 83.96% and the jaccard of 67.43%, 77.36% and 73.25% respectively. The visual presentation is depicted in Fig. 9.
Fig. 9 The alternative text for this image may have been generated using AI.
Visualization of Quantitative Results of Ablation Experiments
The graph demonstrates the visual representation of the results by showing the MC-CBAM block and after removing this block. The results clearly show that the removal of this block degrades the performance of the segmentation results.
g.Comparison with Existing Techniques.
To check the efficiency of the designed approach, the results are contrast with the existing techniques. The comparison results on the TNBC dataset are described in Table 4.
Table 4 Comparison of the designed method with existing approaches on the TNBC datasetThe researchers proposed a modular deep network having one branch called the semantic proposal architecture and another instance encoding framework that are trained in two phases. The proposed technique on the TNBC dataset provides a dice of 74.92% and a Jaccard of 58.54% respectively [40]. Another technique is proposed by the researchers for nuclei segmentation using histopathology samples. An encoder-decoder architecture is designed in which EfficientNet-B4 is utilized as a subnetwork; moreover, the post-processing is applied using morphological operations for enhancement. The model gives the aggregated Jaccard of 0.611 on the TNBC dataset [41]. The researchers designed a multilevel multi-objective PSO-guided superpixel algorithm that effectively recognizes and segments the ROI in the histopathology images. The method obtained a Jaccard of 49% and a Dice of 65% [42]. An encoder-decoder-based structure using an attention mechanism named ANet is proposed for segmentation and classification purposes. The method includes residual attention, convolutional block attention, dense attention, and preACT-ResNet50. On the TNBC dataset, the method obtained a dice of 75.30 and a Jaccard of 55.90 [43]. A federated learning approach is designed by the researchers called FedSODA, using dynamic stratified layer aggregation and synthetic driven cross assessment operation. The model achieved the dice of 78.43% on the TNBC dataset.
The comparison of the proposed approach with the above-mentioned techniques using UDIAT and BUSI datasets is provided in Tables 5 and 6, respectively.
Table 5 Comparison of the designed method with existing approaches on the UDIAT datasetTable 6 Comparison of the designed method with existing approaches on the BUSI datasetA network called cross-task aware is designed for the lesion pattern investigation. It is utilized to represent the efficient attributes through attention models; moreover, a feature merging approach is utilized to generate the attention-driven features. The network gained the dice of 82% and Jaccard of 74% on the UDIAT dataset, while 79% and 70% on the BUSI, respectively [46]. The researchers designed a composite attention module with a spatial self-attention module that captures significant features. Using the UDIAT dataset, the framework gained the dice and Jaccard of 78.14% and 69.10% while 77.51% and 68.82% on the BUSI dataset, respectively [47]. A network called ESTAN is designed for BT segmentation, which utilizes two encoders that extract the context details and fuse them at various scales along with clockwise kernels. The model gained a Jaccard of and a Dice of 74% and 82% respectively [51]. An enhanced selective kernel convolution integrated with multiple features, as well as with U-net having deep supervision, is proposed, which provides a dice of 79.92% and Jaccard of 71.65% for the UDIAT dataset and the BUSI dataset. The model provides the dice and Jaccard of 78.71% and 70.20% respectively [45]. A SE attention U-net is proposed by the researchers, whereas the SE considers a link between the encoder and the decoder, and the SE block suppresses the irrelevant details. The model gives the dice of 81.50% and Jaccard of 73.13% [52]. The researchers proposed an efficient Shifted Window Attention and a new Positional Convolutional block Attention Module, which integrates into the Residual U-Net framework. The model provides the dice of 78.58% and Jaccard of 64.71% [53]. The extension of the original CoAtNet is proposed by introducing the self-attention and dual stream of convolution by applying this at the first layer, so that the final layers get both the localized and comprehensive attributes map. The model gives the dice of 78.84% and the Jaccard of 69.25% respectively [54]. The swin transformerv2-UNet (S2UNet) is designed by the researchers depending on the swin transformerv2, whereas the S2UNet carries the framework of the down and upsampling overall. The model provides the dice and Jaccard of 73.26% and 58.30% on the BUSI dataset [48]. A new boundary-aware architecture called BCUIS-Net is designed, in which an edge-aware block is put forward, and a shape feature integration block is defined to fuse shape features. The model provides the dice of 81.59% and the Jaccard of 71.17% respectively, on the BUSI dataset [49]. A model called UMA-Net, which is an enhanced UNet architecture, is proposed and integrates with residual connections, a bottleneck with atrous convolutions, and attention mechanisms. Further, an adaptive ensemble loss function is introduced for enhancement. The model obtained the Dice of 81.80% and Jaccard of 69.20% on the UDIAT while on the BUSI repository, the architecture gives the dice and Jaccard of 81.80% and 69.20% respectively [50].
In addition to the model’s improvements, the computational performance of the designed model is carefully analyzed. As expected, due to the integration of multi-cascaded structure and residual connection, etc., the measures related to time, including training time, prediction time, and evaluation time etc., are slightly higher in contrast to the baseline architectures. Three baseline models are selected, including U-net [55], SegNet [56], and PSPNet [57]. However, this increase in the time-related measures is in an acceptable range, as significant performance is achieved. It is also noteworthy that in some cases, some measures like FPS, etc., are slightly lower compared to the baseline models. This reflects the maintained adjustment between the segmentation measure and the efficiency of the model. The outcomes are shown in Table 7, which provides a comprehensive comparison of all models on some selected test data samples.
Table 7 Quantitative runtime analysisFurther robustness of the proposed model is validated by a 95% Confidence Interval (CI) analysis for both Dice and IoU measures. Table 8 demonstrates that the proposed architecture gets the highest mean values among all models, which shows the reliability and stable performance of the proposed method.
Table 8 95% confidence intervals (CI) for dice and IoU metricsStatistical significance of the proposed method is also checked using p-value, t-test, significance, and Cohen’s d for both Dice and IoU measures. All comparisons yielded statistically significant (p < 0.05) results, which confirm the improvements; moreover, Cohen’s d shows the effect size to validate the effectiveness (Table 9).
Table 9 Statistical significance and effect sizeOverall, this section presents the experimental findings, which emphasize that the designed model outperforms baseline models. This section shows many statistical results and comparisons, which collectively show the capability, generalization, and effectiveness of the proposed method.
Comments (0)