
Remember me


To establish performance benchmarks for the CV-TR dataset, we conduct comparative analysis of contemporary vehicle Re-ID methodologies against the proposed DACVNet framework. The evaluation protocol employs mean Average Precision (mAP) and Cumulative Matching Characteristic (CMC) metrics for quantitative performance assessment in cross-view truck retrieval tasks. Experimental results demonstrate DACVNet’s superior capability in handling viewpoint variations and appearance ambiguities characteristic of heavy-duty vehicles.
Training DetailsThe preprocessing pipeline standardizes input dimensions to 256\(\times \)128 with comprehensive data augmentation strategies including stochastic region occlusion, horizontal axis inversion, photometric distortion variation, and adaptive spatial cropping. Optimization employs Adam with cosine-annealed learning rate decay schedule (initial \(\eta =3.5e-4\)), configured through 128-sample mini-batches containing 16 unique truck identities (8 instances per identity) to balance intra-class variation and inter-class discrimination.
The architectural foundation utilizes ResNet50 pre-trained via ImageNet classification as the feature extraction backbone within DACVNet. This initialization strategy leverages transfer learning advantages while maintaining domain adaptation capability through subsequent fine-tuning. The batch composition strategy specifically addresses truck Re-ID challenges by ensuring sufficient instance diversity within identity clusters, effectively reducing overfitting risks while preserving discriminative feature learning capacity.
Fig. 9 The alternative text for this image may have been generated using AI.
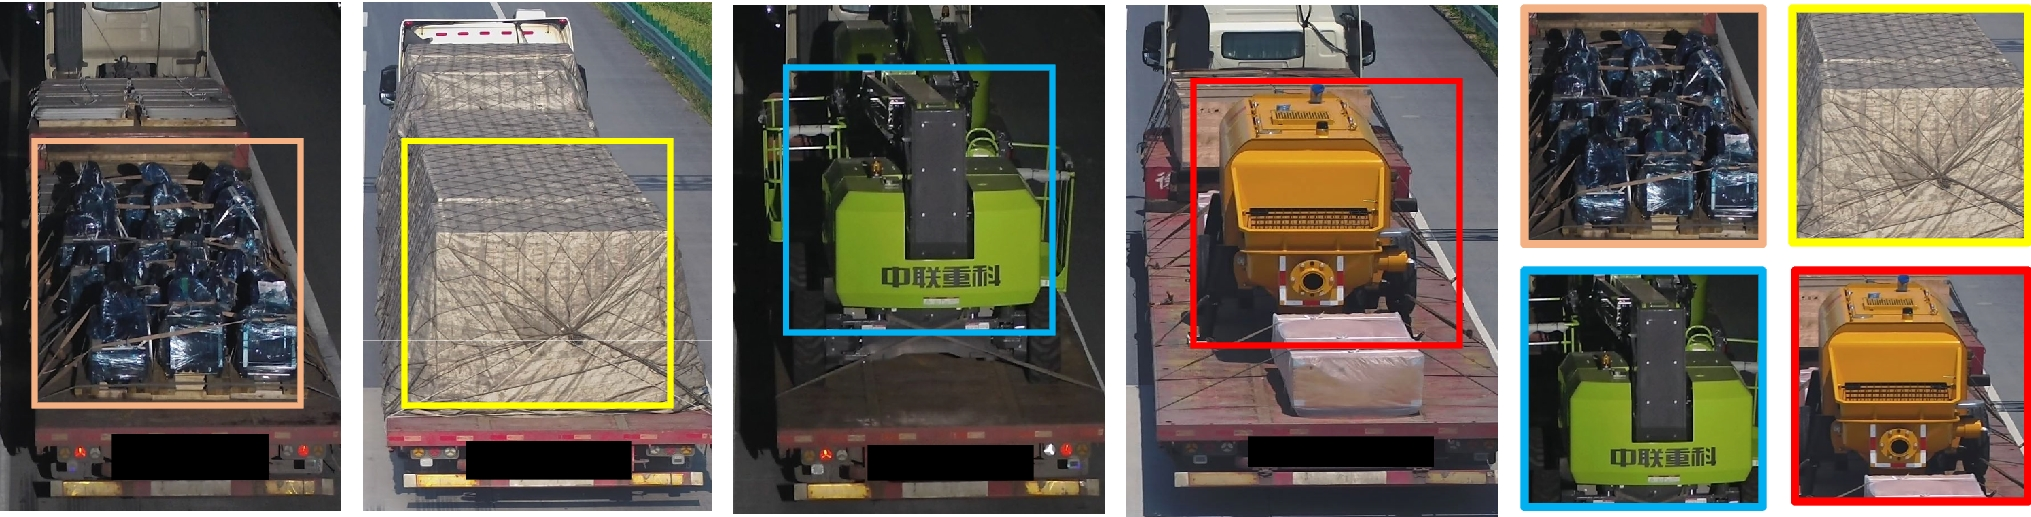
Illustrations of the query results of the same probe image by different methods. Top ten query images are selected to display, where the green frame images have the correct truck ID while the red frame images have the incorrect truck ID. The top line is the results of DGN [21], the second line is that of MSINet and the bottom line shows the results of our DACVNet
Qualitation EvaluationTo evaluate whether the proposed DACVNet can extract more discriminative deep feature for CV-TR Re-ID, especially under different traffic surveillance view, we pick one front-view truck image in \(q_0\) as probe.
Table 4 Comparative experiments of different methods on combination of \(q_0\) and \(g_0\) subset and combination of \(q_1\) and \(g_1\) of CV-TR dataset. The best and second best results are marked in red and blueTable 5 Comparative experiments of different methods on combination of \(q_2\) and \(g_2\) subset of CV-TR dataset. The best and second best results are marked in red and blueTable 6 Comparison with the state-of-the-art methods on the VeRi776 datasetFigure 9 compares cross-view retrieval performance between our method and baseline methods (DGN, MSINet) using front-view probe images. Experimental observations reveal two key patterns: (1) Incorrect matches exhibit high visual similarity to ground-truth targets, creating challenging discrimination scenarios; (2) Rear-view gallery samples consistently obtain lower rankings across all methods. In particular, DACVNet demonstrates superior matching concentration with correct results clustering in higher ranks (visualized by green box positions), particularly improving rear-view true matches to Rank-6 compared to MSINet (Rank-8) and DGN (Rank-10). These results confirm our DACVNet’s enhanced robustness in cross-perspective feature representation.
Quantitative EvaluationIn the field of Re-ID, there are more research works available on person Re-ID than on vehicle Re-ID. Since the tasks are similar, person Re-ID and vehicle Re-ID methods can also be applied to truck Re-ID. Thus we choose some representative state-of-the-art person Re-ID and vehicle Re-ID methods, AlignedReID++, RK, ISGAN, AGW, PVEN, SpCL, FPB, TransReID, MSINet, RTMem, CAN, AFC, SOFCT, CGMAL and RSFAN as the baseline methods for the collected CV-TR dataset.
Tables 4 and 5 show the performance of the proposed DACVNet comparing to these baseline methods on three-group subsets (\(q_0/g_0\), \(q_1/g_1\) and \(q_2/g_2\)) of CV-TR dataset. The results of mAP, Rank-1, Rank-5 and Rank-10 of DACVNet are all the best or second best on the three subsets.
On the \(q_0/g_0\) subset, DACVNet achieved the great performance, with an mAP of 55.8 and R1, R5, and R10 scores of 96.9, 98.8, and 99.3, respectively. Compared to the second-best method, FPB (mAP of 52.6, R1 of 96.2), DACVNet improved mAP by 3.2% and R1 by 0.7%. When compared to MSINet (mAP of 51.4, R1 of 96.3), DACVNet led by 4.4% in mAP and 0.6% in R1. Against TransReID (mAP of 49.4, R1 of 96.3), DACVNet significantly outperformed it by 6.4% in mAP and 0.6% in R1. Additionally, DACVNet surpassed AlignedReID++ (mAP of 41.4, R1 of 91.4) by 14.4% in mAP and 5.5% in R1. Compared to AGW (mAP of 49.8, R1 of 96.7), DACVNet led by 6.0% in mAP and 0.2% in R1. ISGAN (mAP of 47.4, R1 of 95.7) lagged behind DACVNet, with 8.4% lower mAP and 1.2% lower R1, further highlighting DACVNet’s performance for truck Re-ID on this subset.
On the \(q_1/g_1\) subset, DACVNet continued to lead, achieving an mAP of 53.1 and R1, R5, and R10 scores of 96.1, 98.6, and 98.3, respectively. DACVNet outperformed MSINet by 3.4% in mAP and 0.2% in R1. Compared to FPB (mAP of 50.6, R1 of 94.2), DACVNet improved mAP by 2.5% and R1 by 1.9%. Against TransReID (mAP of 47.3, R1 of 94.1), DACVNet led by 5.8% in mAP and 2.0% in R1. DACVNet also surpassed AlignedReID++ (mAP of 39.8, R1 of 90.1) by 13.3% in mAP and 6.0% in R1. Compared to AGW (mAP of 48.6, R1 of 94.1), DACVNet outperformed it by 4.5% in mAP and 2.0% in R1. ISGAN (mAP of 46.3, R1 of 93.6) was outperformed by DACVNet, with 6.8% lower mAP and 2.5% lower R1.
On the \(q_2/g_2\) subset, DACVNet continued to demonstrate outstanding performance, with an mAP of 34.2, R1 of 33.9, R5 of 41.8, and R10 of 48.1. In terms of mAP and R1, DACVNet ranked first, while the second-best method, RSFAN, achieved an mAP of 29.3 and R1 of 32.8. DACVNet led RSFAN by 4.9% in mAP and 1.1% in R1. In R5, DACVNet scored 41.8, outperforming RSFAN (41.3) by 0.5%. These results further confirm that, compared to existing person re-identification and vehicle Re-id methods, DACVNet is more effective on the CV-TR dataset, as these methods struggle to adapt to the specific challenges of truck Re-ID.
To address the concern regarding the generalization of DACVNet beyond the truck-specific domain, we conducted additional experiments on the widely-used general vehicle Re-ID benchmark, VeRi-776 [1]. As illustrated in Table 6, DACVNet achieves a superior performance with 84.7% mAP and 97.9% Rank-1 accuracy, consistently outperforming established state-of-the-art methods including TransReID [38] (82.0% mAP) and CAN [40] (83.4% mAP). These results demonstrate that the vehicle-centric design of DACVNet—specifically the feature purification and multi-head attention mechanisms—is not only effective for capturing unique truck configurations but also possesses robust discriminative power for general passenger vehicles. This cross-dataset validation confirms that our model effectively minimizes bias from specific collection settings and maintains high reliability across diverse vehicular taxonomies and environmental conditions.
To evaluate the practical deployment potential of DACVNet, we compare its inference efficiency with several representative state-of-the-art methods on a single NVIDIA RTX 3090 GPU. As summarized in Table 11, DACVNet achieves a competitive inference speed of 53.7 FPS. While the standard RK baseline [32] is faster (81.9 FPS) due to its simple structure, DACVNet significantly outperforms other complex models such as MSINet (40.3 FPS) and AlignedReID++ (46.7 FPS). Compared to the Transformer-based TransReID [38] (23.5 FPS), our method is more than twice as fast. Overall, DACVNet maintains a superior balance between recognition accuracy and computational speed, making it well-suited for real-time truck re-identification in large-scale surveillance scenarios.
Table 7 Ablation studies of DACVNet. GF denotes model adopts global feature learning. LF denotes model adopts model adopts local feature learning. GF + LF = FP module. The best results are marked in redTable 8 Ablation studies on various vertical image partitioning approaches. Unpartitioned means using only global feature learning. The best results are marked in redTable 9 The performance of different attention modules embedded in the DACVNet. The best results are marked in redTable 10 The performance of DACVNet under different loss weights (Cross Entropy Loss weight:Circle Loss weight) and DALW. The best results are marked in redTable 11 Comparison of inference efficiency on a single NVIDIA RTX 3090 GPUAblation StudyWe use the standard backbone ResNet50 along with Smoothing CE Loss and Circle Loss (Smoothing CE Loss : Circle Loss = 1 : 1) as a baseline. To reveal how each component contributes to the performance improvements, we conduct a comprehensive ablation study and implement different variants of the methods. As shown in Table 7, by incorporating the global feature learning (GF), the model’s performance significantly improves, with mAP increasing to 37.2% and R1 reaching 76.8%. This indicates that the inclusion of global features effectively enhances the model’s ability to capture overall information. Additionally, the configuration using local feature learning (LF) also shows performance improvements, achieving an mAP of 36.3% and R1 of 77.6%, suggesting that local feature learning positively impacts the model’s performance. In further experiments, the model combining both global feature learning (GF) and local feature learning (LF) (Base + GF + LF) achieves even better results, with mAP rising to 46.8% and R1 at 82.3%. This indicates that the combination of both feature learning methods can comprehensively enhance the model’s feature representation capability. Notably, the model with the addition of the Multi-Head Attention mechanism (Base + FP + Multiple Head) also shows significant improvement, with an mAP of 52.5% and R1 of 87.0%, confirming the importance of multi-head attention in feature fusion. Finally, by integrating all these components (Base + GF + LF + Multiple Head + DALW), the overall performance of the model reaches 55.8% mAP and 96.3% R1. This demonstrates that the comprehensive integration of global and local feature learning, along with the multi-head attention mechanism, significantly enhances the model’s effectiveness, providing valuable insights for future research.
We also performed ablation experiments on the partitioning approaches of the truck images, as shown in Table 8. The unpartitioned method, relying solely on global feature learning, achieves 49.5% mAP and 88.7% R1, indicating limited performance. In contrast, our bisection method shows significant improvement with 55.8% mAP and 91.7% R1, suggesting that dividing the image into two segments enhances local feature focus. The trisection approach yields 50.2% mAP and 90.1% R1, indicating that while it offers some benefits, it does not outperform bisection. The quadrisection method, with 48.1% mAP and 85.3% R1, shows the lowest performance, highlighting that excessive partitioning can hinder effective feature learning. Overall, the bisection approach is the most effective method for vertical image partitioning, as it successfully balances local and global feature learning.
A systematic evaluation of attention architectures (Table 9) demonstrates the superiority of our multi-head attention design through comprehensive ablation studies. The proposed module achieves state-of-the-art discriminative capability with 55.8% mean average precision and 96.9% Rank-1 accuracy, outperforming conventional attention mechanisms by significant margins. Comparative analysis reveals performance hierarchies: baseline configurations without attention mechanisms yield the lowest results (44.1% mAP), while CBAM and Non-Local modules exhibit intermediate improvements (53.1% and 54.6% mAP respectively). This performance validates our architecture’s effectiveness in simultaneously modeling spatial-channel correlations and multi-scale feature aggregation, particularly through its parallel attention head configuration that captures complementary visual patterns.
Finally, we performed ablation experiments with manual adjustment of loss parameters and DALW, as shown in Table 10. The DALW approach achieves the highest performance, with 55.8% mAP and 96.6% R1, indicating its effectiveness in balancing loss contributions. The 1:1 and 1:2 configurations show moderate results, while the 0.5:0.5 weight yields the lowest performance. This highlights the importance of selecting appropriate loss weights to optimize model effectiveness. We also showed the comparison of inference efficiency on a single NVIDIA RTX 3090 GPU in Table 11.
Comments (0)