
Remember me
We analyzed MEPS longitudinal data for the period of January 1, 2010, through December 31, 2019, focusing on cancer patients aged 18 to 64 years, as Medicaid expansion policies predominantly impacted this age group [6]. MEPS provides detailed measures of individual and family income derived from wages, salaries, and other income sources, and reports income relative to the Federal Poverty Level (FPL). MEPS utilized annual family income data to determine its relationship with the FPL. This data source was ideal for the current analyses because of its comprehensive longitudinal design and diverse and inclusive participant pool. MEPS is a nationally representative survey of the U.S. civilian noninstitutionalized population and includes detailed sociodemographic, utilization, and expenditure data [15].
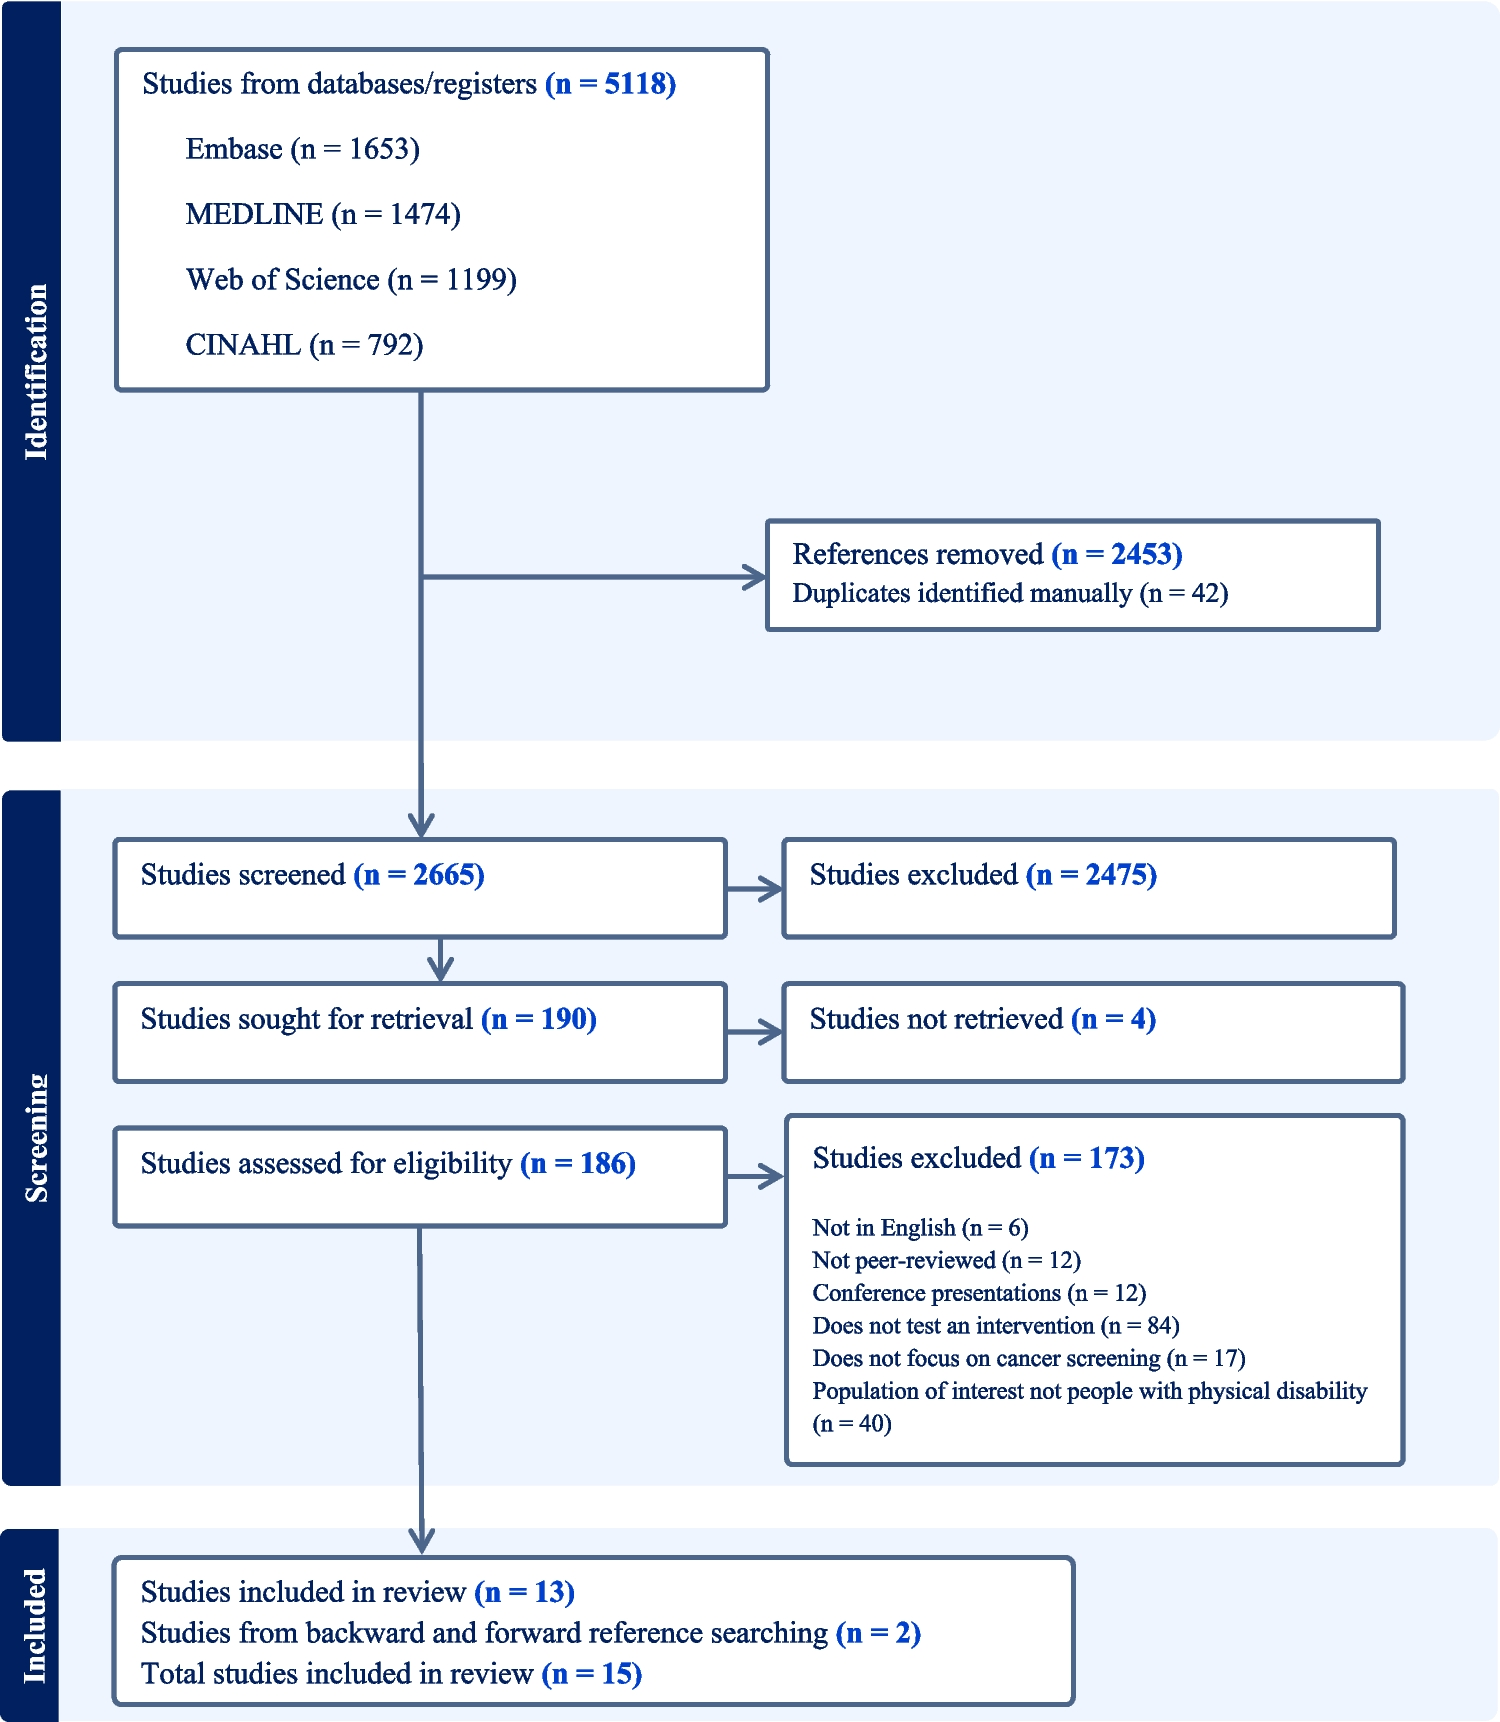
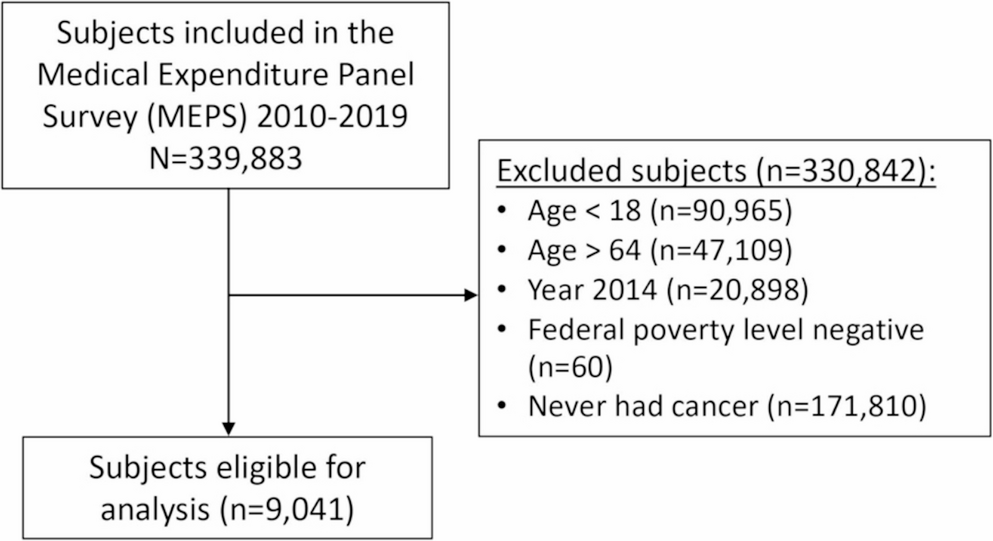
Study PopulationOur analysis included 9,041 U.S. adults aged 18 to 64 who had been diagnosed with cancer at some point in their lifetime. We specifically focused on the non-elderly population to explore the impact of the ACA expansion, enacted from January 1, 2014. We excluded 2014 to clearly separate pre-ACA and post-ACA periods and excluded observations with negative FPL income values (n = 60). A flow-chart is presented to illustrate how the final study population was determined (see Fig. 1).
Fig. 1
Flowchart illustrating determination of the final study population
Variables of Primary InterestThe study aimed to measure the difference in financial burden associated with cancer care between (2010–2013) (henceforth, ‘pre-ACA’) and (2015–2019) (henceforth, ‘post-ACA’). The financial burden was assessed in three ways: (1) OOP spending as a share of annual family income (model 1); (2) OOP spending as a share of total payments to healthcare providers (model 2); and (3) OOP spending overall (model 3). In addition, we also evaluated whether the ACA had any impact on total payments made to healthcare facilities (model 4) and on family income (model 5) to assess the changes in income and healthcare payments before and after ACA implementation. All statistical models were stratified across the FPL to explore whether differences in financial hardship differed among the income groups.
Study CovariatesA series of potential covariates were selected and incorporated based on the extant literature. Our analytical dataset included age, sex, race/ethnicity (non-Hispanic whites, non-Hispanic blacks, Hispanics, and non-Hispanic others), education, marital status (married, divorced, separated and never married), census region (northeast, midwest, south, west) and self-reported health status as good or better and poor or fair. Family income groups defined by FPL% and categorized into 4 groups: lowest income as 0-138% FPL; low income as 138–250% FPL; middle income as 250–400% FPL; and high income > 400% FPL.
Statistical AnalysisDescriptive statistics were first conducted to provide a comprehensive overview of sample characteristics. Chi-square test was then employed to explore the bivariate associations between pre and post ACA. We ran ordinary least squares regression models to estimate the changes in mean OOP expenditures and its share of family income, as well as total expenditure in pre- and post-ACA periods. Spending was adjusted for inflation using the year 2019 Consumer Price Index (CPI). Two variables (i.e., OOP relative to family income and OOP relative to total expenditure) were employed to assess the financial hardship the patients and their family members faced. All models were adjusted for age, sex, race/ethnicity, marital status, family income, census region, health status, and educational attainment.
Since Model (1) represents a fraction of OOP costs relative to family income, adjustments were made for all variables except family income to mitigate collinearity biases. Models (1) through (5), which include OOP/Family income, OOP/Total Payments made to healthcare facilities, total payments made to healthcare facilities, OOP costs, and family income, were stratified in groups by FPL subcategories. Regression results are reported as the percent change in mean annual U.S. dollars from pre-ACA to post-ACA, stratified by levels of FPL. Data analyses were performed using STATA 18.1 (StataCorp LLC) software program. P-values < 0.05 were considered as statistically significant. Given that the study made use of de-identified, publicly available, secondary data, it was exempt from additional review board approval.
Comments (0)