
Remember me
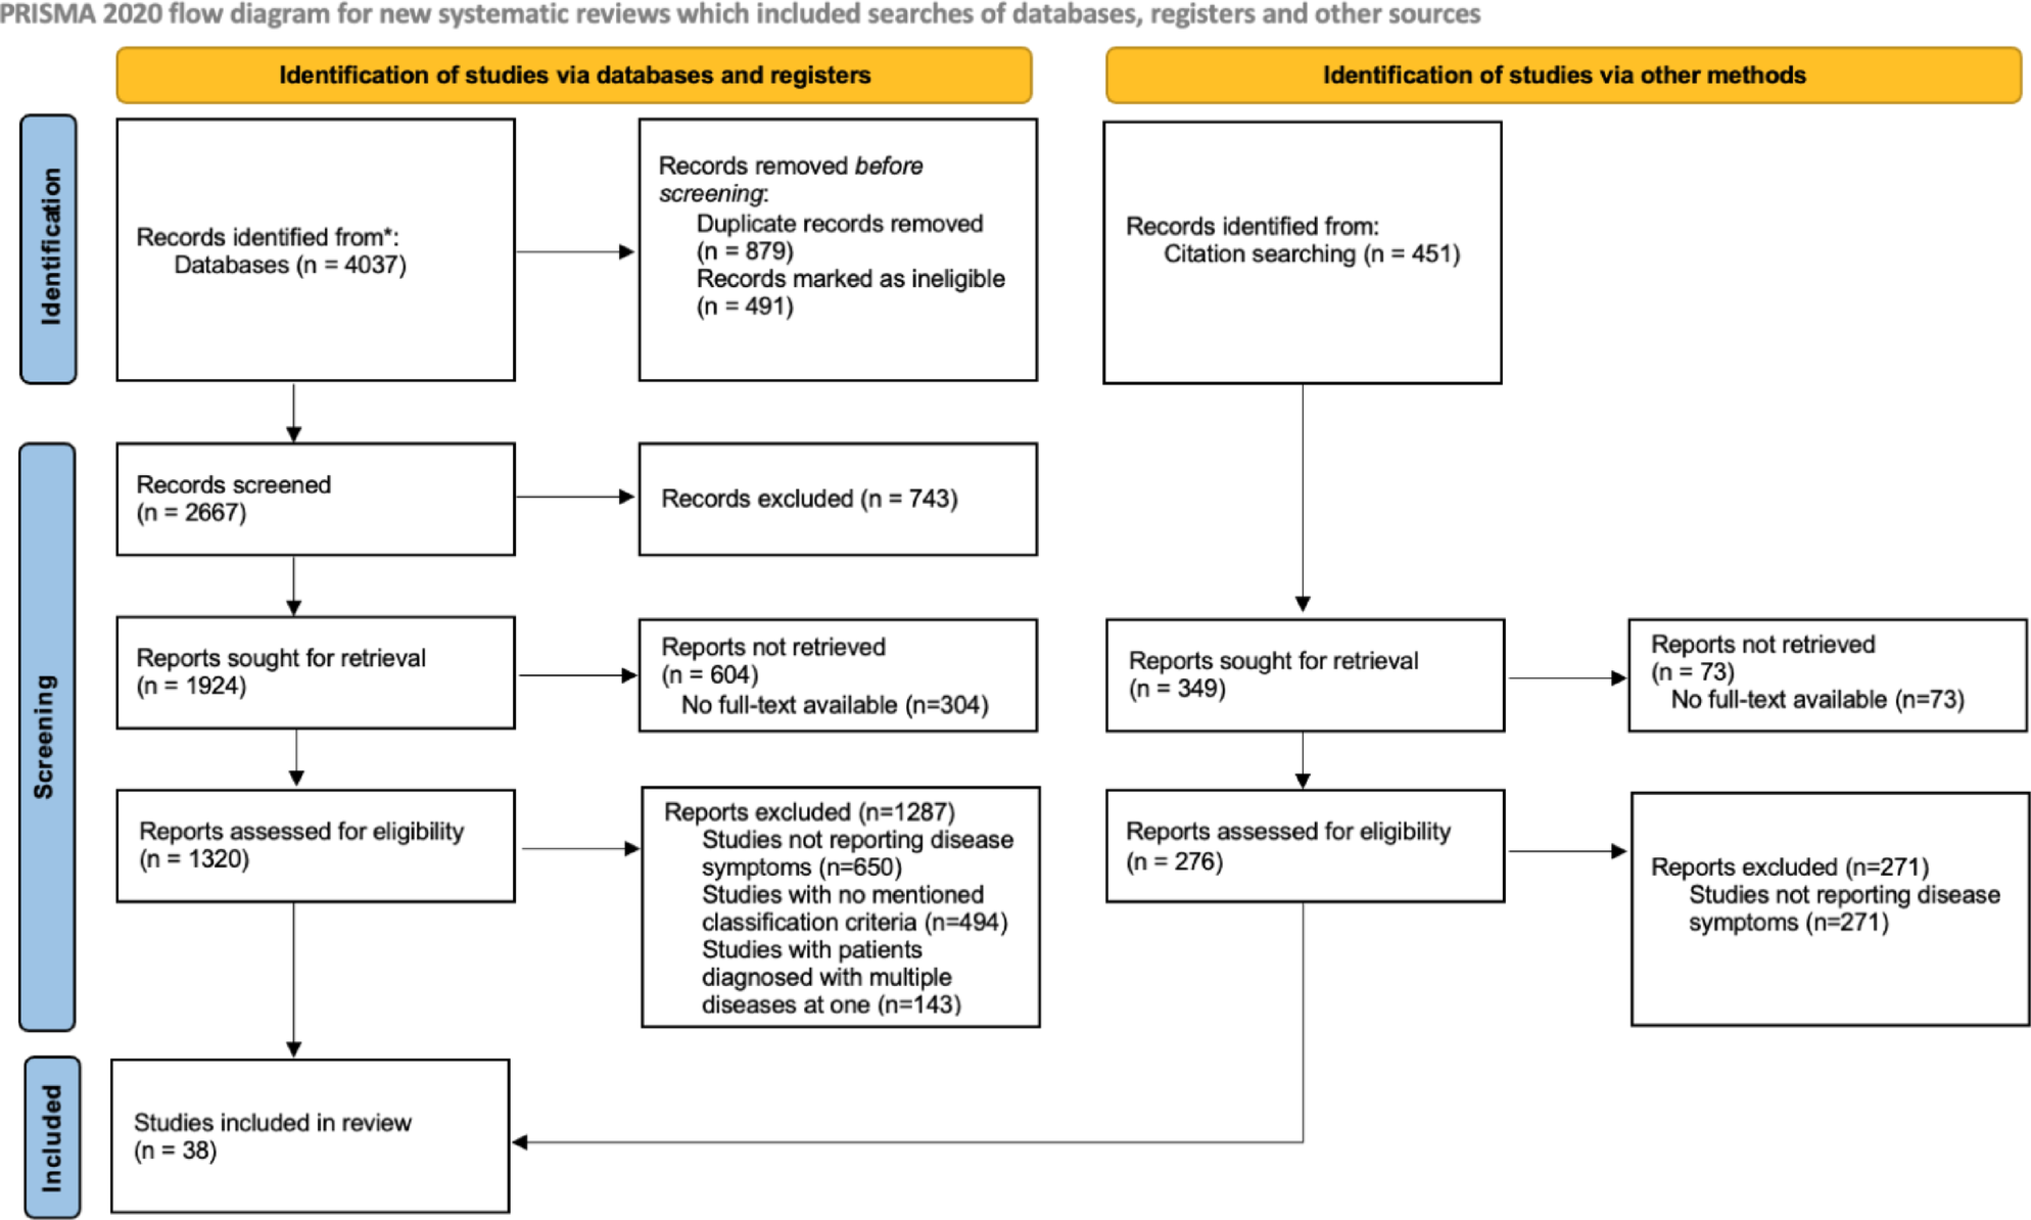
After the completion of our systematic search, 4488 studies were identified from databases and citation searching. Following the removal of duplicates and articles that were not retrieved, 1596 studies were assessed for eligibility. Finally, it was decided that 38 studies would be included in the systematic review (Fig. 1).
Fig. 1
PRISMA flow diagram for study selection process
Among the included studies, 68.05 patients was the mean sample per study. Furthermore, 27 studies included Adult-based patient groups, while 14 assessed pediatric patients. 3 studies included both adult and pediatric groups. 9 studies belonged to the American population, 16 to the European, 11 to the Asian, while 2 studies were internationally conducted with patients from many regions. The study characteristics are presented in Table 1.
Table 1 Characteristics of the assessed studies, including year of publication, total patients, study type, patient age group, and risk of bias assessmentConstitutional symptomsFeverThe pooled estimated prevalence of fever was calculated after it was corrected through the trim and fill method, according to the Peter’s test results. The prevalence was found to be 61.2% with 95% CI: 0.53; 0.68. According to the subgroup analysis, prevalence of this manifestation was 51.5% in adults with 95% CI: 0.44; 0.59, while in pediatric patients it was present in 82.0% with 95% CI: 0 0.68; 0.92. Thus, age group was a statistically significant moderator (p-value = 0.0003). For HBV related disease, the estimated prevalence was found to be 69.7% with 95% CI: 0.63; 0.75, while in non-HBV PAN it was reported in 56.4% with 95% CI: 0.49; 0.63. The result was statistically significant (p-value = 0.0089). Fever appeared to be more common in systemic PAN compared to the cutaneous type (60.1% vs. 44.7%) without, however, having a statistically significant difference. Regarding geographic area distribution, fever had a similar frequency in Europe, Asia and America (61.1% vs. 61.9% vs. 65.3%), without having a statistically significant difference.
As far as disease outcomes are concerned, fever was present in 51.5% of the total relapses with 95% CI: 0.16; 0.86. Detailed statistics are presented in Tables 2 and 3, while relapse percentages are visualized in Fig. 2.
Weight lossThe pooled estimated prevalence of weight loss was calculated at 47.7% with 95% CI: 0.38; 0.56. According to the subgroup analysis, prevalence of this manifestation was 51.3% in adults with 95% CI: 0.41; 0.61, while in pediatric patients it was present in 39.1% with 95% CI: 0.20; 0.59. However, age group was not a statistically significant moderator. For HBV related disease, the estimated prevalence was found to be 87.8% with 95% CI: 0.76; 0.96, while in non-HBV PAN it was reported in 45.4% of cases with 95% CI: 0.07; 0.86. However, the result was not statistically significant. Weight loss was observed to be more common in systemic PAN compared to the cutaneous type (49.1% vs. 23.0%) while also having a statistically significant difference. Regarding geographic area distribution, weight loss was observed more often in Europe and America compared to Asia (59.3% and 63.1% vs. 39.0%), while showing a statistically significant difference.
As far as disease outcomes are concerned, weight loss was present in 37.9% of the total relapses with 95% CI: 0.22; 0.54 Detailed statistics are presented in Tables 2 and 3, while relapse percentages are visualized in Fig. 2.
Results for subgroups (random effects model):
Musculoskeletal symptomsArthralgiaThe pooled prevalence of arthralgia was estimated at 49.2% with 95% CI: 0.39; 0.55. According to the subgroup analysis, prevalence of this manifestation was 39.3% in adults with 95% CI: 0.32; 0.45, while in pediatric patients it was present in 73.9% with 95% CI: 0.64; 0.82. Thus, age group was a statistically significant moderator (p-value < 0.0001). The available data did not allow us to do a subgroup analysis for HBV-related PAN. Arthralgia was observed to be more common in cutaneous PAN compared to the systemic type (37.8% vs. 40.9%) without, however, having a statistically significant difference. Regarding geographic area distribution, arthralgia was observed less commonly in America (43.0%) compared to the other two areas (49.6% for Europe and 50.4% for Asia%), without having a statistically significant difference.
As far as disease outcomes are concerned, arthralgia was present in 39.7% of the total relapses with 95% CI0.17; 0.64. Detailed statistics are presented in Tables 2 and 3, while relapse percentages are visualized in Fig. 2.
MyalgiaThe pooled estimated prevalence of myalgia was calculated at 54.3% with 95% CI: 0.47; 0.61. According to the subgroup analysis, prevalence of this manifestation was 53.2% in adults with 95% CI: 0.45; 0.60, while in pediatric patients it was present in 56.4% with 95% CI: 0.40; 0.71. However, age group was not a statistically significant moderator. For HBV related disease, the estimated prevalence was found to be 56.5% with 95% CI: 0.40; 0.72, while in non-HBV PAN it was present in 46.1% with 95% CI: 0.17; 0.76. However, the result was not statistically significant. Myalgia appeared to be more common in systemic PAN compared to the cutaneous type (57.4% vs. 29.3%) while also having a statistically significant difference. Regarding geographic area distribution, myalgia had a higher frequency in European populations (59.9%) and lower in American (44.5%), with Asian being in the middle (54.6%) without, however, having a statistically significant difference.
As far as disease outcomes are concerned, myalgia was present in 64.3% of the total relapses with 95% CI: 0.31; 0.91. Detailed statistics are presented in Tables 2 and 3, while relapse percentages are visualized in Fig. 2.
Cutaneous involvementThe pooled estimated prevalence of cutaneous involvement was calculated after it was corrected through the trim and fill method, according to the Peter’s test results. The prevalence was found to be 64.8% with 95% CI: 0.55; 0.73. According to the subgroup analysis, prevalence of this manifestation was 57.8% in adults with 95% CI: 0.47; 0.67, while in pediatric patients it was present in 77.5% with 95% CI: 0.59; 0.92. However, age group was not a statistically significant moderator. For HBV related disease, the estimated prevalence was found to be 31.5% with 95% CI: 0.25; 0.37, while in non-HBV PAN it was present in 60.6% with 95% CI: 0.43; 0.76. The result was statistically significant (p-value = 0.0029). As expected, cutaneous signs were far more common in cutaneous PAN, in comparison to the systemic type (100% vs. 54.6%), creating a highly statistically significant difference. Regarding geographic area distribution, cutaneous signs had a higher frequency in Asian populations (72.9%) and lower in European (54.2%), with American being in the middle (62.7%) without, however, having a statistically significant difference.
As far as disease outcomes are concerned, cutaneous involvement was present in 66.3% of the total relapses with 95% CI: 0.28; 0.96. Detailed statistics are presented in Tables 2 and 3, while relapse percentages are visualized in Fig. 2.
HypertensionThe corrected estimated pooled prevalence of hypertension based on trim and fill method was calculated at 30.6% with 95% CI: 0.23; 0.37. According to the subgroup analysis, prevalence of this manifestation was 34.5% in adults with 95% CI: 0.25; 0.43 while in pediatric patients it was present in 22.6% with 95% CI: 0.13; 0.33 Thus, age group was not a statistically significant moderator. For HBV related disease, prevalence was found to be 27.2% with 95% CI: 0 0.09; 0.49, while in non-HBV PAN it was present in 13.5% with 95% CI: 0.03; 0.28. However, the result was not statistically significant. Hypertension was observed to be more common in systemic PAN compared to the cutaneous type (34.8% vs. 5.6%) while also having a statistically significant difference. Regarding geographic area distribution, hypertension had a much lower frequency in Europe (21.3%) compared to Asia and America that had double that percentage and thus showing a statistically significant difference.
The available data did not allow us to calculate the relapses that hypertension was part of. Detailed statistics are presented in Tables 2 and 3.
Gastrointestinal involvementThe pooled estimated prevalence of gastrointestinal (GI) involvement was calculated at 37.6% with 95% CI: 0.31; 0.43. According to the subgroup analysis, prevalence of this manifestation was 36.5% in adults with 95% CI: 0.30; 0.43, while in pediatric patients it was present in 40.0% with 95% CI: 0.26; 0.54. However, age group was not a statistically significant moderator. For HBV related disease, the estimated prevalence was found to be 41.5% with 95% CI: 0.25; 0.58, while in non-HBV PAN it was present in 26.7% with 95% CI: 0.14; 0.40. However, the result was not statistically significant. No cases of gastrointestinal involvement were recorded for patients with cutaneous PAN. Regarding geographic area distribution, gastrointestinal symptoms were notably more common in America (57.1%) in comparison to Asia and Europe (~ 29–36%) without, however, having a statistically significant difference.
As far as disease outcomes are concerned, gastrointestinal involvement was estimated to be present in 9.8% of the total relapses with 95% CI: 0.00; 0.30. The case Fatality Rate (CFR) for such manifestation was calculated at 2.8% with 95% CI: 0.00; 0.08. Finally, gastrointestinal involvement accounted for 6.7% of Polyarteritis Nodosa deaths with 95% CI: 0.01; 0.18. Detailed statistics are presented in Tables 2 and 3, while CFR, relapse and mortality percentages are visualized in Figs. 2 and 3.
Cardiac involvementThe corrected estimated pooled prevalence of cardiac involvement based on trim and fill method was calculated at 14.5% with 95% CI: 0.09; 0.20. According to the subgroup analysis, prevalence of this manifestation was 13.5% in adults with 95% CI: 0.07; 0.20, while in pediatric patients it was present in 18.1% with 95% CI: 0.05; 0.35. However, age group was not a statistically significant moderator. For HBV related disease, the estimated prevalence was found to be 18.9% with 95% CI: 0.12; 0.26 while in non-HBV PAN it was present in 11.8% with 95% CI: 0.01; 0.27. However, the result was not statistically significant. No cases of cardiac involvement were recorded for patients with cutaneous PAN. Regarding geographic area distribution, cardiac involvement followed roughly the same pattern as gastrointestinal involvement, with America having the highest prevalence (47.5%), while Asia and Europe had almost 5 times smaller frequency (~ 5–15%).
As far as disease outcomes are concerned, cardiac involvement was present in 2.8% of the total relapses with 95% CI: 0.00; 0.16. The CFR for such manifestation was calculated at 7.4% with 95% CI 0.02; 0.13. Finally, cardiac involvement was estimated to account for 3.2% of total disease deaths with 95% CI: 0.00; 0.07. Detailed statistics are presented in Tables 2 and 3, while CFR, relapse and mortality percentages are visualized in Figs. 2 and 3.
Neurological symptomsCentral nervous system involvement (CNS)The pooled prevalence of CNS involvement was estimated at 12.7% with 95% CI: 0.09; 0.16. According to the subgroup analysis, prevalence of this manifestation was 11.8% in adults with 95% CI: 0.08; 0.15, while in pediatric patients it was present in 15.7% with 95% CI: 0.09; 0.23. However, age group was not a statistically significant moderator. For HBV related disease, the estimated prevalence was found to be 3.9% with 95% CI: 0.00; 0.09 while in non-HBV PAN it was present in 13.0% with 95% CI: 0.02; 0.28. However, the result was not statistically significant. No cases of CNS involvement were recorded for patients with cutaneous PAN. Regarding geographic area distribution, CNS involvement is more commonly reported in American patients (18.7%), while Asia had the lowest prevalence (7.1%). However, these findings did not show a statistically significant difference.
As far as disease outcomes are concerned, CNS involvement was present in 11.0% of the total relapses with 95% CI: 0.04; 0.19. The CFR for this manifestation was calculated at 4.3% with 95% CI: 0.00; 0.14. Finally, CNS involvement accounted for around 0.4% of disease deaths with 95% CI: 0.00; 0.03. Detailed statistics are presented in Tables 2 and 3, while CFR, relapse and mortality percentages are visualized in Figs. 2 and 3.
Peripheral neuropathyThe pooled estimated prevalence of peripheral neuropathy involvement was calculated at 41.6% with 95% CI: 0.31; 0.52. According to the subgroup analysis, prevalence of this manifestation was 51.3% in adults with 95% CI: 0.41; 0.61, while in pediatric patients it was present in 12.6% with 95% CI: 0.03; 0.24. Thus, age group was a statistically significant moderator (p-value < 0.0001). For HBV related disease, prevalence was found to be 73.8% with 95% CI: 0.22; 1.00 while in non-HBV PAN it was found to be present in 68.9% with 95% CI: 0.62; 0.74. However, the result was not statistically significant. Peripheral Neuropathy was found to be more common in systemic PAN compared to the cutaneous type (42.2% vs. 19.8%) without, however, having a statistically significant difference. Regarding geographic area distribution, peripheral neuropathy had a fairly similar frequency in Europe, Asia and America (42.2% vs. 48.8% vs. 40.0%), without having a statistically significant difference.
The available data did not allow us to calculate the relapses that peripheral neuropathy was part of. Detailed statistics are presented in Tables 2 and 3, while relapse percentages are visualized in Fig. 2.
Renal involvementThe pooled estimated prevalence of Renal involvement was calculated at 31.0% with 95% CI: 0.24; 0.38. According to the subgroup analysis, prevalence of this manifestation was 34.0% in adults with 95% CI: 0.26; 0.42, while in pediatric patients it was present in 25.0% with 95% CI: 0.12; 0.39. However, age group was not a statistically significant moderator. For HBV related disease, prevalence was estimated to be 52.2% with 95% CI: 0.31; 0.73 while in non-HBV PAN it was present in 32.9% with 95% CI: 0.09; 0.61. However, the result was not statistically significant. No cases of renal involvement were recorded for patients with cutaneous PAN. Regarding geographic area distribution, American individuals had the most renal manifestations (39.6%), while Asia had almost half of that prevalence at 21.4%, without having a statistically significant difference.
As far as disease outcomes are concerned, renal involvement was present in 4.5% of the total relapses with 95% CI: 0.00; 0.11. The CFR for this manifestation was calculated at 0.17% with 95% CI: 0.00; 0.02. Finally, renal involvement is accounted for 2.19% of disease deaths, with 95% CI: 0.00; 0.10. Detailed statistics are presented in Tables 2 and 3, while CFR, relapse and mortality percentages are visualized in Figs. 2 and 3.
Fig. 2
Analysis of clinical manifestations observed during disease relapse. The forest plot illustrates the contribution of specific clinical features to total relapse episodes
Fig. 3
Mortality analysis by clinical manifestation. (Left) Forest plot displaying the pooled Case Fatality Rate (CFR) for specific clinical presentations. This represents the risk of death among patients affected by each manifestation. (Right) The distribution of total reported deaths attributed to each clinical manifestation, illustrating the contribution of each phenotype to the overall mortality burden
MortalityThe pooled prevalence of overall mortality was estimated at 13.5% with 95% CI: 0.08; 0.19. According to the subgroup analysis, death prevalence was 18.7% in adults with 95% CI: 0.13; 0.24, while 3.2% of pediatric patients died with 95% CI: 0 0.00; 0.13. Age group was a statistically significant moderator (p-value = 0.0155). For HBV related disease, prevalence was found to be 31.9% with 95% CI: 0.25; 0.38 while in non-HBV PAN it was present in 11.7% with 95% CI: 0.02; 0.27. Notably, the result was statistically significant (p-value = 0.0139). No deaths were reported in patients with cutaneous PAN compared to individuals with the systemic type. Regarding geographic distribution, statistically significant differences were observed as America had the highest lethality at 23.2%, while Asia had the lowest at 4.6%.
The Pearson correlation analysis between disease duration and mortality number was calculated at 0.49 with 95% CI: -0.19;0.85. As far as duration of follow-up is concerned, the correlation was calculated at -0.01 with 95% CI: -0.52;0.50, with no statistically significant effect. Detailed statistics are presented in Tables 2 and 3.
RelapseThe pooled estimated prevalence of overall relapse was calculated at 28.2% with 95% CI: 0.20; 0.36. According to the subgroup analysis, relapse prevalence was 28.3% in adults with 95% CI: 0 0.18; 0.38, while 26.6% of pediatric patients relapsed with 95% CI: 0.14; 0.45. However, age group was not a statistically significant moderator. For HBV related disease, prevalence was found to be 6.3% with 95% CI: 0.03; 0.09 while in non-HBV PAN it was present in 19.1% with 95% CI: 0.09; 0.30. The result was statistically significant (p-value = 0.0336). Relapse was found to be more common in cutaneous PAN compared to the systemic type (34.1% vs. 26.0%) without, however, having a statistically significant difference. Geographic distribution analysis showed that America had the lowest rate of relapse at 11.9%, while on the contrary, Europe and Asia had more than double that percentage (30.3% and 25.2%). These differences were not, however, statistically significant.
The Pearson correlation analysis between disease duration and relapse number was calculated at 0.62 with 95% CI: -0.25;0.93. This result was not statistically significant. As far as duration of follow-up is concerned, the correlation was calculated at 0.16 with 95% CI: -0.42;0.65, with no statistically significant effect. Detailed statistics are presented in Tables 2 and 3.
RemissionThe pooled estimated prevalence of overall remission was calculated at 65.1% with 95% CI: 0.51; 0.77. According to the subgroup analysis, remission prevalence was 67.9% in adults with 95% CI: 0.51; 0.82, while 60.0% of pediatric patients achieved remission with 95% CI: 0.34; 0.83. However, age group was not a statistically significant moderator. For HBV related disease, prevalence was found to be 65.0% with 95% CI: 0.55; 0.74 while in non-HBV PAN it was present in 71.2% with 95% CI: 0.30; 0.98. The result was not statistically significant. Detailed Results can be found in Supplementary File 1. Remission occurred more often in systemic PAN compared to the cutaneous type (65.2% vs. 58.3%) without, however, having a statistically significant difference. The geographic analysis followed the same pattern as the relapse findings, with America having significantly lower remission at 20.3%, while Europe and Asia demonstrated almost quadruple that rate (77.7% and 83.4%).
Correlation analysis for disease duration was calculated at -0.04 with 95% CI: -0.89;0.87 and a non-significant p-value. For follow-up duration the result was 0.17 with 95% CI: 0.47;0.70. Detailed statistics are presented in Tables 2 and 3.
The detailed results of the HBV, systemic/cutaneous, and geographic area subgroup analyses can be found in Supplementary File 1.
Table 2 Prevalence results for each disease manifestation, as well as subgroup comparisons between adult and pediatric patients. Asterisks signify statistical significance. Table 3 Clinical severity and relapse burden by manifestationSensitivity analysisA leave-one-out sensitivity analysis showed that no individual study unduly influenced the pooled prevalence estimates for any type. All manifestation pooled estimates were inside the expected ranges, while heterogeneity remained roughly constant throughout the analysis. Precisely, fever prevalence varied between 50.4 and 53.6%, while maintaining high heterogeneity (I2≅ = 90%). For weight loss, it varied between 46.1 and 50.1 with steady heterogeneity (I2≅93%). For myalgia 52.8–55.4% with I2≅84%. For Cutaneous involvement it was between 54.3 and 58.0% with I2≅92%. For arthralgia it was between 44.5 and 48.3% with I2≅79%. For hypertension between 17.5 and 21.7% with I2≅92%. For gastrointestinal involvement, it was between 32.8 and 36.9% with I2≅60%. For cardiac involvement, 9.3–14.8% with I2≅85%. For peripheral neuropathy, 39.6–44.7% with I2≅96%. For renal involvement, 27.3–34.9% with I2≅59%.
Risk of bias assessmentEach study that was included in this analysis, was assessed according to the Quality in Prognostic Studies (QUIPS) Tool. The detailed bias assessment of the methodological quality of the studies is presented in Supplementary File 2. Additionally, Peter’s test for funnel plot asymmetry showed some evidence for fever, hypertension, cardiac involvement, and cutaneous signs. The prevalences were corrected using the trim and fill method [Supplementary File 3]. Finally, a subgroup analysis based on the different levels of risk of bias was conducted for each manifestation. All of the results came out as nonsignificant, highlighting the robustness of the results [Supplementary File 4].
Comments (0)