
Remember me
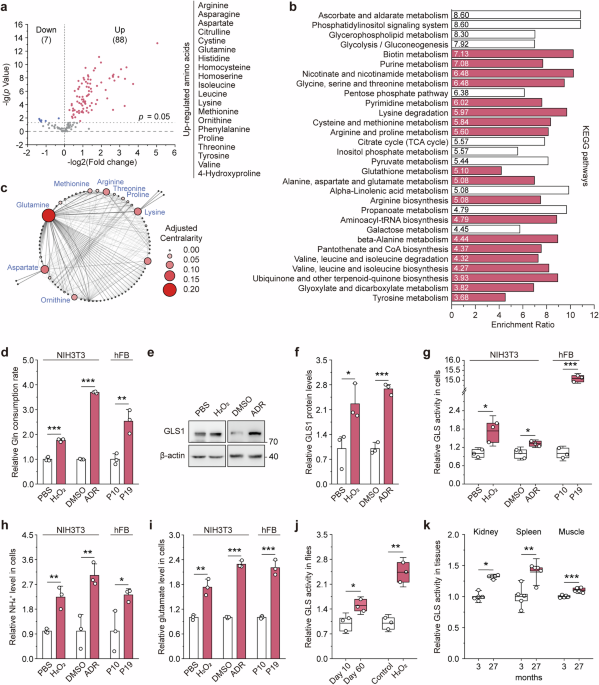
Adriamycin HCl (ADR, S1208), Bafilomycin A1 (BafA1, S1413) were purchased from Selleck (Houston, USA); ammonium chloride (NH4Cl) and hydrogen peroxide (H2O2) were purchased from CHRON Chemical (Chengdu, China); 6-Diazo-5-oxo-L-nor-leucine (DON, HY-108357) was purchased from MedChemExpress (NJ, USA); CB-839 (Telaglenastat, T6797) was purchased from TargetMol (Massachusetts, USA); L-glutamine (Gln, G8540) was purchased from Merck (Darmstadt, Germany); sodium glutamate hydrate (glutamate, Glu, A602012), L-aspartic acid sodium salt monohydrate (aspartate, Asp, A601178), L-citrulline (Cit, A604057) and L-arginine (Arg, A600205) were purchased from Sangon Biotech (Shanghai, China). All HPLC-grade reagents used in the LC-MS/MS assays were purchased from Merck (Darmstadt, Germany). Antibodies against p16 (P21212) were purchased from ProMab Biotechnologies, Inc (Hunan, China); antibodies against p62 (ab109012) were purchased from Abcam (Cambridge, UK); antibodies against GLS1 (A5125) and 4EBP1 (A5090) were purchased from Selleck (Houston, USA) were purchased from Absin (Shanghai, China); antibodies against phosphorylated (P)-p70/S6K (9205S) were purchased from CST (Massachusetts, USA); antibodies against p70/S6K (A4898) and P-4EBP1 (AP0030) were purchased from ABclonal Technology (Hubei, China); antibody against mTOR (R1510-21) was purchased from Huabio (Zhejiang, China); antibody against LAMP2 (MA1-165) was purchased from Thermo Fisher Scientific (Massachusetts, USA); antibodies against β-actin (bs-10966R) were purchased from Bioss (Beijing, China); goat anti-rabbit IgG (H&L) (HRP conjugate) (701051) was purchased from Zenbio (Chengdu, China); and goat anti-rabbit IgG (H + L) Highly Cross-Adsorbed Secondary Antibody, Alexa FluorTM Plus 488 (A32731) and goat anti-rat IgG (H + L) Highly Cross-Adsorbed Secondary Antibody, Alexa FluorTM Plus 594 (A48264) were purchased from Thermo Fisher Scientific (Massachusetts, USA). High-glucose Dulbecco’s Modified Eagle Medium (DMEM, 12100046, Gibco) was purchased from Thermo Fisher Scientific (Massachusetts, USA) and glutamine-free high-glucose DMEM (SH30081.02) was purchased from Cytiva (Delaware, USA). siRNAs were purchased from GenePharma (Shanghai, China).
Cell culture and cellular senescence modelNIH3T3 cells (murine fibroblast line), and HEK293T (human embryonic kidney) cells were purchased from the Shanghai Institutes for Biological Sciences of the Chinese Academy of Sciences (Shanghai, China). Primary human fibroblasts (hFBs) were a gift from Lv, Liang Ph. D. All cell lines were maintained in high-glucose Dulbecco’s Modified Eagle Medium (DMEM; 12100046; Gibco) supplemented with 10% fetal bovine serum (FBS; ST30-3302; PAN Biotech, Bavaria, Germany), at 37 °C in a humidified 5% CO₂ incubator. Cells were routinely passaged at ~80% confluence using 0.25% trypsin (Merck) with 0.02% EDTA.
For H2O2 stress-induced premature senescence (SIPS) models, 60% confluent NIH3T3 cells cultured in plates or dishes were exposed to 400 µM (for NIH3T3) or 200 µM (for ptfLC3 plasmid-transfected NIH3T3) H₂O₂H2O2 in PBS at 37 °C for 60 min. Treatment was terminated by replacing H2O2 containing PBS with complete DMEM (10% FBS, 4 mM glutamine). Glutamine restriction treatment was applied after H2O2 treatment terminated (see “Glutaminolysis restriction” section). Cells were then maintained for 3 days before downstream assays. For ADR-induced SIPS, 30% confluent NIH3T3 cells were exposed to 1 µM ADR in complete DMEM for 3 days. Following ADR removal, cells were maintained in ADR-free medium for an additional 4 days before downstream assays. Glutamine restriction treatment was applied simultaneously with ADR treatment where indicated. For the replicative senescence model, primary hFBs were seeded at 40% confluence in 10 cm dishes and serially passaged upon reaching 80% confluence, and the medium was refreshed every other day. Cells at passage 10 were designated “proliferative control”, whereas cells at passage 19 were considered “replicative senescent”. Glutamine restriction treatment was applied during the 18th to 19th passages where indicated.
Glutaminolysis restrictionTo interrogate the role of glutaminolysis in senescence and related signaling pathways, three complementary approaches were employed to restrict glutaminolysis in cells. 1) Low-glutamine medium cultivation. After H2O2 treatment or simultaneously with ADR addition, cells were maintained in glutamine-free DMEM supplemented with 10% FBS. 2) Pharmacological Inhibition: 6-Diazo-5-oxo-l-norleucine (DON) or CB-839 (telaglenastat) was added at 10 µM after H2O2 treatment or simultaneously with ADR addition. 3) Genetic Knockdown: Gls1-targeting siRNA was transfected 24 h prior to senescence induction. The duration of glutaminolysis restriction was 3 days for H2O2-SIPS and 7 days for ADR-SIPS. In replicative senescence, low-glutamine culture or 10 µM DON treatment was applied during the 18th to 19th passages (3 days).
To investigate the contribution of glutaminolysis to the downstream metabolic pathways, H2O2-induced senescent and proliferative NIH3T3 cells in 10 cm dishes were pre-equilibrated in fresh medium 12 hours prior to CB-839 (1 µM) or vehicle addition. Medium (with CB-839 or vehicle) was refreshed at 12 hours after treatment initiation, and cells were harvested at 36 hours after treatment initiation for metabolomic profiling (see “Cellular metabolomics analysis”).
Cellular metabolomics analysisCellular metabolomic profiling was conducted via an LC-MS/MS platform. Adherent cells grown in 10 cm dishes were rapidly chilled on ice to quench metabolism. After aspirating culture medium, each dish was washed with 5 mL ice-cold phosphate-buffered saline (PBS, pH 7.4) for 5 min on ice to remove extracellular metabolites. PBS was discarded, and cells were scraped into 200 µL ice-cold PBS; this wash was repeated once. Cell suspensions were centrifuged at 800 rpm for 5 min at 4 °C, and supernatants were discarded. Pelleted cells were extracted by adding 1 mL pre-chilled (-80 °C) 80% MeOH spiked with two internal standards (13C2-succinic acid and 13C5-15N-L-glutamic acid), then incubating at -80 °C for 30 min to achieve metabolic quenching. Samples were homogenized by ultrasonication at 4 °C, and then centrifuged at 13300 rpm for 15 min at 4 °C. A total of 800 µL supernatant was collected and dried under vacuum at 30 °C for approximately 3 h. The pellets were reconstituted in 1 mL of 10 mM ammonium acetate in 40% water/ 60% ACN + 0.2% acetic acid containing three internal standards (D4-glutaric acid, 13C5-15N-L-tyrosine and 13C1-L-lactate), sonicated at 4 °C for 15 min, and centrifuged at 13300 rpm for 15 min at 4 °C. Aliquots of 100 µL supernatant were transferred to LC-MS vials; 20 µL from each sample was pooled to generate a quality-control (QC) mixture. Metabolite separation was performed on a SHIMADZU LC-30AD coupled to a triple-quadrupole MS/MS. Chromatography was performed using a Waters BEH Amide column (2.1 × 100 mm, 1.7 µm) at 40 °C. Mobile phase A was 1 mM ammonium acetate with 0.02% acetic acid in water, and mobile phase B was 9 mM ammonium acetate with 0.18% acetic acid in water. The flow rate was 0.3 mL/min, and the gradient was from 10% A during the first 1.5 min and 55% A during the 5 to 10 min, followed by 10% A during the 12 to 25 min. Electrospray ionization (ESI) mode was used to detect positive and negative ions. The capillary voltage was ±4 kV, the ion source temperature was 650 °C, and the multistage reaction detection (MRM) mode was used to determine the metabolites and internal standards. Raw data were processed in MultiQuant to integrate peak areas. Statistical analysis and pathway enrichment were carried out in MetaboAnalyst 5.0, applying two-tailed Student’s t-test (p < 0.05) for differentially abundant metabolite screening and KEGG pathway mapping. Metabolite interaction networks were constructed and visualized in Cytoscape 3.9.1. Adjusted betweenness centrality (Cen_adj) was calculated as:
$$}_(\text)}=}_(\text)}\times _}(})$$
where CenBtw(x) is the betweenness centrality of metabolite x, and FoldChange(x) is its abundance ratio between experimental and control groups.
For investigation of the contribution of glutaminolysis to the downstream metabolic pathways. Metabolite change (“ΔAA”) was calculated as:
$$}_)}=}_-839(\text)}-}}_(\text)}$$
where x denotes either proliferating (Pro) or senescent (Sen) cells.
Amino acid quantificationTo quantify extracellular amino acid abundance, cells were seeded in 6-well plates, and after the establishment of the cellular senescence model, the medium was refreshed with 2 mL of DMEM supplemented with 4 mM glutamine and 10% FBS per well. Fresh medium added to a 6-well plate with no seeded cells (n = 3) served as blank. After 24 h incubation at 37 °C in a humidified 5% CO₂ incubator, culture medium was collected on ice, pooled per condition, and vortex-mixed. For sample preparation, aliquots of 300 µL medium were deproteinized by adding 900 µL ice-cold methanol, vortexing for 5 sec, and centrifuging at 13300 rpm for 20 min at 4 °C. Supernatants were transferred to LC-MS vials for single amino acid quantification as below, in order to calculate the glutamine consumption rate. The cells were collected for protein quantification using the bicinchoninic acid (BCA) method.
For single intracellular amino acid quantification, cells were collected as described in the “Cellular metabolomics analysis” section, and cell pellet was re-suspended in 500 µL of 80% methanol, sonicated on ice, then centrifuged at 13300 rpm for 20 min at 4 °C. The supernatant was collected and stored at −80 °C for further LC-MS/MS analysis, and the sediment was used for protein quantification. via the BCA assay. Amino acids were separated on an AB Sciex QTRAP 6500 + LC-MS/MS using an ACQUITY UPLC® BEH-C18 column (2.1 × 100 mm, 1.7 µm) at 35 °C. Mobile phase A was 0.1% formic acid in water; B was acetonitrile. The gradient proceeded from 90% A to 10% A over 2 min, held for 3 min, then re-equilibrated; flow rate was 0.4 ml/min. ESI positive mode used a 5.5 kV capillary voltage, 500 °C source temperature, and 60 V declustering potential. MRM was used to determine the amino acids and internal standard 15N-glutamate. The corresponding monitoring ion pair and collision energy are shown as follows.: Glutamine: parent ion, m/z 147.1; daughter ion, m/z 84.0; dwell time, 0.1 sec; collision energy, 12 eV; arginine: parent ion, m/z 175.1; daughter ion, m/z 116.0; dwell time, 0.1 sec; collision energy, 15 eV; glutamate: parent ion, m/z 148.1; daughter ion, m/z 84.1; dwell time, 0.1 sec; collision energy, 13 eV; internal standard: parent ion, m/z 149.1; daughter ion, m/z 85.0; dwell time, 0.1 sec; collision energy, 13 eV.
To evaluate the impact of Ass1 and Asl knockdown on intracellular arginine level, cells transfected with siAss1, siAsl or siNC were subjected to a 24-hour treatment by Hank’s buffer supplied with 4 mM glutamine and 0.4 mM arginine before LC-MS/MS assay, to avoid the interference from other amino acids. After then cells were collected and processed as described above.
The glutamine consumption rate was calculated using the following formulations.
$$}_(\text)}=\frac}_}-}_(\text)}\right)}}_(\text)}}$$
$$}_(\text)}=\frac}_(\text)}}}}_(\text)}}$$
Rcell(x): The absolute residual glutamine abundance of medium x. Rblank: The absolute residual glutamine abundance of the blank medium sample. CONprt(x): The cellular protein concentration of cell x. Cnorm(x): Normalized glutamine consumption rate of x. Crel(x): The relative glutamine consumption rate of x. \(\bar}\)norm(control): The average value of the normalized consumption rate of the control.
The intracellular amino acid level was calculated as follows.
$$}_(\text)}=\frac}_\right)}}}_(\text)}}$$
$$}_\left(\text\right)}=\frac}_(\text)}}}}_(\text)}}$$
AAnorm(x): The normalized intracellular level of certain amino acids in x. AA(x): The raw result from LC-MS/MS testing of certain amino acids in x. CONprt(x): Protein concentration of x. AArel(x): The relative level of certain amino acids in x. \(}}_(\text)}\): The average value of the normalized level of certain amino acids in controls.
Glutaminase enzymatic activity assayGlutaminase activity was measured using a glutaminase (GLS) test kit (A124-1-1; Nanjing Jiancheng Bioengineering Institute, Jiangsu, China). In brief, for cells, samples were collected in the same way as described in the “Cellular metabolomics analysis” section, and 500 μl of “Solution I” was added to each sample, which was subsequently homogenized by ultrasonication; for flies, about 15 flies were collected from each group in a 1.5 mL EP tube, and 500 μl of “Solution I” was added to each sample, which was subsequently homogenized by a tissue homogenizer. After a 10-minute centrifugation at 8 × 10³ g at 4 °C, the supernatant was collected for further measurement. Then, all the samples were tested, and the results were calculated following the manufacturer’s instructions. The results were normalized to the protein concentration.
Ammonium measurementThe intracellular ammonium concentration was measured using an enzymatic assay kit (AA0100-1KT; Merck, Darmstadt, Germany). In brief, cells were collected in the same way as described in the “Metabolomics” section, and 300 μl of ddH2O was added to each sample, which was subsequently homogenized by ultrasonication. The samples were centrifuged, and the supernatant was collected and deproteinized using trichloroacetic acid at a final concentration of 20%. Then, these samples were further centrifuged, the supernatant was collected, and the pH was adjusted to approximately 7 ~ 9. After that, 100 μl of each sample was used for the ammonium assay, and 1 ml of Ammonium Assay Reagent for each sample was added, followed by a 5 min incubation at room temperature, after which the absorbance at 340 nm was measured. Then, 10 μl of L-glutamate dehydrogenase was added to each sample, followed by another 5 min of incubation at room temperature, after which the absorbance at 340 nm was measured. The results were calculated following the manufacturer’s instructions and normalized to the protein concentration.
High metabolite cultivationTo assess the effects of elevated extracellular metabolites, complete DMEM (5% FBS) was supplemented with 20 mM of each indicated metabolite as following: glutamine, glutamate plus NH₄Cl (equimolar), L-aspartate plus L-citrulline (equimolar), L-arginine. The medium was replaced with a normal medium every 2 days, to avoid serious cell death, and the metabolites were re-added another 2 days later. This medium switch cycle was repeated until the end of the experiment, and cells were passaged when necessary. All treatments lasted 20 days.
Cellular Immunofluorescence assayCells were fixed in 4% paraformaldehyde for 15 min at room temperature, washed thoroughly in PBS, and permeabilized with 0.1% Triton X-100 for 12 min. After three PBS washes, samples were blocked in 3% BSA for 1 h and incubated overnight at 4 °C with primary antibodies diluted in 3% BSA. The following day, coverslips were washed and probed with fluorescently labeled secondary antibodies in 3% BSA for 1 h at room temperature, and then counterstained with 1 µg/mL DAPI for 15 min. Slides were mounted and imaged on a Zeiss LSM 870 confocal microscope using a 63 × oil-immersion objective (image field 214.36 × 214.36 µm at 9.5542 pixels/µm). Colocalization of mTOR with LAMP2 was quantified in Fiji (ImageJ2) by calculating the percentage of mTOR (magenta) puncta overlapping LAMP2 (green) signal, and overlapping puncta are shown in white; at least five fields and about 50 cells per condition were analyzed.
LC3-RFP-GFP assayNIH3T3 cells stably expressing the LC3-RFP-GFP tandem protein were constructed and preserved in our laboratory.65 After being subjected to the indicated treatments, images were obtained using a Zeiss LSM 870 fluorescence confocal microscope. For each sight, no less than 50 cells were counted and at least 150 cells for each group were counted in total, and the results of 3 sights were used to calculate the percentage of red (RFP + /GFP-) cells for each group.
siRNA and plasmid transfectionFor siRNA transfection, cells were transiently transfected with target-specific siRNA oligonucleotides (GenePharma) using the JetPRIME® transfection reagent (Polyplus, Bas-Rhin, France) in accordance with the manufacturer’s protocol, and downstream assays were performed 48 h post-transfection.
Lentiviral particles were generated by co-transfecting HEK293T cells with our gene-of-interest plasmid (pTRIPZ–Mm-Castor1 for Castor1 overexpression or empty pTRIPZ vector) together with the packaging plasmids psPAX2 and pMD2.G using the PEIpro reagent (101000029; Polyplus). Sixteen hours post-transfection, the medium was replaced with fresh complete DMEM, and viral supernatants were harvested 48 hours later, clarified through a 0.45 μm filter, and stored on ice. Target HEK293T cells were then transduced with the filtered viral supernatant and, after 48 hours, subjected to selection in 1 μg/mL puromycin (A424862, Sangon Biotech) until resistant colonies were established. For induction of Castor1 overexpression, stable HEK293T cells harboring either the Mm-Castor1 or control pTRIPZ construct were treated with 0.2 μg/mL doxycycline (S5159, Selleck) for 48 hours. Plasmids psPAX2, pMD2.G, and PEIpro transfection reagent were kindly provided by Dr. Biao Dong’s laboratory, and the pTRIPZ–Mm-Castor1 vector was obtained from GENEWIZ (NJ, USA). All procedures were performed under sterile conditions in a biosafety cabinet, and viral work complied with institutional biosafety regulations.
SA-β-gal stainingCellular senescence was evaluated by histochemical detection of senescence-associated β-galactosidase (SA-β-gal) activity using the SA-β-gal Staining Kit (G1580; Solarbio, Beijing, China) in accordance with the manufacturer’s instructions. Briefly, cells were fixed and incubated with the X-gal staining solution at 37 °C (no CO₂) until bluish-green granules became evident in the cytoplasm, indicating SA-β-gal activity. Five microscopic views were randomly selected under bright-field microscopy, and over 300 cells per group were counted; the proportion of SA-β-gal–positive cells was calculated to quantify senescence induction.
Drosophila experimentsFor Drosophila stocks and husbandry, wild-type w1118 fruit flies (Drosophila melanogaster) were obtained from Fungene (Beijing, China). Gls-RNAi lines were sourced from the Tsinghua Fly Center (Beijing, China). Tubulin-Gal4 and UAS-lacZ lines were kindly provided by Prof. Haiyang Chen (PhD). All stocks were maintained at 25 °C under a 12 h:12 h light–dark cycle on standard cornmeal-molasses-yeast medium.
To achieve tissue-wide Gls depletion, Tubulin-Gal4 virgins were crossed to UAS-Gls-RNAi males. Parallel crosses to UAS-lacZ served as genetic controls. Progeny were reared at 25 °C on standard medium until assays.
To detect the relevant indicators of fly aging. Naturally aging and H2O2-stressed flies were used. For Naturally aging, flies were maintained under the standard condition and the 10-day-old female flies were regarded as young control and 60-day-old female flies were regarded as aging flies. To establish the H2O2-stressed fly model, 10-day-old female flies were pretreated for 3 days in vials containing 1% H2O2 in standard medium. Approximately 100 pretreated flies per group were then transferred to fresh vials supplemented with either vehicle (DMSO), 0.1 µM DON, or 0.1 µM CB-839. Cohorts were maintained under standard conditions, and daily survivors were counted. Median and maximal lifespan were derived using Kaplan-Meier survival analysis in SPSS. To evaluate the mobility of flies, a climbing score assay was performed. Age-matched cohorts (about 15 flies/vial) were gently tapped to the bottom of a clean vial marked at 8 cm. The percentage of flies that climbed past the mark within 5 s was recorded. Each group was tested in triplicate; mean percentages are reported. To evaluate the gut permeability of flies, a Smurf assay was performed. Flies were fed medium containing 2.5% brilliant blue for 16 h. Flies exhibiting dye leakage into the hemocoel (“Smurf” phenotype) were scored as positive; the percentage of Smurf-positive flies per cohort was calculated.
For sample collection and metabolite extraction, adult flies were anesthetized with CO₂, decapitated to isolate cephalothoraxes, which were immediately flash-frozen on dry ice (abdomen discarded). Batches of 15–20 cephalothoraxes were pooled per sample and stored in liquid nitrogen. Prior to metabolomic analysis, samples were homogenized in 1 mL of pre-chilled (−80 °C) 80% methanol containing isotopic internal standards using a high-throughput bead-mill homogenizer. Extracts were processed exactly as described in “Cellular metabolomics analysis,” including homogenization, protein precipitation, sonication, vacuum concentration, and HILIC reconstitution.
For dietary supplementation regimens, to model elevated amino acid intake, 10-day-old female w1118 flies (∼100 per group) were maintained on standard medium supplemented with specified concentrations of either l-glutamine or l-arginine for the duration of the experiment. Survival assays were performed as described above.
Mouse experimentsMale C57BL/6J mice (10 weeks old) were obtained from Beijing HFK Bioscience Co., Ltd. (Beijing, China). Animals were housed at the Experimental Center of West China Hospital under specific pathogen-free (SPF) conditions, with ad libitum access to standard chow and water, a controlled temperature (22 ± 2 °C), and a 12 h:12 h light-dark cycle. All procedures were approved by the Laboratory Animal Ethics Committee of West China Hospital, Sichuan University (20240227038).
To compare young versus naturally aged phenotypes, an independent cohort of C57BL/6 J mice was maintained from 10 weeks to 27 months of age under identical husbandry conditions. A separate group of age-matched young controls (3 months old) was generated by purchasing 10-week-old mice and acclimating them for 2 weeks prior to sacrifice. Mice were sacrificed under anesthesia, and tissues were harvested immediately: epididymal white adipose tissue (eWAT) for SA-β-gal staining; spleen, kidney and gastrocnemius muscle for glutaminase (GLS) enzyme activity assays and targeted LC-MS/MS metabolomic analysis.
To establish AAV9-mediated argininosuccinate lyase (Asl) knockdown, 3-month-old male C57BL/6 J mice received a single tail-vein injection of AAV9-shAsl (1 × 10¹¹ viral genomes [vg]) to achieve systemic Asl knockdown; AAV9-Vector (1 × 10¹¹ vg) served as a negative control. Two weeks post-injection, mice were randomized to receive either standard drinking water or water supplemented with 200 mM glutamine for 3 consecutive days. At the end of the study, mice were anesthetized and subjected to in vivo fluorescence imaging (IVIS Spectrum, Guangzhou Biolight Biotechnology Co., Ltd.) to confirm transduction efficiency via GFP signal. Gastrocnemius muscles were then dissected for downstream analyses, including RT-qPCR, LC-MS/MS quantification of metabolites, and western blotting. AAV9 vectors were produced by PackGene Biotech (Massachusetts, USA), and the shAsl sequence was as previously described.66
For SA-β-gal staining, fresh eWAT was fixed with 10% of paraformaldehyde, and stained using the SA-β-gal Staining Kit (G1580; Solarbio) according to the manufacturer’s protocol. To detect GLS activity in mice, tissue homogenates were prepared in ice-cold assay buffer; GLS activity was measured using a glutaminase (GLS) test kit (A124-1-1; Nanjing Jiancheng Bioengineering Institute) following the vendor’s instructions. To measure the metabolite levels in tissues, the samples were first flash-frozen in liquid nitrogen, and tissues from 3-5 mice were pooled together and homogenized with pre-chilled 80% methanol containing isotopic internal standards. Extracts were processed and analyzed exactly as described in “Cellular metabolomics analysis.” Total RNA was isolated from gastrocnemius muscle using RNAiso Plus (9109; Shiga, Japan), and 1 μg of total RNA was reverse transcribed with HiScript III RT SuperMix for qPCR (+gDNA wiper; R323-01; Vazyme, Jiangsu, China). RT-qPCR was subsequently performed using Taq Pro Universal SYBR qPCR Master Mix (Q712; Vazyme) with the gene-specific primers listed in Supplementary Table 5. Protein lysates were prepared in RIPA buffer (R0020; Solarbio) supplemented with proteinase inhibitor cocktail (B14001; Selleck), and protein concentration was quantified by BCA assay (C503021; Sangon Biotech), and subjected to SDS-PAGE and immunoblotting for the indicated proteins.
Western BlottingWhole-cell proteins were solubilized in RIPA buffer (R0020; Solarbio) supplemented with protease inhibitors (B14001; Selleck), lysates were rotated at 4 °C for 30 min and clarified by centrifugation, and total protein was quantified by BCA assay (C503021; Sangon Biotech). Equal amounts (30 µg) of protein were resolved by SDS-PAGE and electrophoretically transferred onto PVDF membranes (IPVH00010; Millipore). Membranes were blocked in 5% skim milk in TBS-T, incubated with primary antibodies against target proteins under optimized dilutions overnight at 4 °C, and then incubated with HRP-conjugated secondary antibodies. Chemiluminescent signals were developed using Ultrasensitive ECL Kit (PD202; Oriscience, Sichuan, China) and captured on a Fusion Solo imaging system. Band intensities were normalized to loading controls and quantified in Fiji (ImageJ2).
RT-qPCRFor gene expression analysis, total RNA was extracted from cultured cells using RNAiso Plus (9109; Shiga, Japan). One microgram of RNA was reverse-transcribed into cDNA using HiScript III RT SuperMix for qPCR (+gDNA wiper; R323-01; Vazyme). RT-qPCR was subsequently performed using Taq Pro Universal SYBR qPCR Master Mix (Q712; Vazyme) with the gene-specific primers listed in Supplementary Table 5. Reactions were run in triplicate, and relative transcript abundance was determined by the 2–ΔΔCt method, normalizing target gene Ct values to the 18S rRNA reference. All experiments were independently repeated three times.
Statistical analysisThe data from at least three independent experiments are presented as the mean ± SD. Differences between the two groups were assessed by a two-tailed unpaired Student’s t-test, while survival curves of fly cohorts were compared by the Kaplan–Meier method with a log-rank test. p ≤ 0.05 was considered significant (*p ≤ 0.05; **p ≤ 0.01; ***p ≤ 0.001).
Comments (0)