
Remember me
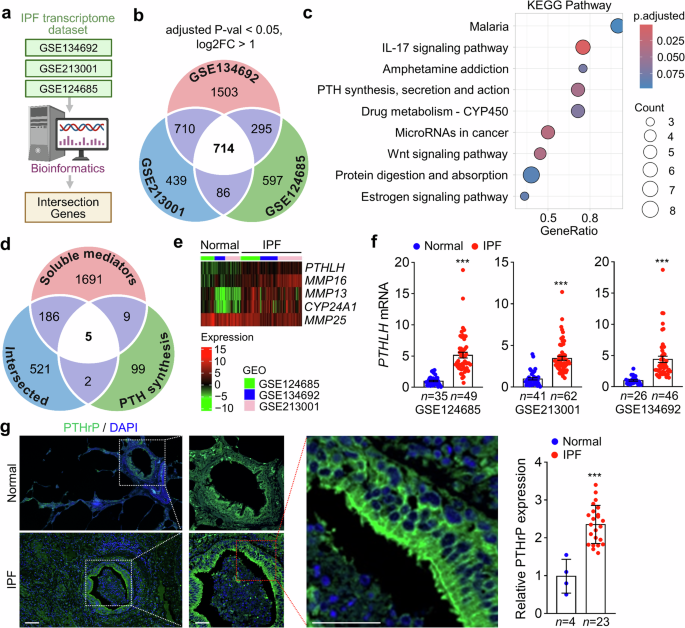
Many therapeutic strategies inhibiting secreted factors that promote fibrosis progression in preclinical models have been assessed in humans; however, further development and assessment of secreted factors for therapeutic intervention are crucial for extending the therapeutic opportunities for patients with IPF.3 To identify novel secreted factors that increase predominantly in the lungs of patients with IPF, we initially surveyed 3 different publicly available transcriptome datasets and identified 714 intersecting up- or downregulated genes (Fig. 1a, b). Among the 714 intersecting genes identified from transcriptomic datasets, Kyoto Encyclopedia of Genes and Genomes pathway analysis revealed statistically significant enrichment (adjusted p < 0.05) in gene sets associated with the IL-17 signaling pathway; PTH synthesis, secretion, and action; Wnt signaling; and microRNAs in cancer (Fig. 1c). Given the well-established clinical relevance of the IL-17 and Wnt signaling pathways in IPF and their roles as molecular targets for therapeutic development,19 we focused on identifying novel secretory factors potentially involved in IPF pathogenesis. To this end, we performed an intersectional analysis of the 714 differentially expressed genes in IPF with two curated datasets: 115 genes related to PTH synthesis, secretion, and action, and 1891 predicted secretory proteins based on The Human Protein Atlas (Fig. 1d). This integrative approach enabled the identification of previously unrecognized secretory factors that may contribute to IPF progression. Notably, we observed the upregulation of several genes encoding secretory proteins in human IPF lung tissues, including PTHLH, MMP16, MMP13, and CYP24A1 (Fig. 1e). An increase in PTHLH mRNA was observed in IPF lungs compared with healthy lungs (Fig. 1f). To measure the PTHrP encoded by PTHLH, immunofluorescence (IF) staining was performed on lung sections from patients with IPF. The low-magnification image showed that the expression of the PTHrP protein was higher in IPF lung tissues than in normal lung tissues. In addition, the enlarged image (red box) in Fig. 1g shows that PTHrP was predominantly expressed in the bronchial epithelium of the lung tissue from patients with IPF. Analysis of PTHrP expression intensity revealed that its expression was approximately 2.5-fold higher in IPF lung tissues than in normal lung tissues (Fig. 1g). These findings indicate that both PTHLH mRNA and PTHrP protein levels are elevated in lung tissues from patients with IPF.
Fig. 1
PTHrP expression in IPF and BLM-induced PF in humans. a Procedure for bioinformatics-based transcriptome analysis. b Identification of 714 commonly up- or downregulated genes in human IPF lungs using publicly available transcriptome datasets. c Top 9 activated gene sets identified by KEGG pathway analysis based on 714 common genes. d Identification of 5 genes through the intersection of genes related to soluble mediators, PTH synthesis, secretion, and action and 714 common genes. e Heatmap of PTHLH expression in normal and IPF samples. f PTHLH mRNA in normal and IPF samples. g Representative images of IF staining of PTHrP and quantification of the intensity of expression of PTHrP in human pulmonary interstitial fibrosis tissue microarrays from patients with IPF (n = 23) and healthy donors (n = 4). A magnified view of the region highlighted in the red box is shown. Scale bar: 50 μm and 100 μm (low magnification). a, b, d were created with BioRender.com. Data are shown as the mean ± SEM. P values were determined by two-tailed Student’s t test (f, g). ***P < 0.001
Tissue-specific expression of PTHLH and PTH1R highlights a bronchial epithelial–mesenchymal interaction axis in PFTo confirm the predominance of tissue-specific expression of PTHLH in human tissues, we reanalyzed publicly available single-cell transcriptome data provided by The Human Protein Atlas. Interestingly, higher expression of PTHLH was observed in basal respiratory cells and club cells, which are the main components of the bronchial epithelium, than in other cell types. However, PTHLH expression was not observed in either type 1 (AT1) or 2 (AT2) alveolar cells that compose the alveoli (Fig. 2a–c and Supplementary Fig. 1a). Single-cell analysis of PTHLH expression in human IPF lungs revealed the highest expression in basaloid cells (KRT5-, KRT17 + , and LAMB3 + ),20 with elevated levels also observed in basal respiratory cells and in the airway epithelium (Fig. 2d, e). Compared with that in healthy controls, the expression of PTHLH, along with genes associated with fibrosis, such as COL1A1, COL3A1, and ACTA2, was upregulated in IPF lungs (Fig. 2f). PTHrP expression was markedly increased in the bronchial epithelium of bleomycin (BLM)-induced fibrotic lungs, and co-expression of PTHrP with p63 and KRT17 (markers for aberrant basaloid cells) was also observed in a portion of the bronchial epithelial cell population, which was not detected in normal lungs (Fig. 2g and Supplementary Fig. 1b, c). Notably, approximately 70% of the p63+ and KRT17+ cell populations also expressed PTHrP, indicating a strong association between aberrant basaloid cell identity and PTHrP expression in fibrotic lungs (Supplementary Fig. 1d). Furthermore, PTHrP was predominantly expressed in bronchial epithelial cells, including aberrant basaloid cells, in BLM-induced fibrotic lungs, suggesting its potential involvement in the pathophysiology of PF. We reanalyzed the expression of PTH1R and parathyroid hormone 2 receptor (PTH2R), known receptors for PTHrP and PTH, respectively, at the single-cell level using the scRNA-seq data from the lung.21 Interestingly, PTH1R and PTH2R exhibited the highest expression in kidney tubular cells (Supplementary Fig. 2a, b). Among the cell types implicated in the pathogenesis of PF, PTH1R was predominantly expressed in smooth muscle cells and fibroblasts (Supplementary Fig. 2c–e). Collectively, these findings suggest a potential interaction between bronchial epithelial cells and mesenchymal cells, including bronchial smooth muscle cells and lung fibroblasts, through the PTHrP/PTH1R regulatory axis.
Fig. 2
Cell type-specific expression of PTHrP in epithelial cells of the bronchus and IPF lungs. a Visualization of uniform manifold approximation and projection (UMAP) of bronchial epithelial cell populations (n = 26,676) in scRNA-seq data from human bronchi. b UMAP visualization of single cells expressing PTHLH (red) in bronchial epithelial cell populations. c Dot plot representing the expression of PTHLH among annotated bronchial epithelial cells of the human bronchus. d UMAP visualization of subclustered cell types belonging to lung epithelial cells (n = 91,443) in IPF lungs; scRNA-seq data from IPF lungs are colored according to subclustered cells. e Dot plot representing the expression of PTHLH among annotated alveolar and bronchial epithelial cells. The dot size indicates the percentage of relative gene expression for each marker gene. The dot color reflects the average expression of the specified gene within each cell type. f Heatmap of fibrosis genes associated with different disease conditions. g Representative IF staining shows colocalization of the aberrant basaloid cell markers KRT17 (red) and p63 (white) along with PTHrP (green). Representative images were captured at 200x magnification. Scale bar: 100 μm. A magnified view of the region highlighted in the red box is shown. AT1 Alveolar type 1, AT1_2 Alveolar type 1_2, AT2 Alveolar type 2, MCC Multiciliate cell
Cell type-specific activation of fibroblasts by PTHrP1-34 through PTH1R/PKA signalingPTHrP undergoes proteolytic processing to generate multiple types of fragments, which exert diverse biological functions through both paracrine and endocrine mechanisms.12,13 Based on this, we investigated the role of distinct PTHrP fragments in mediating intercellular communication between bronchial epithelial cells and mesenchymal cells, such as smooth muscle cells and fibroblasts. Treatment of MRC5 lung fibroblasts with PTHrP fragments containing amino acids 1–34, such as PTHrP1-34 and PTHrP1-86, significantly upregulated ACTA2 expression, whereas fragments lacking this region had no effect, underscoring the functional importance of the 1–34 domain in myofibroblast activation (Fig. 3a). Treatment with PTHrP1-34 increased the expression of fibrosis-related genes and proteins in a dose- and time-dependent manner in MRC5 cells (Fig. 3b, c and Supplementary Fig. 3a), human primary lung fibroblasts derived from a patient with IPF (Fig. 3d and Supplementary Fig. 3b), and mouse primary lung fibroblasts (Supplementary Fig. 3c). PTHrP1-34 treatment increased the population of α-SMA-positive cells (Fig. 3e) and enhanced the motility of MRC5 cells (Fig. 3f and Supplementary Fig. 3d). From a structural perspective on the interaction between PTHrP and PTH1R, the N-terminal region of PTHrP (amino acids 1–14) is deeply inserted into the transmembrane domain (TMD) of PTH1R, ultimately activating the stimulatory G protein (Gs) signaling pathway, while the C-terminal region (amino acids 15–34) binds to the extracellular domain (ECD) of PTH1R, contributing to binding affinity and ligand specificity.16,22,23,24 Consistent with previous study results, our AlphaFold3-based structural analysis revealed that the N-terminal region of PTHrP1-34 inserts into the binding pocket within the TMD core of PTH1R, forming extensive interactions (Supplementary Fig. 3e). In particular, residues E4, R19, and R21 of PTHrP engage in hydrogen bonding and electrostatic interactions with key residues in the TMD of PTH1R, including Y195, R233, E35, E252, E177, and E180 (Supplementary Fig. 3f). Additionally, hydrophobic residues in the C-terminal region of PTHrP1-34, such as F23, L24, L27, I28, and I31, form broad hydrophobic contacts with the ECD of PTH1R, notably with residues I38, I115, I135, and F138 (Supplementary Fig. 3g). These findings suggest that the activation of fibroblasts via PTH1R is dependent on the region encompassing amino acids 1–34 of PTHrP, highlighting the functional significance of this fragment in receptor engagement and downstream signaling. Based on the known involvement of PTH1R in mitogen-activated protein kinase (MAPK), PKA, and AKT signaling pathways across various cell types,25,26 we investigated the key intracellular signaling cascades mediating fibroblast activation in response to PTHrP1-34. In MRC5 fibroblasts treated with PTHrP1-34, we observed a marked increase in the phosphorylation of cAMP-response element binding protein (CREB) and PKA substrates, whereas activation of the MAPK and AKT pathways was not detected (Fig. 3g). Consistent with a PTH1R-dependent mechanism, knockdown of PTH1R in MRC5 cells significantly attenuated the expression of fibrosis-related genes and proteins induced by PTHrP1-34 (Fig. 3h and Supplementary Fig. 3h–j). Furthermore, pretreatment with the PKA inhibitor H89 abolished the PTHrP1-34-mediated upregulation of fibrosis markers (Fig. 3i and Supplementary Fig. 3k, l), confirming the essential role of the PKA pathway in this process. To determine the effective concentration range of PTHrP1-34 in activating PTH1R/PKA signaling, we generated HEK293 cells stably expressing PTH1R (HEK293-PTH1R) and transfected them with a cAMP response element (CRE)-luciferase reporter. Dose–response analysis revealed an EC₅₀ of 18.14 ng/mL for PTHrP-induced luciferase activity (Fig. 3j). These findings collectively demonstrate that PTHrP1-34 activates fibroblasts through a PTH1R/PKA/CREB signaling axis, independent of the MAPK and AKT pathways (Fig. 3k). Given that PTH1R is highly expressed in smooth muscle cells, we evaluated the role of PTHrP1-34 in regulating intracellular calcium levels, ECM synthesis, proliferation, and motility in human primary bronchial smooth muscle cells (HBSMCs). To assess whether PTHrP1-34 stimulates calcium influx in HBSMCs, we performed intracellular calcium imaging using Fluo-4 AM. PTHrP1-34 did not evoke a measurable Ca²⁺ influx upon acute stimulation, while 50 mM KCl induced a marked increase in intracellular Ca²⁺ as a positive control (Supplementary Fig. 4a). Unlike fibroblasts, treatment of HBSMCs with PTHrP1-34 did not result in any detectable changes in the expression of ACTA2, COL1A1, and COL3A1 (Supplementary Fig. 4b). The proportion of cells in the S phase of the cell cycle in HBSMCs increased in a supplement concentration-dependent manner, as the supplement contained fetal calf serum (FCS) and some growth factors; however, no detectable changes in cell cycle progression were observed when HBSMCs were cultured in the presence of PTHrP1-34 (Supplementary Fig. 4c). Transwell chamber assays revealed no detectable changes in the motility of HBSMCs upon PTHrP1-34 treatment (Supplementary Fig. 4d). Unlike HBSMCs cultured with 2% FCS containing growth factors, which exhibited activation of MAPK, PKA, and AKT signaling pathways, cells treated with PTHrP1-34 showed no detectable activation of these signaling cascades (Supplementary Fig. 4e). These findings reveal that PTHrP1-34 selectively activates fibroblasts via PTH1R/PKA signaling, while HBSMCs remain unresponsive, highlighting a cell type-specific divergence in PTHrP1-34-mediated intercellular communication.
Fig. 3
PTHrP1-34 induces the activation of lung fibroblasts via PTH1R/PKA signaling. a Expression of ACTA2 mRNA in MRC5 cells treated with PTHrP peptides (aa 1-86, 1-34, 38–64, 67–86, or 107–138). Peptides (100 ng/mL) were incubated for 48 h. b Fibrosis-related proteins (α-SMA and COL1A1) in MRC5 cells treated with PTHrP1-34 in a dose-dependent manner for 48 h. c Fibrosis-related proteins (α-SMA and COL1A1) in MRC5 cells treated with PTHrP1-34 (100 ng/mL) in a time-dependent manner. d Expression of fibrosis-related genes in human IPF fibroblasts following incubation with PTHrP1-34 (100 ng/mL) for 24 h. e Representative IF images of α-SMA (green) in MRC5 cells incubated with PTHrP1-34 (100 ng/mL, 24 h) and quantification of α-SMA-positive cells. Scale bar: 100 μm. f Quantification of MRC5 cell migration following PTHrP1-34 (100 ng/mL) treatment for 24 h. g Western blot analysis of MAPK, PKA and AKT signaling pathways in MRC5 cells treated with PTHrP1-34 (100 ng/mL) for 10 min. h Expression of fibrosis-related genes in MRC5 cells transiently transfected with siRNA (20 nM) targeting control (siControl) or PTH1R (siPTH1R#1 and siPTH1R#2), followed by treatment with PTHrP1-34 (100 ng/ml) for 48 h. i ACTA2 mRNA levels in MRC5 cells pretreated with the PKA inhibitor H89 (10 μM) for 1 h prior to PTHrP1-34 treatment (100 ng/mL, 48 h). j The EC50 value of the PTHrP1-34 was determined based on CRE-luciferase activity in HEK293-PTH1R cells. k Schematic representation of the expected intracellular signaling cascades activated in fibroblasts following PTHrP1-34 stimulation. All data shown are the mean ± SEM. P values were determined by two-tailed Student’s t-test in (d–f) and one-way ANOVA Tukey’s test in (a, h, i). *P < 0.05, ***P < 0.001. ns not significant
PTHrP1-34 exacerbates BLM-induced PF in vivoTo evaluate the profibrotic effects of PTHrP1-34 under physiological conditions, we assessed the expression of fibrosis-related genes in the lungs of PTHrP1-34-treated mice. Intratracheal (IT) administration of PTHrP1-34 for 1 or 2 days significantly upregulated fibrosis genes in mouse lungs (Fig. 4a, b). Consistent with short-term exposure studies, repeated administration of PTHrP1-34 every 3 days over a period of 1 month also elevated the expression of fibrosis genes (Fig. 4c, d). Long-term administration of PTHrP1-34 led to a modest increase in lung weight by approximately 5.7% and a substantial elevation in hydroxyproline content by approximately 35% (Fig. 4e, f). Following chronic exposure to PTHrP1-34, elevated levels of α-SMA protein were observed in lung tissues, whereas Masson’s trichrome staining did not reveal a clear accumulation of collagen, suggesting that although fibrotic markers were upregulated, overt fibrosis was not prominent (Fig. 4g). These findings suggest that PTHrP1-34 partially contributes to collagen production and fibrotic remodeling through aberrant activation of fibroblasts; however, whether PTHrP1-34 alone is sufficient to initiate and drive the onset and progression of PF remains to be explored. To further assess the profibrotic potential of PTHrP1-34, we employed a low-dose BLM-induced PF model (0.75 mg/kg) and evaluated the effects of repeated PTHrP1-34 administration. Compared with the mice in the PTHrP1-34-only and BLM-only groups, mice co-treated with BLM and PTHrP1-34 exhibited a marked reduction in body weight and an increase in lung weight (Fig. 4h, i). While PTHrP1-34 alone modestly elevated the expression of fibrosis-related genes, co-treatment with BLM resulted in a dramatic upregulation of these genes and hydroxyproline content (Fig. 4j, k and Supplementary Fig. 5a). Histological analysis revealed that co-administration of BLM and PTHrP1-34 led to increased cell density, severe collagen deposition, and a marked elevation in α-SMA expression in the lungs (Fig. 4l and Supplementary Fig. 5b). These findings demonstrate that PTHrP1-34 markedly exacerbates fibrotic outcomes in the context of lung injury, acting as a potent driver of tissue remodeling. Given that the pathogenesis of PF is initiated by alveolar epithelial cell injury followed by inflammation and the secretion of profibrotic mediators that aberrantly activate lung fibroblasts, we investigated the effects of PTHrP1-34 on epithelial cell injury in both alveolar and bronchial compartments. Chronic exposure of mice to PTHrP1-34 did not result in macrophage infiltration in lung tissue, suggesting that PTHrP1-34 does not exert proinflammatory effects (Supplementary Fig. 5c). Consistently, the expression of key inflammatory and profibrotic cytokines, including IL-6, TGFB1, and IL-11, remained unchanged upon PTHrP1-34 treatment in A549 cells, human primary alveolar epithelial cells (AECs), and human primary bronchial epithelial cells (HBEpCs) (Supplementary Fig. 5d). To assess the cellular response of epithelial cells to PTHrP1-34, we cultured AECs, mouse AT2 (mAT2), and HBEpC cells with PTHrP1-34 for 24 h. No significant changes in cell viability were observed (Supplementary Fig. 5e). In AECs exposed to hydrogen peroxide (H2O2), cleaved-caspase-3 levels were markedly increased, whereas PTHrP1-34 treatment did not alter cleaved-caspase-3 expression (Supplementary Fig. 5f). Additionally, PTHrP1-34 did not affect the MAPK, PKA, or AKT signaling pathways in either AECs or HBEpC cells (Supplementary Fig. 5g). PTHrP1-34 does not induce cytotoxicity or activate canonical signaling pathways in lung alveolar and bronchial epithelial cells, indicating cell type-specific responsiveness. In addition, PTHrP1-34 induced the expression of α-SMA and COL1A1 even in the presence of the TGFβ1/Smad pathway inhibitor LY2109761 (Supplementary Fig. 5h). PTHrP1-34 did not stimulate TGFβ1 production or Smad3 phosphorylation (Supplementary Fig. 5i–k), indicating that its profibrotic effects are independent of the canonical TGFβ1/Smad signaling axis. Collectively, these observations indicate that PTHrP1-34 functions as a potent enhancer of PF by promoting fibroblast activation and tissue remodeling in injured lungs, while exerting minimal direct effects on epithelial cells, highlighting its cell type-specific profibrotic activity.
Fig. 4
PTHrP1-34 activates lung fibroblasts and promotes BLM-induced PF. a, b Mice were sacrificed and lung tissues were collected 1 and 2 days after IT injection of saline or PTHrP1-34 (0.5 mg/kg). (n = 5 each group, biological replicates). a Schematic of the experimental schedule. The experimental scheme was created with BioRender.com. b Expression of fibrosis genes in lung tissues. c–g Mice were administered saline or PTHrP1-34 (0.5 mg/kg) via IT injection every 3 days for 30 days. (n = 8 each group, biological replicates). c Schematic of the experimental schedule. d Expression of fibrosis-related genes. e Lung weight of mice at the end of the experiment. f Hydroxyproline content in lung tissues. g Masson’s trichrome and H&E staining. Scale bar: 100 μm. IF images of ɑ-SMA in lung sections. Scale bar: 200 μm. h–l After injecting BLM (0.75 mg/kg) into the mice, PTHrP1-34 (0.5 mg/kg) was administered by IT injection every 3 days for a total of 12 days, and the animal experiment was terminated 3 days after the final injection (n = 6 each group, biological replicates). h Changes in the body weight of the mice. i Lung weight of mice sacrificed at the end of the experiment. j Acta2 mRNA and k hydroxyproline levels in the lungs. l Masson’s trichrome and IF images of ɑ-SMA in lung sections. Scale bar: 100 μm. Data are shown as the mean ± SEM. P values were analyzed by two-tailed Student’s t test in (d–f), two-way ANOVA (h) and one-way ANOVA and Tukey’s test in (b, i–k). *P < 0.05, **P < 0.01, ***P < 0.001. ns not significant
Bronchial epithelial cell-derived PTHrP1-34 drives fibroblast activation in BLM-induced lung injuryTo delineate the pathophysiological role of PTHrP1-34 in lung injury-induced PF, we investigated its temporal expression during the inflammatory and fibrotic phases. Following BLM administration (1 mg/kg), PTHrP expression in bronchial epithelial cells showed a modest increase by day 3, followed by a marked elevation on days 7 and 15 (Fig. 5a). This upregulation coincided with progressive fibrotic changes, including body weight loss, increased lung weight, pulmonary edema, and old hemorrhagic lesions (Supplementary Fig. 6a, b). Lung lysates revealed elevated levels of fibrotic markers and full-length PTHrP protein (Supplementary Fig. 6c, d). Notably, hydroxyproline content and Pthlh mRNA expression began to rise by day 7 and peaked on day 15 (Fig. 5b, c), whereas Tnf-α mRNA, a proinflammatory cytokine, was highest on days 3 and 7 (Supplementary Fig. 6e). These findings suggest that PTHrP upregulation follows the initial inflammatory response and may contribute to the transition toward fibrosis. Consistent with this, PTHrP1-34 levels in BALF increased approximately twofold on day 7 and further rose to threefold by day 15 compared to those in controls (Fig. 5d). In lung homogenates, PTHrP1-34 levels were elevated by 43% on day 15 (Fig. 5e), while no significant changes were observed in the plasma (Supplementary Fig. 6f), indicating that PTHrP1-34 is locally and dynamically upregulated in the lung following BLM-induced injury, with peak expression during the fibrotic phase. Supporting the clinical relevance of these findings, analysis of lung homogenates from patients with IPF revealed a 57.5% increase in PTHrP1-34 levels compared to those from normal lung tissues (Fig. 5f), suggesting that PTHrP1-34 upregulation is a conserved feature of fibrotic lung remodeling. These results suggest that epithelial-derived PTHrP1-34 may play a pivotal role in the transition from inflammation to fibrosis, independent of systemic circulation. Hypoxia, a hallmark of fibrotic lung environments, promotes disease progression and has been shown to upregulate PTHrP expression.27 Thus, we further examined whether hypoxia itself could induce PTHrP expression. BEAS-2B and HBEpC cells were cultured under hypoxic conditions, which led to a significant increase in PTHLH mRNA expression and elevated levels of PTHrP1-34 in the conditioned medium (CM) (Supplementary Fig. 6g, h). These findings support the notion that hypoxia may involve epithelial PTHrP production. To provide direct evidence of PTHrP1-34 secretion from bronchial epithelial cells and its potential role in epithelial–fibroblast communication, we analyzed BLM-induced changes in PTHrP1-34 expression and release using BEAS-2B and HBEpC cells. In BEAS-2B cells, PTHLH mRNA expression increased in a dose-dependent manner upon BLM treatment (Fig. 5g), and a similar increase was observed in HBEpCs (Fig. 5h). Consistent with these transcriptional changes, PTHrP1-34 levels were significantly elevated in the CM from both BLM-treated BEAS-2B and HBEpC cells (Fig. 5i and j), providing direct evidence of PTHrP1-34 secretion in response to epithelial injury and supporting its role in intercellular signaling during fibrotic remodeling. CM from BLM-treated BEAS-2B cells (BLM-CM) induced the expression of fibrotic markers in MRC5 fibroblasts at both the mRNA and protein levels. In contrast, BLM-CM derived from PTHLH-knockdown BEAS-2B cells elicited a markedly attenuated induction of these markers (Fig. 5k, l). Notably, ACTA2 expression was reduced by approximately 50% in fibroblasts treated with BLM-CM from PTHLH-silenced cells compared to that in control BLM-CM, suggesting that PTHrP1-34 is a key profibrotic factor among the multiple mediators present in BLM-CM. To directly assess the contribution of PTHrP1-34 to the profibrotic activity of BLM-CM, we supplemented BLM-CM from PTHLH-silenced BEAS-2B cells with various PTHrP peptides. Treatment of MRC5 fibroblasts with these supplemented media revealed that both PTHrP1-34 and the longer PTHrP1-86 fragment restored the expression of fibrotic genes (Fig. 5m), confirming the functional relevance of epithelial-derived PTHrP1-34 in fibroblast activation. Collectively, these observations indicate that epithelial-derived PTHrP1-34 is a key mediator of fibroblast activation in response to BLM-induced lung injury.
Fig. 5
BLM induces PTHrP1-34 secretion from bronchial epithelial cells. a–f Timeline of BLM (1 mg/kg) intratracheal administration and sacrifice at 0, 1, 3, 7, and 15 days post-injection (n = 5 each group, biological replicates). a Masson’s trichrome staining and IF images of PTHrP (green) expression in mouse lung tissue. Scale bar: 100 μm. b Hydroxyproline content in the lungs. c Pthlh mRNA expression levels in lung lysates. d Quantification of PTHrP1-34 in BALF. e Quantification of PTHrP1-34 in lung lysates f Quantification of PTHrP1-34 in human IPF patients (n = 5, biological replicates). g PTHLH mRNA levels in BEAS-2B cells treated with the indicated concentrations of BLM for 48 h. h PTHLH mRNA levels following BLM stimulation in HBEpC for 48 h. i Quantification of PTHrP1-34 in CM derived from BLM-treated BEAS-2B cells. j Quantification of PTHrP1-34 in CM derived from BLM-treated HBEpCs. k Fibrosis-related proteins in MRC5 cells stimulated with CM from BLM-treated, shPTHLH-infected BEAS-2B cells. l Fibrosis-related genes in MRC5 cells stimulated with CM from BLM-treated, shPTHLH-infected BEAS-2B cells. m MRC5 cells were treated with CM derived from BLM-treated, shPTHLH lentivirus-infected BEAS-2B cells, followed by treatment with PTHrP domain peptides (aa 1-86, 1-34, 38–64, 67–86, and 107–138). Data are shown as the mean ± SEM. P values were determined by two-tailed Student’s t test in (e, f, h–j) and one-way ANOVA and Tukey’s test in (b–d, g, l, m). *P < 0.05, **P < 0.01, ***P < 0.001. ns not significant
PTHrP neutralizing antibody (α-PTHrP) prevents and reverses BLM-induced PF in miceTo evaluate the neutralizing capacity and effective dose of α-PTHrP, we first assessed CRE-luciferase activity in HEK293-PTH1R cells stimulated with PTHrP1-34. The antibody dose-dependently inhibited PTHrP1-34-induced CRE-Luc activation, with an IC₅₀ value of 6.225 μg/mL (Fig. 6a). Consistent with this result, treatment of MRC5 cells with 6.044 μg/mL α-PTHrP reduced PTHrP1-34-induced ACTA2 expression by approximately 50% (Fig. 6b). Moreover, fibrosis markers upregulated by PTHrP1-34 were dramatically suppressed at both the mRNA and protein levels by 5 μg/mL α-PTHrP in MRC5 and IPF patient-derived lung fibroblasts (Fig. 6c and Supplementary Fig. 7a–c). Importantly, α-PTHrP at 5 μg/mL also significantly attenuated the BLM-CM-induced expression of fibrosis genes and proteins (Fig. 6d and Supplementary Fig. 7d), further supporting its therapeutic potential in fibrotic contexts. In this study, we identified that PTHrP is markedly upregulated between days 3 and 7 following BLM administration. This temporal pattern aligns with established preclinical guidelines for BLM-induced PF models, which designate day 6 post-BLM injection as a representative time point for the late phase of ALI (days 0–7) and the early stage of fibroproliferation (days 3–14).28 Based on these findings, we selected day 6 as the intervention point to evaluate the antifibrotic efficacy of α-PTHrP in vivo, aiming to target the early fibrotic signaling cascade initiated by BLM-induced PTHrP upregulation. Six days after BLM administration, α-PTHrP (1 mg/kg) was administered by IT instillation every 3 days for a total of 3 times, and the mice were monitored for a total of 15 days (Fig. 6e). Severe body weight loss and increased lung weight in BLM-induced PF mice were significantly reversed by α-PTHrP administration (Fig. 6f, g). An increased survival rate of BLM-induced PF mice was observed after administration of α-PTHrP (Fig. 6h). Lower expression of fibrosis genes and proteins was observed in the lungs of BLM-induced PF mice treated with α-PTHrP compared with those in the IgG-treated mice (Fig. 6i, j and Supplementary Fig. 7e). Increased hydroxyproline levels, indicating collagen accumulation in BLM-induced PF lungs, were significantly reversed by α-PTHrP administration (Fig. 6k). BALF collected from the α-PTHrP-administered mice contained lower levels of PTHrP1-34 compared with that collected from mice treated with IgG in the BLM-induced PF model (Fig. 6l), indicating that α-PTHrP can trigger PTHrP1-34 elimination within the bronchial lumen and in the fibrotic region. Histological evaluation, including H&E, Masson’s trichrome, and ɑ-SMA staining of lung slices, showed that α-PTHrP administration effectively reduced and recovered fibrotic remodeling of the lung parenchyma, collagen deposition (blue staining), and myofibroblasts compared with IgG administration in the lungs of the BLM-induced PF model (Fig. 6m). To assess the clinical relevance of early therapeutic intervention with α-PTHrP during the acute inflammatory phase of lung injury, α-PTHrP treatment was initiated 3 days after BLM injection, a time point at which PTHrP expression begins to increase. This timing was chosen to target the early fibrotic signaling cascade triggered by BLM-induced PTHrP upregulation. In this context, α-PTHrP treatment effectively reversed BLM-induced body weight loss and the increased expression of fibrosis genes (Supplementary Fig. 7f, g). To determine the optimal therapeutic dose of α-PTHrP, compare its efficacy with the approved antifibrotic drug nintedanib, and assess long-term treatment outcomes, we administered low-dose α-PTHrP (0.5 mg/kg and 0.1 mg/kg) via IT instillation every 3 days starting on day 6 post-BLM injection. In parallel, nintedanib (30 mg/kg) was administered orally once daily (Supplementary Fig. 7i). We compared body weight recovery as a surrogate marker of disease severity. Nine days after treatment initiation, mice in the BLM-only group exhibited an average body weight of 17–18 g. In contrast, mice treated with 0.1 mg/kg α-PTHrP showed a modest recovery to 19.5 g (11.43% increase), while those receiving 0.5 mg/kg and 1 mg/kg demonstrated more substantial recovery to 21.5 g (22.86% increase) (Fig. 6f and Supplementary Fig. 7h). The similar efficacy observed for the 0.5 mg/kg and 1 mg/kg groups suggests a plateau effect, indicating that 0.5 mg/kg may represent the minimum effective dose. Notably, 0.5 mg/kg α-PTHrP showed comparable body weight recovery to nintedanib, and 1 mg/kg α-PTHrP outperformed nintedanib. No further enhancement in body weight recovery was observed on day 15 compared to that on day 9 (Supplementary Fig. 7 h). Analysis of hydroxyproline content and fibrosis gene expression revealed similar reductions in mice treated with nintedanib and in those receiving low-dose α-PTHrP (0.5 or 0.1 mg/kg) (Supplementary Fig. 7j, k). Histological examination further confirmed that collagen accumulation was comparably attenuated in both treatment groups, supporting the antifibrotic efficacy of α-PTHrP (Supplementary Fig. 7l). These findings collectively demonstrate that α-PTHrP effectively neutralizes PTHrP1-34 signaling and alleviates BLM-induced PF, showing comparable or superior therapeutic efficacy to nintedanib even at low doses.
Fig. 6
PTHrP1-34 neutralizing antibody (α-PTHrP) attenuates BLM-induced PF. a The IC50 value of the α-PTHrP was determined based on CRE-luciferase activity in PTHrP1-34-treated HEK293-PTH1R cells. b The IC50 value of the α-PTHrP was determined based on ACTA2 mRNA expression in PTHrP1-34-treated MRC5 cells. c MRC5 cells were pretreated with α-PTHrP (5 μg/mL), followed by stimulation with PTHrP1-34. Representative IF images of α-SMA and COL1A1. Scale bar: 200 μm d CM from BLM (5 μg/mL, 48 h)-treated BEAS-2B cells was mixed with α-PTHrP (5 μg/mL) and applied to MRC5 cells for analysis of fibrosis genes. e–g, i–m α-PTHrP (1 mg/kg) was administered by IT injection every 3 days for 12 days, starting on day 6 after BLM (1 mg/kg) challenge, and the animal experiment was terminated on day 15 (n = 7 each group, biological replicates). e Scheme for the experimental schedule. f Changes in the body weight of the mice. g Lung weight of mice measured after sacrifice at the end of the experiment. h Survival rate analysis in mice. α-PTHrP was administered by IT injection every 3 days for 18 days, starting on day 6 after BLM (2 mg/kg) challenge; the animal experiment was stopped on day 21 (n = 10 each group, biological replicates). i Expression of fibrosis-related genes and j expression of proteins in the lungs of mice. k Hydroxyproline content in the lungs. l Quantification of PTHrP1-34 in the BALF of mice. m Masson’s trichrome, H&E staining, and IF images of α-SMA in lung sections. Scale bar: 100 μm. All data are shown as the mean ± SEM. P values were analyzed by two-way ANOVA (f, h) and one-way ANOVA and Tukey’s test in (d, g, i, k, l). **P < 0.01, ***P < 0.001. ns not significant
PTHrP7-34 is a potent antagonist of PTHrP1-34/PTH1R signaling in BLM-induced PF in miceNext, we investigated the antagonistic efficacy of PTHrP7-34, a competitive peptide inhibitor designed to disrupt the bipartite interaction between PTHrP1-34 and PTH1R, wherein the N-terminal region of PTHrP engages the TMD to activate Gs signaling, and the C-terminal region binds to the ECD to stabilize
Comments (0)