
Remember me
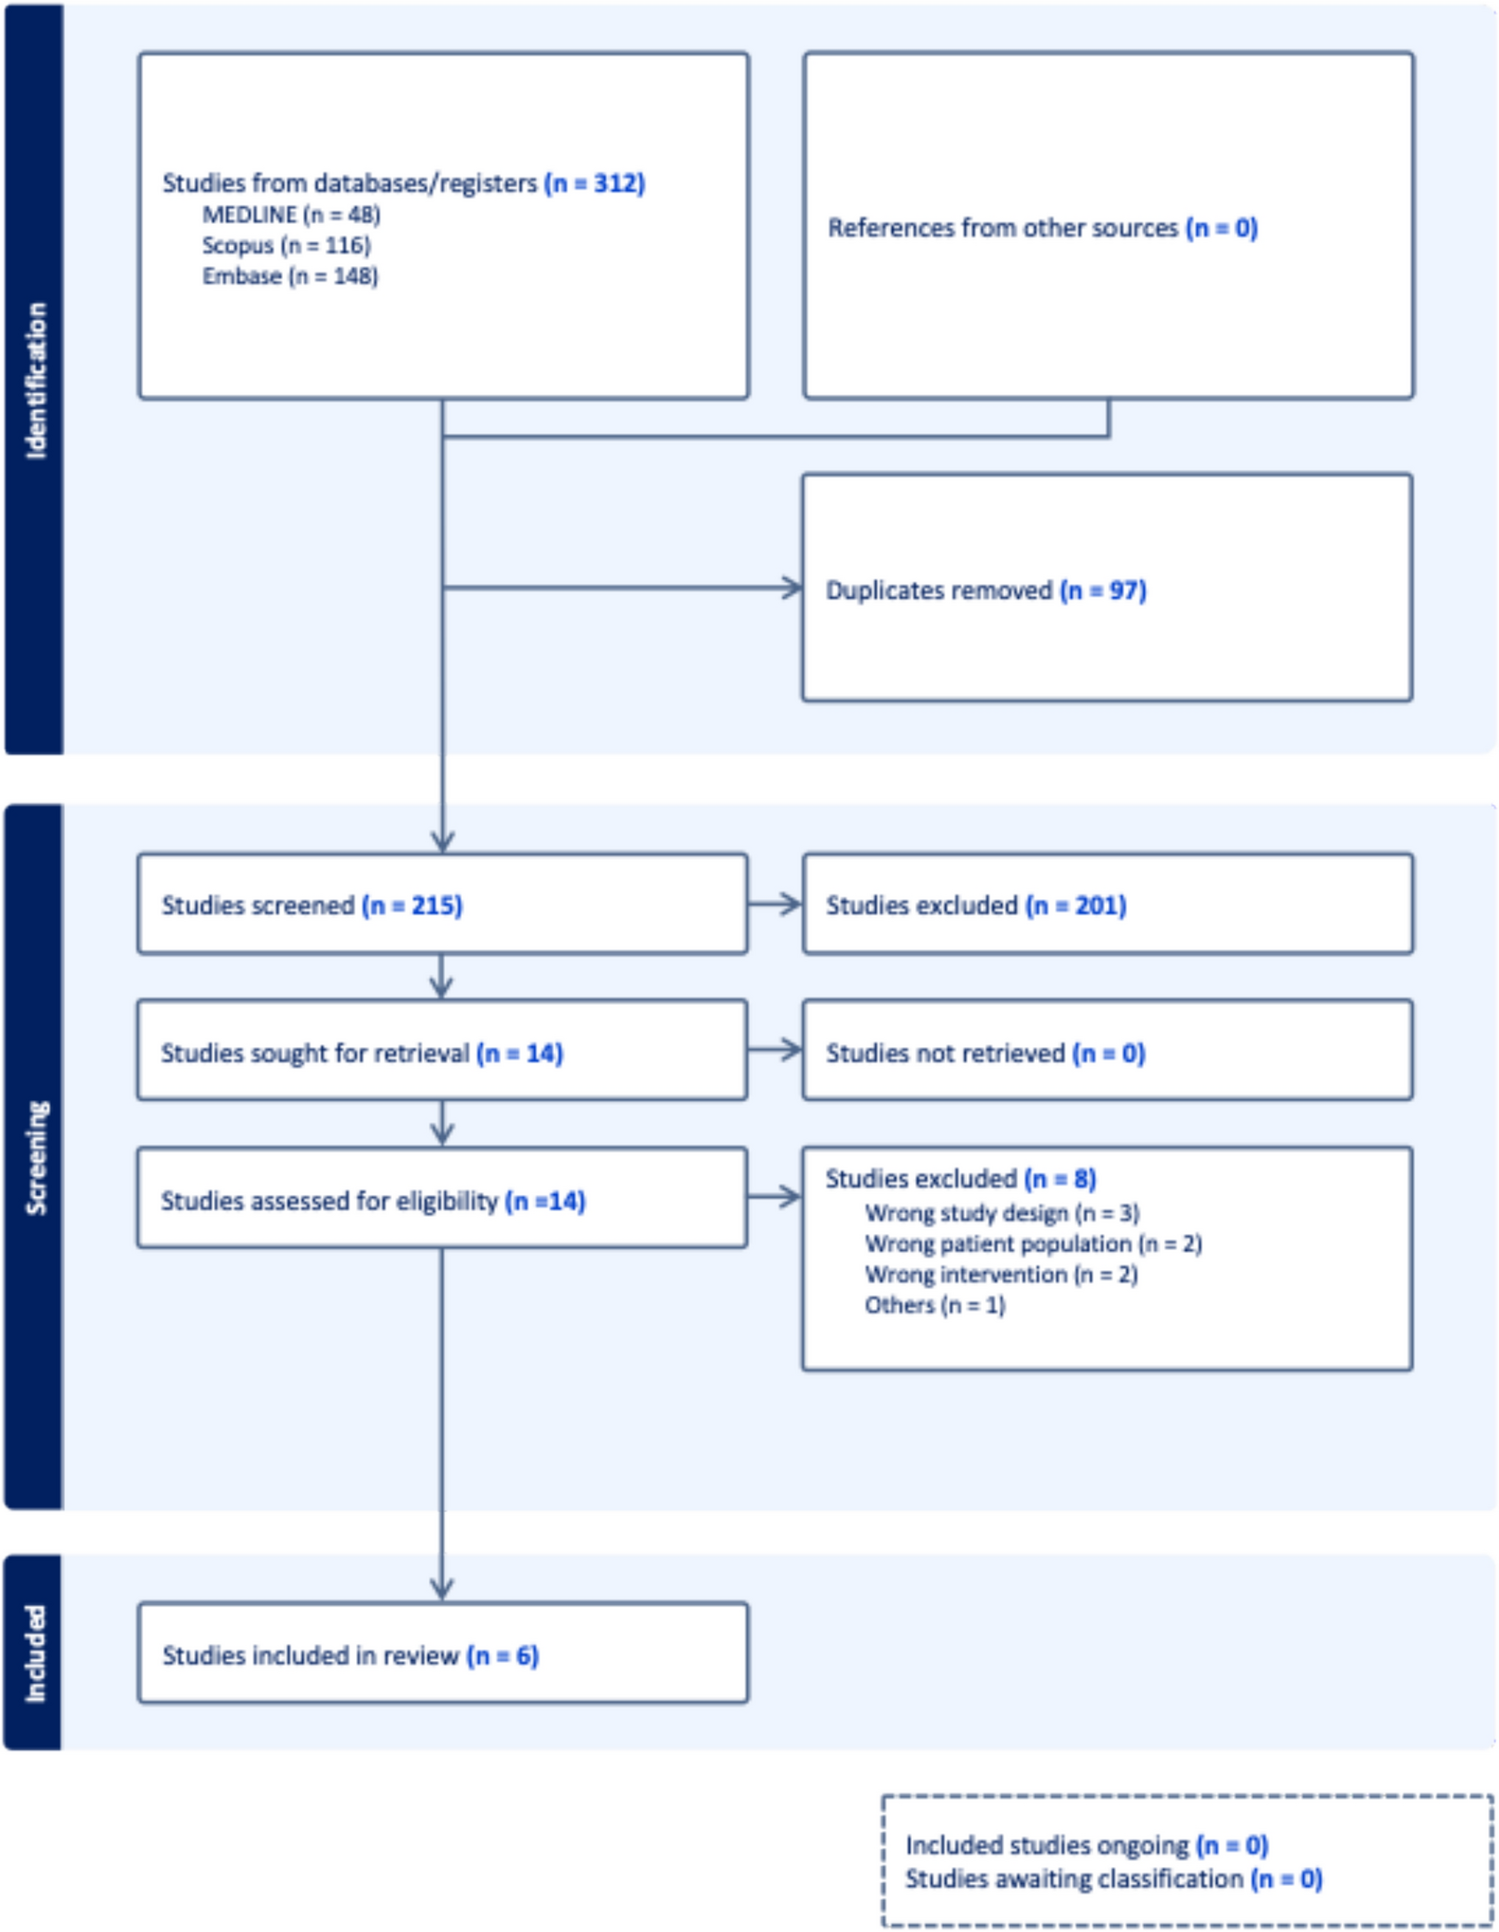
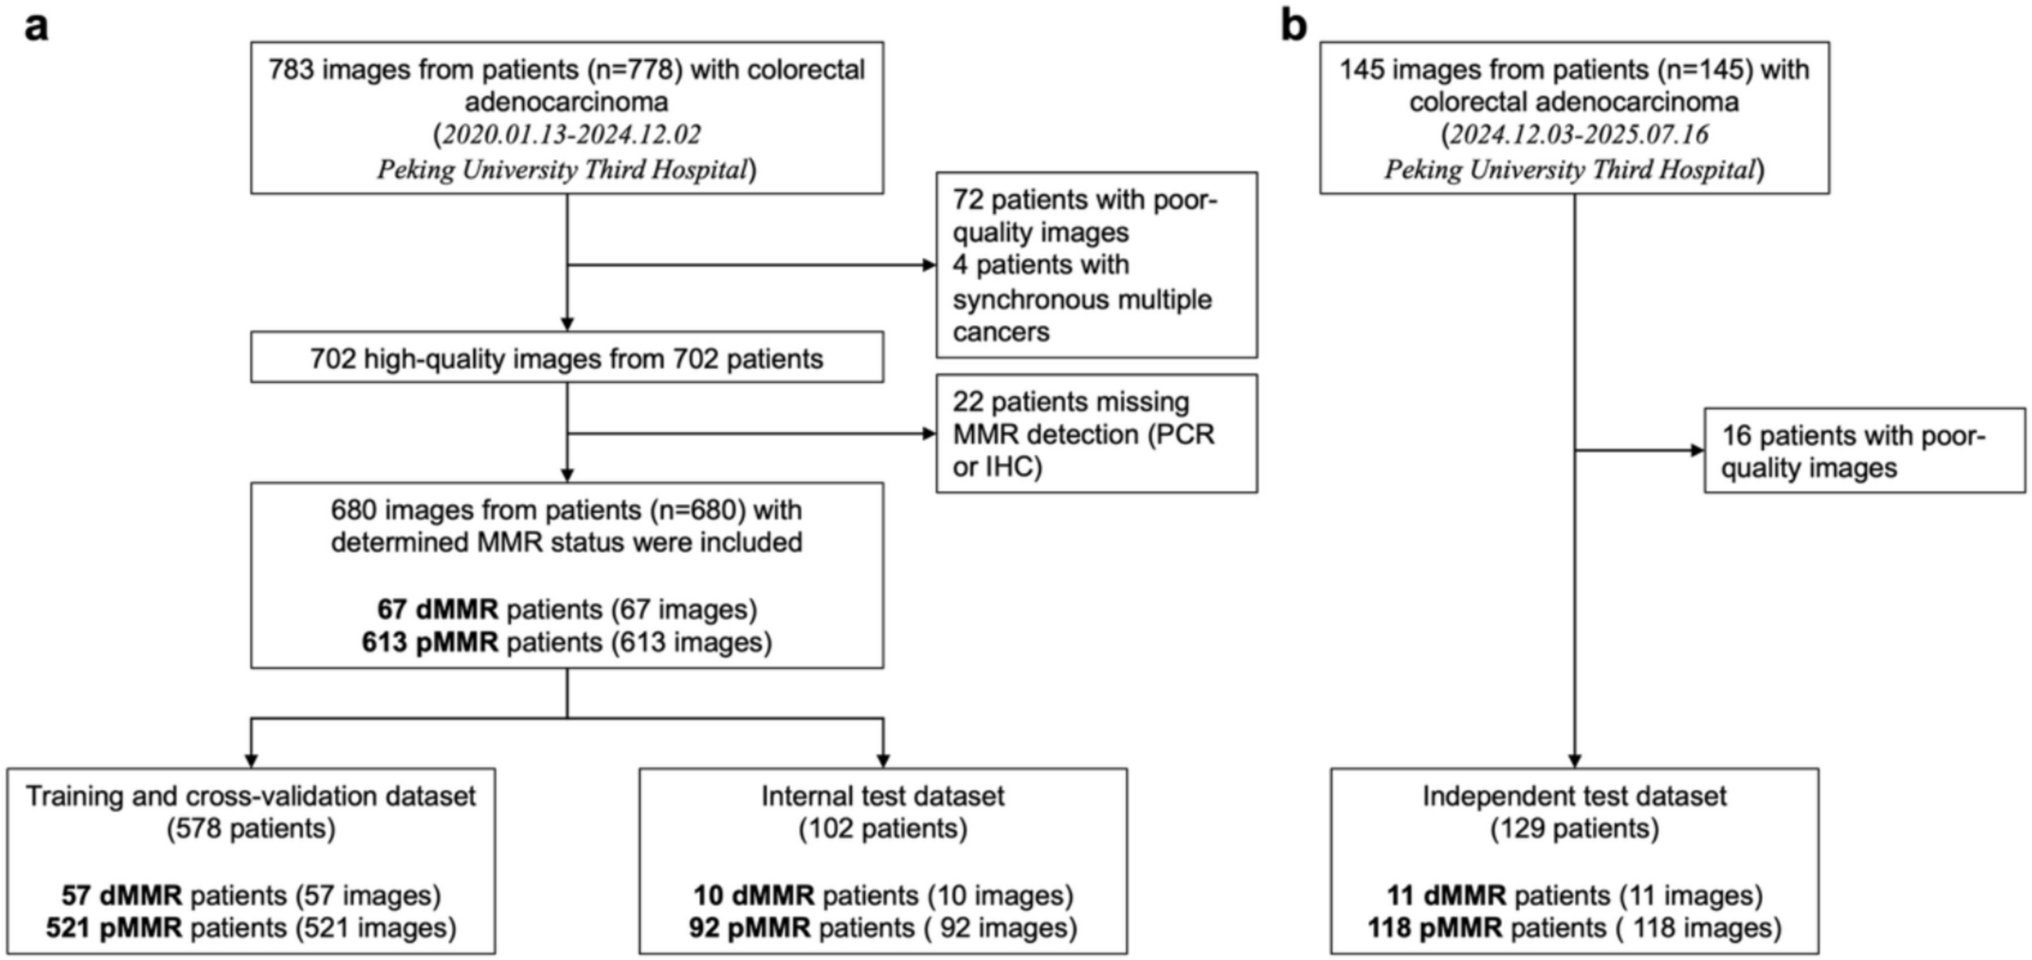
Our systematic search identified 312 records from the database(s). Following the removal of 97 duplicates, 215 unique records underwent title and abstract screening. Of these, 14 studies were deemed potentially eligible and proceeded to full-text retrieval and assessment. Ultimately, 6 studies [5, 9, 15,16,17,18] satisfied all inclusion criteria and were incorporated into the meta-analysis. The study selection process is detailed in the PRISMA flow diagram (Fig. 1).
Study characteristics and quality assessmentThree of the included studies were cross-sectional diagnostic accuracy studies, two were cohort studies and one was a prospective observational study. One study (Livanos et al. [15]) analyzed four independent cohorts, of which two met the inclusion criteria and were included in this analysis.
All six studies were found to be of high quality with low overall risk of bias, based on quality assessment via QUADAS-2. Aside from the patient selection domain, where three studies had unclear risk due to limited reporting, all studies demonstrated low risk in the remaining domains (index test, reference standard, and flow and timing). Figures 2 and 3 summarize the individual and domain-level risk of bias across included studies.
Fig. 2
QUADAS-2 risk of bias summary plot showing individual judgments across the four for each included study
Fig. 3
QUADAS-2 domain-level risk of bias bar chart summarizing the proportion of studies with low, high, or unclear risk of bias across each domain
Baseline characteristicsThis meta-analysis incorporated data from 3887 participants across the included studies. Among these, 1904 patients were diagnosed with ulcerative colitis (UC). UC cohorts demonstrated a consistent male predominance, with males representing 54% to 97% of UC patients in studies reporting gender. Control groups comprised healthy individuals (HC; reported in 5 studies) and patients with other gastrointestinal disorders (OGD; reported in 4 studies), predominantly Crohn’s disease. Age at the time of sample collection was reported in 5 studies, while age at UC diagnosis was reported in 4 studies. Where both were reported, the age at UC diagnosis was consistently lower than the age at sampling. Smoking status was infrequently reported across the studies (Table 1).
Diagnostic accuracy analysisIn the pooled analysis of six studies evaluating anti-integrin αvβ6 antibody accuracy for ulcerative colitis detection across all comparator groups, a bivariate random-effects meta-analysis model demonstrated an overall sensitivity of 83% (95% CI: 0.70–0.91; p < 0.001; I2 = 91%) and overall specificity of 93% (95% CI: 0.88–0.97; p < 0.001; I2 = 73%). The summary receiver operating characteristic (SROC) curve indicated robust discriminatory ability, with coherent confidence and prediction regions around the summary point. Forest plots and SROC curves for UC versus all controls are presented in Figs. 4 and 5, respectively.
Fig. 4
Forest plot of pooled sensitivity and specificity for anti-integrin αvβ6 antibodies in diagnosing ulcerative colitis versus all control groups
Fig. 5
SROC curve for anti-integrin αvβ6 antibodies in distinguishing ulcerative colitis from all control groups
Five studies were analyzed to evaluate the discriminatory capacity of anti-integrin αvβ6 antibodies for ulcerative colitis versus Crohn’s disease. UC was found to have a sensitivity of 83% (95% CI: 0.68–0.92; p < 0.001; I2 = 88%) and specificity of 81% (95% CI: 0.75–0.86; p < 0.001; I2 = 44%) when compared to CD. Similar to UC versus all controls, the SROC curve for UC versus CD showed good discriminatory powers. Further subgroup stratification revealed: when compared to healthy controls (2 studies), sensitivity was 82% (95% CI: 0.69–0.90) with specificity of 95% (95% CI: 0.88–0.98); while against all diseased cohorts (5 studies), sensitivity was 83% (95% CI: 0.73–0.90) with specificity of 91% (95% CI: 0.87–0.94) (Table 3). Forest plots and SROC curves for UC versus CD are presented in Figs. 6 and 7, respectively, while the forest plot for all subgroups is presented in Fig. 8.
Fig. 6
Forest plot of pooled sensitivity and specificity for anti-integrin αvβ6 antibodies in differentiating ulcerative colitis from Crohn’s disease
Fig. 7
SROC curve evaluating the diagnostic performance of anti-integrin αvβ6 antibodies in distinguishing ulcerative colitis from Crohn’s disease
Fig. 8
Forest plot of sensitivity and specificity across all comparator subgroups (healthy controls, diseased controls, and Crohn’s disease) for anti-integrin αvβ6 antibody performance
Table 3 Overall pooled sensitivity and specificity of αvβ6 antibody for differentiating ulcerative colitis (UC) from controls and from Crohn’s diseaseIndependent meta-regressionTo identify potential contributors to between-study heterogeneity in the diagnostic performance of the αvβ6 antibody for ulcerative colitis (UC), we first performed a series of independent meta-regression analyses, considering each covariate separately and in combination. Univariate meta-regression based on control group type (Table 4) revealed that specificity differed significantly across control subgroups (Wald χ2 = 11.03; df = 3; p = 0.0115), with the lowest specificity observed when Crohn’s disease was used as the comparator. However, relative sensitivity remained statistically similar across subgroups (χ2 = 0.18; p = 0.98), indicating that αvβ6 maintains stable sensitivity regardless of control group type.
Table 4 Relative diagnostic performance of αvβ6 antibody in differentiating ulcerative colitis from different control groups (healthy control as reference)We then conducted multivariable independent meta-regression models by pairing control type with either age group or region of study (Table 5). In the model adjusting for age, specificity was significantly affected by both control type (χ2 = 7.40; p = 0.01) and age group (χ2 = 27.30; p < 0.05), while sensitivity remained unaffected (p = 0.53). In the model adjusting for region, both control type (χ2 = 10.50; p = 0.01) and study region (χ2 = 27.17; p < 0.001) were again significant determinants of specificity. The full model incorporating both covariates further confirmed a robust association between these factors and variation in specificity (χ2 = 30.79; p < 0.001). These findings indicate that the diagnostic specificity of αvβ6 antibody is more sensitive to clinical context including population demographics and geographical setting than sensitivity.
Table 5 Multivariate independent meta-regression of αvβ6 diagnostic accuracy by type of control, age group, and region of studyBetween-study heterogeneity, evaluated using Tau2 and LR tests (Supplementary Table 1), also declined when multiple covariates were incorporated, supporting the role of age and region as modifiers of diagnostic accuracy. Specifically, the generalized Tau2 dropped from 0.15 in the univariate control-type model to 0.00 in both multivariate models, with corresponding reductions in Tau2 for specificity and sensitivity. This reduction suggests improved model fit and a partial explanation for observed heterogeneity.
Interaction meta-regressionTo further investigate whether the effects of covariates interact in modifying diagnostic accuracy, we conducted meta-regression models incorporating interaction terms between control type, age group, and region (Table 6). In univariate interaction analyses, neither the control*age nor control*region terms significantly influenced sensitivity or specificity. The interaction between control*age did not yield statistically significant Wald or LR test values for either outcome (Sensitivity: Wald χ2 = 0.00, p = 0.9632; LR test χ2 = 0.00, p = 0.99, Specificity: Wald χ2 = 0.00, p = 0.9632; LR test χ2 = 0.00, p = 0.99). The interaction between control*region showed borderline significance for specificity (Sensitivity: LR test χ2 = − 0.02, p = 1.00; Specificity: LR test χ2 = 3.48, p = 0.06).
Table 6 Interaction meta-regression of αvβ6 antibody accuracy by control type, age group, and regionIn the multivariable interaction model incorporating age, control, and region, interaction effects did not significantly influence sensitivity (All LR χ2 = 8.96, p = 0.18). However, for specificity, the joint inclusion of interaction terms significantly improved model fit (All LR χ2 = 37.39, p < 0.001), suggesting that specificity is influenced not only by main effects but also by combined demographic and geographic modifiers. Wald tests further indicated that age (χ2 = 4.93, p = 0.0264) and region (χ2 = 476.81, p < 0.001) were significant determinants of specificity. Residual heterogeneity was minimized in this full interaction model (τ2 = 0.00 for sensitivity; τ2 = 0.01 for specificity), with the LR test for heterogeneity (χ2 = 13.27, p = 0.0041) confirming improved fit. These findings indicate that variation in specificity is partly explained by higher order interactions, whereas sensitivity remains largely unaffected.
Post hoc analysis of cut-off and ELISA methodPost hoc analyses were conducted to assess whether threshold definitions or ELISA methodology accounted for variation in diagnostic performance (Table 7). When cut-off parameters were examined independently, sensitivity differed significantly across thresholds (χ2 = 4.31, p = 0.04), while specificity remained stable (χ2 = 0.25, p = 0.62). Pooled estimates showed that the 2SD threshold yielded a sensitivity of 0.65 (95% CI: 0.43–0.82) and specificity of 0.89 (95% CI: 0.74–0.96), whereas the 3SD threshold demonstrated higher sensitivity 0.87 (95% CI: 0.79–0.92) and comparable specificity 0.92 (95% CI: 0.85–0.95).
Table 7 Multivariate independent meta-regression of αvβ6 diagnostic accuracy by type of control, cut-off parameters, Elisa method and regionIn contrast, ELISA platform alone did not show significant associations with either sensitivity (χ2 = 0.21, p = 0.65) or specificity (χ2 = 1.30, p = 0.25). Descriptively, Kuwada-based assays had pooled sensitivity of 0.82 (95% CI: 0.72–0.90) and specificity of 0.92 (95% CI: 0.86–0.95), while non-Kuwada platforms (Okabe 2024) demonstrated slightly higher sensitivity 0.88 (95% CI: 0.58–0.97) but lower specificity 0.83 (95% CI: 0.59–0.94).
In multivariable models combining control type with cut-off parameters, sensitivity was no longer influenced by cut-off parameters (χ2 = 0.18, p = 0.98), whereas specificity varied significantly (χ2 = 25.26, p < 0.001). The full model confirmed this effect (χ2 = 25.51, p < 0.001). Similarly, when control type was modeled with ELISA method, specificity again differed significantly by platform (χ2 = 22.35, p < 0.001), while sensitivity remained unaffected (p = 0.98). Attempts to jointly model region and cut-off parameters failed to converge due to perfect collinearity, as all European studies exclusively applied +2SD or 95th percentile thresholds. However, when region and ELISA method were modeled together, region showed no significant effect on sensitivity (χ2 = 0.10, p = 0.75) or specificity (χ2 = 0.83, p = 0.36), whereas ELISA method remained significant for both sensitivity (χ2 = 6.48, p = 0.04) and specificity (χ2 = 7.22, p = 0.03). Importantly, residual heterogeneity decreased markedly in this model (generalized τ2 = 0.05 compared with τ2 = 0.27 in unadjusted ELISA models).
Taken together, these results indicate that apparent regional differences in specificity are largely explained by methodological factors, particularly the choice of assay platform and cut-off definition, while sensitivity remains robust across analytic specifications.
Comments (0)