2.1 Patient grouping and clinical tumor sample collection
Prior to surgery, breast cancer patients were stratified on the basis of their scores on the Hamilton Depression Scale (17-item version, HAMD-17) and the Hamilton Anxiety Scale (HAMA). Patients exhibiting scores ≥ 7 on both the HAMD-17 and HAMA were classified as having depressive symptoms. After the tumor tissue was removed during the operation, the tissue was rinsed with normal saline within 10 min in vitro to remove the blood and dirt on the surface of the tissue, and the tissue from nonstudy sites, such as adipose tissue, was removed. After the tissue was gently dried with sterile gauze, it was transferred into a prechilled cryogenic storage tube, rapidly frozen in liquid nitrogen, and subsequently stored at − 80 °C in an ultralow-temperature freezer. This experimental scheme was approved by the Ethics Committee of Guangdong Provincial Hospital of Chinese Medicine (Approval No. BF2019-120-04).
2.2 RNA sequencing
The total RNA from each sample was individually isolated via TRIzol reagent (Invitrogen) following standard extraction protocols. The synthesis of cDNA libraries was carried out via the VAHTS Universal V6 RNA-seq Library Preparation Kit for Illumina (Vazyme, Inc.) in accordance with the manufacturer’s guidelines. Library integrity and quality were verified using the Agilent 2200 system, and high-throughput sequencing was subsequently conducted on the DNBSEQ-T7 platform employing a 150-base pair paired-end read approach. The raw reads were processed to remove adapter sequences and low-quality reads, yielding clean reads for downstream analysis. These clean reads were aligned to the human reference genome (Ensembl release 109) using STAR. Gene-level quantification was performed using HTSeq to obtain read counts, and transcript expression was normalized using the reads per kilobase of transcript per million mapped reads (RPKM) approach. Difference analysis and enrichment analysis were performed via OmicShare Tools [20]. Additionally, protein–protein interaction (PPI) networks were analyzed via the STRING database (https://cn.string-db.org), and survival curve and immune infiltration analyses were performed using the Xiantao Academic bioinformatics tool (www.xiantao.love).
2.3 Immunofluorescence (IF)
The frozen tissue was embedded in optimal cutting temperature (OCT) solution and cut into 10 μm slices. The slices were immunostained with anti-IL-8 (1:200, Cat. #27095-1-AP, Proteintech, Hubei, China), anti-PCNA (1:200, Cat. #GB12010-100, Servicebio, Hubei, China), anti-Ki-67 (1:200, Cat. #28074-1-AP, Proteintech), anti-TROP2 (1:200, Cat. #GB111809-100, Servicebio), anti-F4/80 (1:200, Cat. #29414-1-AP, Proteintech), and anti-CD8 alpha (1:200, Cat. #GB15068-100, Servicebio) primary antibodies, followed by incubation with secondary antibodies. All the slices were subsequently stained with DAPI to label the nuclei. After three washes with TBST solution, the red or green fluorescence intensity was measured using a fluorescence microscope to quantify the protein content in the samples, and ImageJ was used for quantitative analysis.
2.4 Western blotting (WB)
In brief, fresh tumor tissue samples or cell cultures were first lysed in RIPA buffer. The lysates were then centrifuged at 12,000×g for 15 min at 4 °C. The protein concentration in the resulting supernatant was quantified using an enhanced BCA protein assay kit (Cat. #P0010S; Beyotime Biotechnology, Shanghai, China). Equal amounts of protein were subsequently separated by SDS‒PAGE and transferred to PVDF membranes (Cat. #GVHP04700; Merck KGaA, Darmstadt, Germany). The membranes were blocked with TBST containing 5% skim milk for 1 h, followed by incubation with the appropriate primary antibodies, including anti-IL-8 (1:1000, Cat. #27095-1-AP, Proteintech), anti-CXCR2 (1:1000, Cat. #GB115557-100, Servicebio), anti-CXCR1 (1:1000, Cat. #GB11625-100, Servicebio), anti-CXCL1 (1:1000, Cat. #30322-1-AP, Proteintech), anti-PI3K (1:1000, Cat. #67121-1-Ig, Proteintech), anti-AKT (1:1000, Cat. #10176-2-AP, Proteintech), anti-p-AKT (1:1000, Cat. #66444-1-Ig, Proteintech), and anti-GAPDH (1:1000, Cat. #60004-1-Ig, Proteintech). Subsequently, the membranes were incubated with the appropriate secondary antibodies (1:8000) for 60 min at room temperature. After three washes with TBST solution, protein signals were detected using Beyotime's hypersensitive ECL kit (Cat. #P0018S; Beyotime Biotechnology). The density of the protein bands was then quantified and documented using a gel imaging system (ChemiDox™; Bio-Rad, USA), and ImageJ was used for quantitative analysis. GAPDH was used as the loading control.
2.5 Mendelian randomization (MR) study design
Our experimental design follows a general two-sample MR design [21]. We utilized depression as an exposure factor. A diagnosis of breast cancer was considered the outcome of MR analysis. We sourced IL-8 gene eQTL data and breast cancer-related summary statistics (dataset ID: ukb-16890) from the GWAS repository maintained by the Integrative Epidemiology Unit (https://gwas.mrcieu.ac.uk/). All the statistical analyses were implemented in R (version 4.2.2) using the “TwoSampleMR” and “MR-PRESSO” packages. The key parameters of this study are set as follows: (1) genome-wide significance level at P < 5 × 10⁻⁸; (2) linkage disequilibrium clustering (r2 < 0.001, region size = 10,000 kb; and (3) F statistic > 10. Among the various analytical approaches, the inverse variance weighted (IVW) method serves as the primary estimator. A p value less than 0.05 was considered indicative of statistical significance.
2.6 Lentivirus establishment and transfection
As described previously [22], transduction with lentiviral vectors expressing CXCR1-specific shRNA or CXCR2-specific shRNA was used to knock down CXCR1 or CXCR2 expression, and the NCs were added to 6-well plates seeded with Py230 breast cancer cells. Py230 cells were treated 48 h after transfection, and the extent of the shRNA-mediated knockdown of CXCR1 or CXCR2 expression was evaluated using WB analysis.
2.7 Cell viability assessment
The cells were exposed to IL-8 (Cat. #K20584, Shanghai Yuanye Bio-Technology Co., Ltd., Shanghai, China) or senkyunolide H (Cat. #B21462, Shanghai Yuanye Bio-Technology Co., Ltd.) at the indicated concentrations for 48 h. The cells were then photographed under a microscope. Cell viability was evaluated via a methylthiazolyldiphenyl-tetrazolium bromide (MTT) assay (Cat. #V13154, Gibco, NY, USA). An automated microplate spectrophotometer (BioTek Instruments, Winooski, VT, USA) was used to determine the absorbance of each well at 490 nm.
2.8 Colony formation assay
The cells were seeded in 6-well plates (200 cells/well in 2000 μL) and cultured for approximately 14 days. Colonies with more than 50 cells per colony were treated with IL-8 or senkyunolide H for 48 h. Subsequently, the medium was removed, and the cells were washed twice with PBS. After the cells were fixed with 4% paraformaldehyde, the colonies were stained with Giemsa for 5 min, and pictures were taken to record the results.
2.9 Animal experiment and sample collection
Eighty female C57BL/6J mice, aged 8 weeks and weighing between 17 and 19 g, were obtained from Beijing HFK Bioscience Co., Ltd. (Beijing, China) for this study. In the figure, we present a schematic diagram of each part of the animal experiment. Chronic unpredictable mild stress (CUMS) group-associated mice were subjected to CUMS, including fasting, water fasting, tail clamping, restraint, diurnal reversal, tilting, wet bedding, and strobing, without the same stimuli on 2 consecutive days. After 4 weeks of CUMS, the mice were subcutaneously inoculated with Py230 breast cancer cells (1 × 10⁶ cells in 100 μL), and all the depression-modeling groups continued to receive CUMS. Senkyunolide H (7.5 mg/kg, administered intragastrically once a day for 28 days) was administered to the mice in the senkyunolide H-related group, and the same volume of saline was administered to the mice in the control group. The tumor volume was measured every 7 days, and the tumor size was calculated via the following formula: tumor volume = length × width2 × 1/2. After 28 days of treatment, the mice were anesthetized with pentobarbital (100 mg/kg, intraperitoneally) and euthanized by cervical dislocation. The tumor tissues were then collected for subsequent analysis. This experimental scheme was approved by the Laboratory Animal Ethics Committee of Guangdong Province Hospital of Chinese Medicine (Approval No. 2022079).
2.10 Behavioral assays2.10.1 Open field test
Each mouse was placed into a clean box (40 × 40 × 30 cm), and spontaneous locomotion was recorded using an infrared camera. A single test session lasted for 5 min under dim light. Movement track images and thermoimages were analyzed online. Data analysis was performed using EthoVision XT version 3.0 software (Noldus, Wageningen, Netherlands).
2.10.2 Elevated plus-maze
The experiment began by placing the mouse on the central platform (5 × 5 cm). During a 5-min test session, the animal was allowed to freely explore the arena, which included two open arms (30 × 5 × 0.5 cm) and two closed arms (30 × 5 × 15 cm) positioned opposite each other. The movement track images and thermoimages in each arm were analyzed using the EthoVision package.
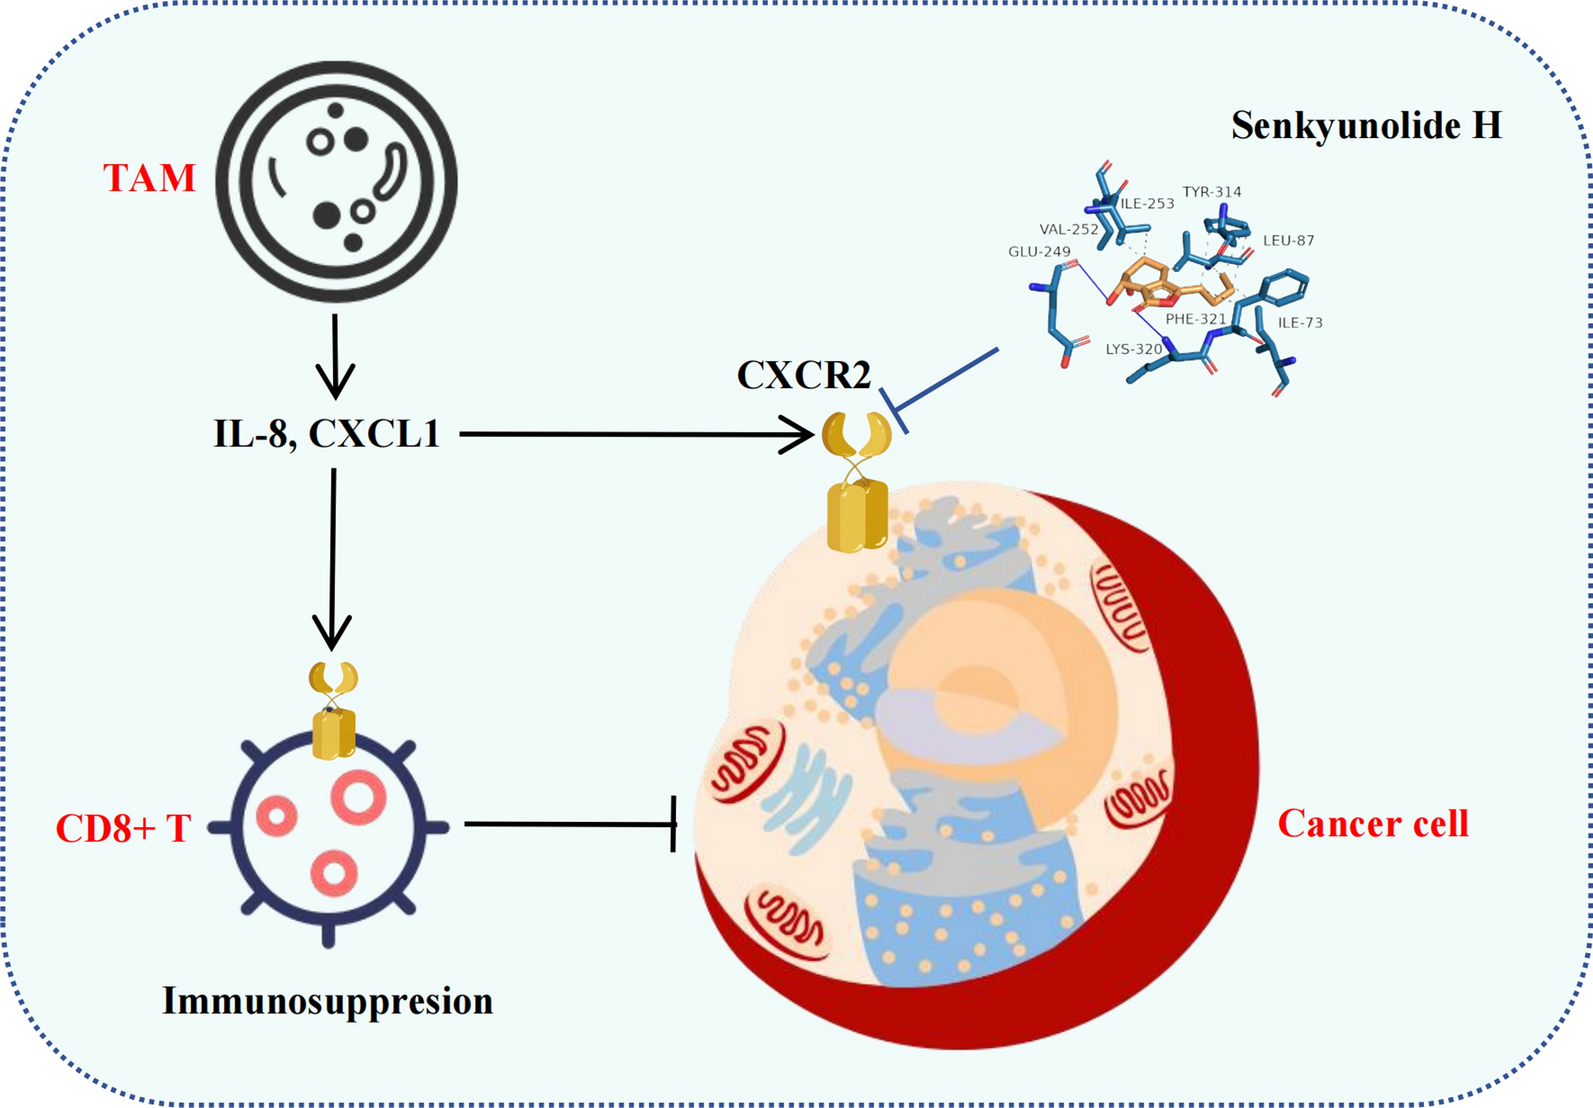
2.11 Molecular docking
The binding affinity between senkyunolide H and CXCR2 was validated by molecular docking. The 3D structure of senkyunolide H was obtained from the PubChem database. The CXCR2 protein (6lfl) structures acquired from the RCSB PDB database (https://www.rcsb.org) served as receptors. This structure was visualized separately using PyMOL, and subjected to dehydration, hydrogenation, and charge calculations using Mgtools (Version 1.5.6). Ligand and receptor structures were saved as pdbqt files. Subsequent molecular docking was performed utilizing AutoDock Vina (version 1.5.6), and the resulting higher-scoring conformations were visualized with PyMOL. The PLIP web tool (https://plip-tool.biotec.tu-dresden.de/plip-web/plip/index) facilitated the visualization of docking points.
2.12 Cellular thermal shift assay (CETSA)
Py230 cells were lysed by freezing and thawing three times in liquid nitrogen. The cell lysates were then divided into two aliquots: one served as the control, and the other was treated with senkyunolide H (40 μM) for 30 min at room temperature. The lysates were subsequently heated to the desired temperatures (57–73 °C) and cooled on ice. Protein bands were detected by Western blotting.
2.13 Flow cytometric analysis
To assess immune responses within the tumor microenvironment, flow cytometry was used to quantify CD8+ T cells. Additionally, the proportions of TNF-α-producing and IFN-γ-producing cells among the CD8+ T-cell subset were determined.
2.14 Statistical analysis
All the data are expressed as the means ± standard deviations. Statistical analysis was performed using SPSS 13.0 (SPSS Inc., Chicago, IL, USA), and graphical visualization was performed via GraphPad Prism 9 (GraphPad Software, LLC, California, USA). Data between two groups were compared using one-way analysis of variance (ANOVA), whereas repeated measures data were analyzed using repeated-measures ANOVA. A p value of < 0.05 was considered statistically significant.


Comments (0)