
Remember me


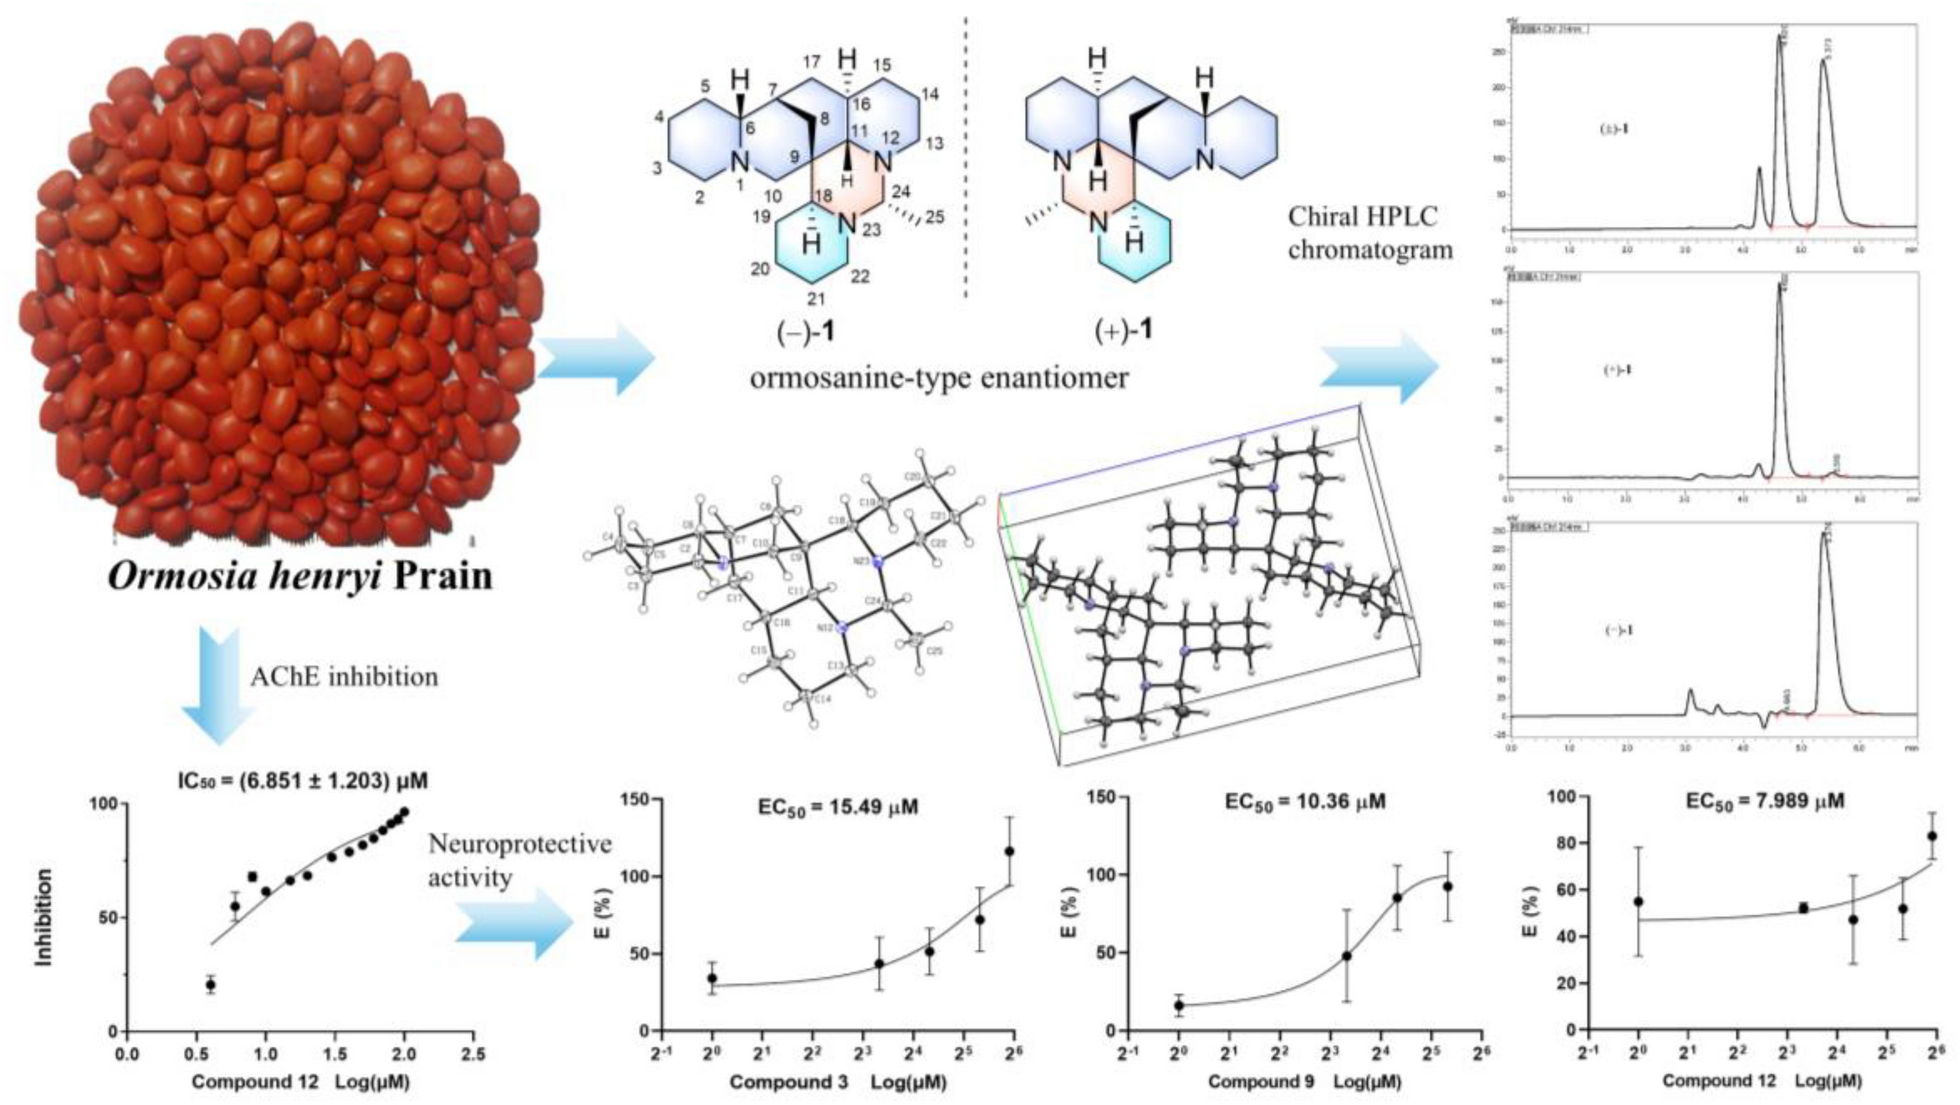
Compound 1 was isolated as colorless crystals. Its molecular formula was determined to be C22H37N3, with six double bond equivalents (DBEs), based on the HRESIMS ion [M + H]+ at m/z 344.3061 (calcd for 344.3065). The 1H NMR and 13C NMR spectrum (Tables 1 and 3) revealed 22 carbon signals for compound 1, consisting of a doublet methyl group [δH-25 1.23 (d, J = 5.5 Hz), δC-25 17.0], 14 methylenes, six methines, and a nonprotonated carbon (δC-9 37.3). The 1H-1H COSY spectrum displayed three spin–spin systems: H-2/H-3/H-4/H-5/H-6/H-7/H-17(H-8)/H-16/H-15(H-11)/H-14/H-13, H-18/H-19/H-20/H-21/H-22, and H-24/H-25 (Fig. 2A). HMBC correlations (Fig. 2A) from H-6 to C-2, C-5, C-8 and C-10 confirmed that rings A and B were fused via N-1 and C-6. Further HMBCs from H-11 to C-8, C-10, C-13, C-16, and C-17 indicated rings B and D were connected through ring C. Ring E was positioned adjacent to rings C and D, as evidenced by HMBC correlations of H-11/C-8, C-10, C-13, C-24, and H-24/C-13. The connectivity of ring F to ring E was corroborated by the HMBC cross-peaks of H-18/C-9, C-24, and H-22/C-24. The planar structure of 1 was closely related to the known ormosia-type quinolizidine alkaloid, homoormosanine [10]. The primary difference in their 1D NMR spectra between them was the presence of an additional doublet methyl (C-25) signal in 1, which was assignable to C-24 supported by the HMBC correlations from CH3-25 to C-24.
Table 1 1H NMR Spectroscopic Data (600 MHz) for 1–4 in CD3ODFig. 2
A 1H-1H COSYs (—) and selected HMBCs (→) of 1. B Key ROESY correlations (↔) of 1
The relative configuration of 1 was elucidated through analysis of its ROESY spectrum (Fig. 2B). Key cross-peaks of H-6/H-7, H-6/H-8β, H-8β/H-10β, H-15β/H-13β, H-13β/H-11, H-11/H-24, H-15β/H-17β suggested that these hydrogens, especially H-6, H-7, H-11, and H-24, were cofacial and arbitrarily assigned as β-orientation. The correlations of H-18/H-10β, H-18/H-8β, were observed, which suggested that these hydrogens were spatially nearby, especially inferred the α-orientation of H-18. The ROESY crosspeaks of H-18/H-22α, H-16/H-14α, H-16/H-17α, and H-13α/CH3-25 suggested that these hydrogens were α-orientated.
Compound 2 was obtained as colorless crystals. Its HRESIMS data exhibited the [M + H]+ ion peak at m/z 344.3062 (calcd for 344.3065), consistent with a molecular formula of C22H37N3. The molecular formula of compound 2, along with its hydrogen and carbon chemical shifts and the types of carbon atoms (Tables 1 and 3), are essentially the same as those of compound 1, which allows us to infer that the gross structure of compound 2 is similar to that of compound 1. The variations in some chemical shifts observed between them may be attributed to their differing stereoconfigurations.
The analysis of the relative configuration of compound 2 was hindered due to the overlapping proton signals of H-6, H-11, H-16, and other critical hydrogens in its ROESY spectrum. This overlap can complicate the determination of the relative configuration based solely on ROESY data (Fig. 3A). However, the configuration for compounds 1 and 2 were successfully determined through single-crystal X-ray diffraction experiments. Consequently, the structures with relative configurations of 1 and 2 were unambiguously determined as depicted in Figs. 4A and 5B. Further analysis of the X-ray data revealed that both 1 and 2 possessed a centrosymmetric space group P-1, which is indicative of their racemic nature (Figs. 4A, 5B, and Tables S1, S2). The optical values of zero for compounds 1 and 2 also implied that they were racemic mixtures. Fortunately, chiral separations of compounds 1 and 2 were successfully performed using Chiralpak columns, resulting in the isolation of their optically pure enantiomers (Figs. 6 and 7).
Fig. 3
Key ROESY correlations (↔) of 2 (A) and 3 (B)
Fig. 4
A X-ray crystal structure of 1. B Assembly of molecules of 1 in the crystals
Fig. 5
A X-ray crystal structure of 2. B Assembly of molecules of 2 in the crystals
Fig. 6
Chiral HPLC chromatogram of racemic 1 using a Chiralpak IE (IE00CE-SB022, 0.46 × 25 cm); isocratic elution with hexane/EtOH/DEA (80/20/0.1, v/v/v), flow rate 1 mL/min, UV detection at 214 nm
Fig. 7
Chiral HPLC chromatogram of racemic 2 using a Chiralpak IF (IF00CE-RL017, 0.46 × 25 cm); isocratic elution with MeOH/DEA (100/0.1, v/v), flow rate 1 mL/min, UV detection at 214 nm
Although the separation of racemates 1 and 2 was successfully achieved, pinpointing their absolute configurations remained a challenge owing to their lack of qualified crystals and chromophores in the molecules. It is well-documented that the calculation of specific rotation is a valuable technique for elucidating the absolute structure of chiral compounds [12]. Consequently, we proceeded to determine the specific rotations of the resulting chiral HPLC fractions. For 1, chiral HPLC fraction I at a retention time (tR) of 4.62 min exhibited a specific rotation of \([\alpha]_\text^\) + 55.0 (c 0.10, MeOH), whereas fraction II at tR = 5.37 min showed \([\alpha]_\text^\) − 55.0 (c 0.10, MeOH). Similarly, for 2, chiral HPLC fraction I at tR = 6.95 min had a specific rotation of \([\alpha]_\text^\) + 11.3 (c 0.10, MeOH), and fraction II at tR = 8.43 min exhibited \([\alpha]_\text^\) − 11.6 (c 0.10, MeOH). Density functional theory (DFT) calculations were conducted on the presumed absolute configurations of structures 1 and 2 on the left side as depicted in Fig. 1. These calculations yielded specific rotation values that were negative (for details, refer to the Supporting Information). The agreement between the observed and calculated specific rotation values confirmed the absolute configurations of the separated chiral HPLC fractions for compounds 1 and 2 (Figs. 1, 6, and 7), respectively.
Compound 3 was isolated as colorless crystals, and its molecular formula was determined to be C22H37N3 based on the HRESIMS data, which showed an [M + H]+ ion peak at m/z 344.3060 (calcd for 344.3065). The 1D NMR spectroscopic data (Tables 1 and 3) for 3 were consistent with those of 1, suggesting that 3 also shared the same planar structure as 1. The relative configuration of 3 was established as shown in Fig. 3B by ROESY correlations of H-2β/H-4, H-6/H-2β, H-6/H-10β, H-6/H-8β, H-10β/H-2β, H-10β/H-8β, H-8α/H-11, H-2α/H-10α, H-8α/H-18, H-8α/H-17β, H-18/H-11, H-18/H-24, H-18/H-22β, H-11/H-13β, H-13β/H-15β, H-11/H-15β, H-16/H-14α, H-17α/H-15α, CH3-25/H-13α. The absolute configuration of 3 was finally determined by single crystal X-ray diffraction analysis with CuKα radiation (Fig. 8). The Flack parameter of 0.04 (6) [13] established unambiguously the absolute configuration of 3 as 6R,7R,9S,11S,16R,18R,24R, and the compound was named ormohenin C.
Fig. 8
X-ray crystal structure of 3
Compound 4 was isolated as a yellowish oil. Its molecular formula was determined to be C22H35N3 with seven DBEs, based on the HRESIMS ion [M + H]+ at m/z 342.2898 (calcd for 342.2909). The NMR data (Tables 1 and 3) revealed 22 carbon signals, including four N-methylenes, four N-methines, a doublet methyl [δH-25 1.23 (d, J = 5.8 Hz), δC-25 16.1], and a nonprotonated carbon (δC-9 38.5). These features suggested that compound 4 is a structural congener of compounds 1–3. The primary distinction lies in the presence of an olefinic proton at δH-17 5.48, corresponding to a double bond (δC 129.0 and 134.5) in 4. The HMBC correlations (Fig. 9A) from H-17 to C-7, C-8, C-11, and C-15 assigned the Δ16,17 double bond. The 1H-1H COSY spectrum (Fig. 9A) also confirmed the Δ16,17 double bond and displayed three spin–spin systems: H-2/H-3/H-4/H-5/H-6/H-7/H-17(H-8)/H-16/H-15(H-11)/H-14/H-13, H-18/H-19/H-20/H-21/H-22, and H-24/H-25. The other HMBCs of H-7/C-5, H-6/C-5, H-6/C-10, H-4/C-6, H-2/C-6, H-10/C-2, H-10/C-6, H-10/C-9, H-10/C-8, H-10/C-11, H-13/C-11, H-13/C-14, H-18/C-11, H-18/C-19, H-22/C-18, H-24/C-11, H-24/C-18, H-24/C-13, and H-25/C-24 further determined the structure of 4 as shown. The relative configuration of 4 was established by key ROESY correlations (Fig. 9B) of H-8β/H-18α, H-8α/H-11β, H-6/H-2α, H-6/H-10α, H-7/CH2-5, H-10β/H-2β, H-10β/H-18, H-18/H-19α, H-18/H-20α, H-11/H-13β, H-19β/H-24, H-24/H-11β, H-24/H-13β, CH3-25/H-13α. The theoretical ECD spectrum of (6S,7R,9S,11S,18S,24R)-4 was in good accordance with its experimental ECD spectrum (Fig. 10A), which allowed its absolute configuration as 6S,7R,9S,11S,18S,24R. Consequently, compound 4 was designated as ormohenin D.
Fig. 9
A 1H-1H COSYs (—) and selected HMBC correlations (→) of 4. B Key ROESY correlations (↔) of 4
Fig. 10
Experimental ECD and calculated ECD spectra of compounds 4, 7, and 8
Compound 7 was isolated as a yellowish oil, with a molecular formula of C15H22N2O, as determined by HRESIMS from a quasi-molecular ion [M + H]+ at m/z 247.1799 (calcd for 247.1820), corresponding to six DBEs. The 1H NMR and 13C NMR spectra (Tables 2 and 3) revealed the presence of 15 carbon signals, consisting of eight methylenes, six methines [including two olefinic methines (δH-4 5.82 br d, J = 10.2 Hz, δC-4 123.3; δH-5 5.54 br d, J = 10.2 Hz, δC-5 125.6)], and an amide carbonyl at δC-2 170.0. The presence of these functional groups, along with the remaining four DBEs, suggested that 7 was a tetracyclic alkaloid [14].
Table 2 1H NMR Spectroscopic Data (600 MHz) for 7 and 8 in CD3ODTable 3 13C NMR Spectroscopic Data (150 MHz) for 1–4, 7 and 8 in CD3ODCompound 7 shared the same tetracyclic framework as α-isolupanine (11) [11], with the primary difference being the presence of olefinic signals in 7. The 1H-1H COSY spectrum confirmed the Δ4,5 double bond and displayed a spin–spin system of H-3/H-4/H-5/H-6/H-7/H-8(H-13)/H-9/H-11(H-10)/H-14/H-15/H-16/H-17 (Fig. 11A). HMBC correlations from olefinic proton at δH-4 5.82 to C-2 (δC 170.0) and C-3 (δC 32.4), and from the olefinic proton at δH-5 5.54 to C-3 (δC 32.4) and C-6 (δC 63.0), also indicated that this double bond was located between C-4 and C-5 (Fig. 11A). The relative configuration of 7 was established through analysis of its ROESY spectrum (Fig. 11B). Key ROESY correlations of H-5/H-7, H-6/H-7, H-6/H-8β, H-6/H-10β, CH2-10/H-9 suggested that H-6, H-7, H-8β, H-9, and H-10β were cofacial and arbitrarily assigned β-orientation. Additionally, correlations of H-10α/H-14α, H-11/H-8α, H-11/H-14β, H-11/H-13β, H-11/H-17β were observed, suggesting that H-11 were β-oriented. The absolute configuration of 7 was determined by the experimental ECD and calculated ECD spectra. The calculated ECD spectrum of (6R,7S,9S,11R)-7 matched very well with the experimental ECD spectrum (Fig. 10B). Therefore, compound 7 was identified as (6R,7S,9S,11R)-4,5-dehydro-α-isolupanine.
Fig. 11
A 1H-1H COSY (—) and selected HMBC correlations (→) of 7. B Key ROESY correlations (↔) of 7
Compound 8 emerged as a new natural constituent, isolated as yellowish oil. Its molecular formula was deduced to be C15H18N2O, supported by HR-ESI-MS data exhibiting a quasi-molecular ion [M + H]+ at m/z 243.1491 (calcd 243.1492). The 1D and 2D NMR spectroscopic data of 8 (Tables 2 and 3), including ROESY data, were found to be identical to those of a synthetic intermediate S5 [15], suggesting that both compounds share the same planar structure and relative configurations. The specific rotation of 8 was determined to be \([\alpha]_\text^\) + 57.5, which was in opposition to the synthetic intermediate S5 with a specific rotation of \([\alpha]_\text^\) − 100.8. This disparity in optical activity values indicated that 8 was the enantiomer of S5. In addition, comparison of the experimental ECD and calculated ECD spectra of 8 also supported the 7S,9S,11S-configuration (Fig. 10C). Consequently, compound 8 was named (7S, 9S, 11S)-15,16-dehydro-anagyrine.
Seven known alkaloids were also isolated. Compounds 5 and 6 were obtained as crystals and identified as enantiomers, as evidenced by their specific rotations of zero. By comparing their spectroscopic data and optical rotations with the reported data in the literatures, the structures of known ones were unambiguously identified as (±)-18-epiormosanine (5) [16,17,18], (±)-ormosanine (6) [10, 18], (+)-lupanine (9) [10], (+)-anagyrine (10) [19,20,21], (+)-α-isolupanine (11) [11], (+)-cytisine (12) [22], and (+)-N-methylcytisine (13) [22].
The first and the main class of drugs currently used for AD are the AChE inhibitors and are widely used for the symptomatic treatment of mild-moderate AD [2]. All alkaloids were screened toward AChE via improved Ellman’s method (Supporting Information). Compound 12 displayed significant AChE inhibitory activity, with an IC50 value of 6.851 ± 1.203 μM. Huperzine A was used as a positive control, with an IC50 value of 1.173 ± 0.223 μM.
Meanwhile, all isolated compounds were evaluated for their neuroprotective potency against the Aβ25-35 induced PC12 cell death by MTT assay. The result (Table 4 and Supporting Information) showed that compounds 3, 9, and 12 exhibited neuroprotective effects against Aβ25-35 induced PC12 cell damage. Among them, Compound 12 displayed the most neuroprotective activity, with an EC50 value of 7.99 μM. Resveratrol was used as a positive control [23], with an EC50 value of 5.99 μM.
Table 4 The neuroprotective effects of compounds 1–12 against Aβ25-35-induced cell damage in PC12 cells
Comments (0)