
Remember me


P. kingianum underwent a series of processes, including lipid removal, aqueous extraction, protein removal, depigmentation, dialysis, alcohol precipitation, and lyophilization to obtain P. kingianum polysaccharides (PKP), as depicted in Fig. 1a. During this process, the yield of PKP from P. kingianum was 4.3%, with a total polysaccharide recovery rate of 29.3%. PKP was initially purified using a Cellulose DE-52 column. As shown in Fig. 1b, it was observed that PKP mainly consisted of two components, which were subsequently named PKPI and PKPII. Due to its significantly higher content compared to PKPII, PKPI was further purified using a Sephadex G-50 column (Fig. 1c). This purification step resulted in a single peak, which was designated as PKP1. Since Fru was the dominant component in the monosaccharide analysis, Fru was used as the standard to develop a calibration curve [18] and as shown in Fig. S1. The purity of PKP1 was as high as 96%, meeting the requirements of the subsequent structural characterization and analysis.
Fig. 1
a Extraction process of P. kingianum polysaccharides. b Cellulose DE-52 column chromatography. c Sephadex G-50 column chromatography
3.2 Structural characterization of PKP13.2.1 SEM analysis of PKP1The PKP1 was examined using SEM, and the data were shown in Fig. 2. It could be observed that PKP1 exhibited a honeycomb structure with a relatively compact and smooth surface. Furthermore, it significantly increases its specific surface area due to the porous structure. Previous studies have indicated that the morphology of polysaccharides indirectly affects the properties of polysaccharides [19, 20]. The presence of pores and grooves on the surface of polysaccharides increased their specific surface area, exposing more hydroxyl groups that could form hydrogen bonds with water molecules, thus improving solubility. Therefore, the SEM data suggested better solubility for PKP1, consistent with our observation that it was easily dissolved in distilled water during experiments.
Fig. 2
SEM image of PKP1. a 200 × . b 1000 ×
3.2.2 Molecular weight and homogeneity of PKP1The molecular weight (Mw) and the homogeneity of PKP1 were measured using HPGPC, and the data were shown in Fig. 3a. It is evident from the HPGPC profile that PKP1 exhibited a single and symmetrical peak. The Mw of PKP1 was measured to be 5.3 × 10³ Da by employing the standard regression equation. In comparison with previously reported Mw of P. kingianum polysaccharides, such as 14.05 × 10³ Da and 8.7 × 10³ Da [20, 21], PKP1 displayed a lower Mw, which was speculated to result in better solubility. Furthermore, the polymer dispersity index (PDI) of PKP1, which was defined as the ratio of Mw/Mn, was calculated to be 1.20. A smaller PDI value suggested a narrower Mw distribution and better homogeneity [22], thus meeting the requirements for the subsequent structural analysis.
Fig. 3
a HPGPC curve of PKP1. b FT-IR spectra of PKP1. c TG and DTG curves of PKP1. d HPLC of PKP1 monosaccharide composition (without Fru). e HPLC of PKP1 monosaccharide composition (with Fru). f GC-MS profile of PKP1
3.2.3 FT-IR spectral analysis of PKP1The FT-IR data in Fig. 3b indicated that the peaks observed at 3390 cm−1, 2930 cm−1, and 1028 cm−1 corresponded to the stretching vibrations of O–H, C–H, and C–O bonds, respectively, representing characteristic absorption bands of classical polysaccharides. The peak observed at 1715 cm−1 was attributed to the stretching vibration of esterified carboxylate [23], while the peak at 1648 cm−1 originated from bound water within the polysaccharide structure [24]. The peak at 1400 cm−1 corresponded to the bending vibrations of C–H bonds [25], whereas the appearance of a peak at 1252 cm−1 indicated the vibrational modes associated with the O-acetyl group (–OAc). It was noteworthy that the absorption peaks at 935 cm−1 and 827 cm−1 were distinctive features indicative of β-D-Fru [23], which was consistent with monosaccharide composition results.
3.2.4 Thermal analysis of PKP1The thermal stability of PKP1 was characterized using thermogravimetric analysis (TGA). The thermogravimetry (TG) curve, which depicted the weight change pattern of the sample during the programmed heating, and the derivative thermogravimetry (DTG) curve, which indicated significant changes in the rate of sample mass loss at specific temperatures, were shown in Fig. 3c. Consequently, the TG curve of PKP1 exhibited a three-step degradation pattern, with two distinct mass losses occurring around 106 ℃ and 271 ℃, as revealed by the DTG curve. These were attributed to the loss of bound water in polysaccharides and depolymerization of the polysaccharide structure, respectively [26]. Consequently, these findings indicated that PKP1 exhibited thermal stability below 106 ℃.
3.2.5 Monosaccharide composition analysis of PKP1Previous studies have indicated that under conditions of high temperature and strong acidity, Fru readily undergoes conversion into Man and Glc. Moreover, due to its inherent structural properties, PMP becomes undetectable following PMP derivatization. Although reducing acid concentration can prevent Fru conversion, this compromises the complete hydrolysis of other monosaccharides [23, 27]. Therefore, the monosaccharide composition of PKP1 was determined using two HPLC methods: PMP-HPLC-PDA, characterized by high-concentration TFA and prolonged heating at high temperatures, and HPLC-RID, characterized by low-concentration TFA and a lower-temperature heating pretreatment. As anticipated, chromatographic analysis using PMP-HPLC-PDA (Fig. 3d) detected only Man, Glc, and trace amounts of Gal. In contrast, HPLC-RID (Fig. 3e) confirmed that the monosaccharides of this polysaccharide primarily consist of Fru and Glc, indicating that the Man detected via PMP-HPLC-PDA mainly originates from the conversion of Fru. Considering the specificity of Fru's presence, the actual Fru/Glc content ratio was subsequently determined by NMR analysis rather than by these two HPLC methods [11, 28]. Notably distinct differences were observed when comparing the monosaccharide compositions of P. kingianum polysaccharides reported in previous studies [14, 20, 21]. For instance, P. kingianum derived from Dali, Yunnan, exhibited a composition comprising Glc, Man, Gal A, Gal, Glc A, and Ara, whereas P. kingianum obtained from Ailao Mountain, Yunnan, consisted primarily of Fru, Gal, Gal A, and Glc.
3.2.6 Methylation analysis of PKP1Methylation of the polysaccharides, followed by hydrolysis and acetylation, combined with GC-MS analysis of the resulting products, proved to be a highly effective method for determining the sugar residues present in polysaccharides [14]. The GC spectrum was shown in Fig. 3f, while fragment data and the molar ratio of each sugar residue obtained from integrating the methylation product in GC were summarized in Table 1. The corresponding MS spectra were shown in the supporting information in Fig. S2. The fragment data in GC-MS indicated that PKP1 contained five distinct types of sugar residues, which were β-D-Fruf-(2 → , → 1)-β-D-Fruf-(2 → , → 2)-β-D-Fruf-(6 → , → 1)-α-D-Glcp-(6 → and → 1,2)-β-D-Fruf-(6 → , respectively [11, 29]. Among these residues, three sugar residues, including β-D-Fruf-(2 → , → 2)-β-D-Fruf-(6 → and → 1)-β-D-Fruf-(2 → , accounted for 72.16% of the molar ratio, suggesting their prominence as the major sugar residues. It is worth noting that the Man was not detected, confirming the results in monosaccharide composition analysis. Thus, PKP1 might be a novel Fru-dominated neutral polysaccharide. It has been reported that the reduction of methylated D-Fru resulted in the formation of D-mannitol and D-glucitol derivatives [28, 30], and Fru was susceptible to transformation during acidolysis as mentioned in Sect. 3.2.3; hence, their ratios could not be determined but will be resolved using NMR subsequently.
Table 1 Methylation mass spectrometry fragmentation analysis of PKP13.2.7 NMR analysis of PKP1To comprehensively elucidate the complete structure, the use of 1D/2D NMR, along with the results of monosaccharide composition and methylation, was necessary.
In the 13C NMR of PKP1 (Fig. 4b), two distinct sets of signals were observed in the anomeric carbon region at δ 90–110, indicating that PKP1 was mainly composed of two different types of monosaccharides. The results of monosaccharide composition and methylation indicated that PKP1 was predominantly composed of Fru. As ketoses lack anomeric hydrogen [28], no corresponding anomeric hydrogen was observed in the 1H NMR spectrum (Fig. 4a). Meanwhile, one set of the anomeric carbon signals at δ 104.07, δ 103.90, δ 103.75, and δ 103.27 exhibited significantly higher signal intensities and were consistent with the NMR characteristics of the carbon at 2-position in Fruf. Based on these findings along with previous studies [11, 31, 32], these singles were attributed to → 2)-β-D-Fruf-(6 → , → 1,2)-β-D-Fruf-(6 → , → β-D-Fruf-(2 → , and → 1)-β-D-Fruf-(2 → , and these sugar residues were named A, B, C, and D, respectively. Consequently, the anomeric carbon signal with lower intensity at δ 92.23 was attributed to α-configuration Glcp through comparison with published data [11, 29, 32]. Again, no obvious Man signals were detected.
Fig. 4
NMR spectrum of PKP1 (600 MHz, solvent D2O). a 1H NMR. b 13C NMR. c HSQC. d 1H-1H COSY. e HMBC
In the 1H NMR spectrum, the signal at δ 5.28 was assigned to the anomeric hydrogen of Glcp, which was further confirmed by the HSQC and 1H-1H COSY data (Fig. 4c, d), illustrating its correlation with a carbon signal at δ 92.23. These findings were corroborated by methylation analysis, confirming the existence of a fifth sugar residue, → 1)-α-D-Glcp-(6 → [11, 29, 32], with substitution occurring at its 6-position in the neo-ketose form [32]. This sugar residue was designated as E. Furthermore, the obvious relationships among A, B, C, D, and E were observed, indicating that these sugar residues were the fundamental units of the PKP1. The chemical shift signals for both 1H and 13C of A, B, C, D, and E were assigned, as shown in Table 2.
Table 2 NMR signal attribution of PKP1 glycosidic bondsDue to the susceptibility of Fru to degradation under harsh conditions, the ratios of peak areas and molar abundances in monosaccharide composition and methylation analyses were not reflective of the true ratios. Therefore, NMR signal integration was used to address this issue. The ratio of A, B, C, and D was determined by integrating the anomeric carbon signal of Fruf at the 2-position in 13C NMR [11], resulting in a ratio of 1.00: 3.09: 4.39: 16.48, respectively. Additionally, the ratio of Fruf to Glcp was determined by integrating the signals of H-3 on Fruf and H-1 on Glcp in 1H NMR, yielding a ratio of 27.86 to 1.00. Consequently, an approximate ratio of the five sugar residues A: B: C: D: E was calculated as 1:3:5:18:1.
The linkages of the sugar residues were determined by HMBC, and the data were shown in Fig. 4e. There were obvious correlations between H-1 of sugar residue D (δ 3.72) and C-2 of sugar residue C (δ 103.75), as well as H-1 of sugar residue B (δ 3.56) and C-2 of sugar residue D (δ 103.27), indicating the presence of β-D-Fruf-(2 → 1)-β-D-Fruf-(2 → and → 1)-β-D-Fruf-(2 → 1)-β-D-Fruf-(2,6 → linkages, respectively. Additionally, the correlations between H-6 of sugar residues A and B (δ 3.69) and C-2 of sugar residue C (δ 103.75), along with the relationship between H-6 of sugar residue B (δ 3.62) and C-2 of sugar residue A (δ 104.07), indicated the existence of β-D-Fruf-(2 → 6)-β-D-Fruf-(2 → , β-D-Fruf-(2 → 6)-β-D-Fruf-(1,2 → and → 6)-β-D-Fruf-(2 → 6)-β-D-Fruf-(1,2 → linkages within PKP1 structure. Furthermore, the correlation between H-1 of sugar residue D (δ 3.63) and C-2 of the same sugar residue D (δ 103.27) suggested that the sugar chain was extended through a → 1)-β-D-Fruf-(2 → 1)-β-D-Fruf-(2 → linkage within sugar residue D itself. In addition, a signal cross peak was observed near δ 103 between H-1 of sugar residue E and Fruf C-2 in HMBC [33]. Combining the above 1D/2D NMR analyses with the monosaccharide composition, FT-IR, and methylation results, the structure link of PKP1 was finally elucidated, as shown in Fig. 5. Notably, the inferred structure contained 28 monosaccharides, which closely match the Mw of PKP1 (5.3 × 10³ Da) determined by HPGPC. The relatively small PDI value further supported that PKP1 might exist as a polymer formed with this glycan chain serving as an independent monomer.
Fig. 5
Proposed structure of PKP1
Besides, there were still discernible weak signals, such as δ 1.90–2.10 in 1H NMR and δ 20.37 in 13C NMR. These signals exhibited characteristic features of –OAc groups and were further confirmed by the HSQC data [34]. However, no signal peaks associated with these signals were detected in NMR spectra, thus indicating that they could be attributed to impurities.
Therefore, in our study, a novel polysaccharide with a small PDI value was purified and elucidated. The main chain of this polysaccharide consisted of β-D-Fruf-(2 → , → 1,2)-β-D-Fruf-(6 → , → 1)-β-D-Fruf-(2 → and → 1)-α-D-Glcp-(6 → , while the side chain contained β-D-Fruf-(2 → and → 2)-β-D-Fruf-(6 → . Notably, these structural features differed from the previously reported P. kingianum polysaccharides, thereby expanding the structural diversity within this study.
3.3 Anti-inflammatory activity3.3.1 Effects of PKP1 and LPS on cell viability in LPS-induced RAW264.7 macrophagesThe anti-inflammatory activity of PKP1 was initially evaluated using LPS-induced RAW264.7 macrophages to assess its biological activities. Cell viability served as the basis for immune activation and as an indicator of drug cytotoxicity. As shown in Fig. 6a, PKP1 demonstrated over 98% cell viability within the concentration range of 100–800 μg/mL, exhibiting no significant variation among these concentrations compared to the normal group. Furthermore, as depicted in Fig. 6b, when combined with a 1 μg/mL LPS solution, PKP1 at concentrations of 200–800 μg/mL exhibited a slight increase in cell survival rate compared to the normal group. This observation indicated that the combined action of PKP1 with 1 μg/mL LPS on the RAW264.7 macrophages was non-cytotoxic, thereby enabling subsequent studies.
Fig. 6
Effects of PKP1 on LPS-induced RAW264.7 macrophages. a Effects of PKP1 on cell viability. b Effects of PKP1 + LPS on cell viability. c NO levels. d IL-6 levels. e TNF-α levels. Statistical differences between groups were evaluated using one-way ANOVA, followed by Tukeys post-hoc test, and a p-value < 0.05 was considered statistically significant. Values are shown as mean ± SD. Values sharing a common letter (a, b, c, d, and e) in each row indicate no statistical significance between each group
3.3.2 Effects of PKP1 on inflammatory factor levels in LPS-induced RAW264.7 macrophagesInflammatory factors are one of the important factors inducing insulin resistance (IR). By alleviating the inflammatory response, the production of inflammatory factors can be inhibited, thereby reducing IR and indirectly improving glycolipid metabolism [35]. The effects of PKP1 on reducing the levels of inflammatory factors in LPS-induced RAW264.7 macrophages were measured, and the data were presented in Fig. 6c, d, and e. The levels of NO, IL-6, and TNF-α were significantly increased in LPS-induced RAW264.7 macrophages; however, their levels were significantly reduced upon administration of PKP1. Specifically, when the PKP1 concentration was 800 μg/mL, the levels of NO, IL-6, and TNF-α were reduced by 37.10%, 38.44%, and 29.08%, respectively, compared with the LPS group. These findings indicated the anti-inflammatory activities of PKP1.
3.4 PKP1 regulates gut microbial structure and function in vitro3.4.1 Effects of PKP1 on the structure of gut microbial in vitroWe subsequently assessed the impact of PKP1 on the regulation of gut microbiota in vitro. Utilizing our previously established in vitro gut microbiota model derived from diabetic mice [17], the effects of PKP1 on the structure of gut microbiota were also measured, as shown in Fig. 7. At the phylum level (Fig. 7a), the relative abundance of Actinobacteriota (Fig. 7a1), which was considered to play a crucial role in maintaining intestinal homeostasis [36], increased in the administered group, especially the LP group. Conversely, in both the LP group and HP group, the relative abundances of Campilobacterota (Fig. 7a2), Deferribacterota (Fig. 7a3), and Desulfobacterota (Fig. 7a4), which were correlated with abdominal pain, diarrhea, intestinal cell damage, and acute enteritis [37], all decreased. Previous studies have indicated that Deferribacterota and Desulfobacterota are positively correlated with body weight and lipid levels in high-fat diet model mice [38]. Therefore, our data hint at a potential effect of PKP1 on reducing body weight. At the genus level (Fig. 7b), the relative abundance of beneficial genera Bifidobacterium (Fig. 7b1) and Faecalibacterium (Fig. 7b2) recognized as probiotics for alleviating diabetes mellitus and metabolic syndrome [39, 40], increased in the administered group. In contrast, the abundance of harmful genera Oscillibacter (Fig. 7b3), Lachnoclostridium (Fig. 7b4), Rikenellaceae_RC9_gut_group (Fig. 7b5), and Clostridium_sensu_stricto_1 (Fig. 7b6), which were positively correlated with diabetes [41,42,43], all decreased, especially the HP group. These findings indicated the beneficial effects of PKP1 on the treatment of diabetes mellitus.
Fig. 7
Effects of PKP1 on the structure of gut microbial in vitro. a Histogram of intergroup species composition at the phylum level. a1-4 Relative abundance of phylum Actinobacteriota, Campilobacterota, Deferribacterota, Desulfobacterota. b Heatmap of intergroup species clustering at the genus level. b1-6 Relative abundance of genus Bifidobacterium, Faecalibacterium, Oscillibacter, Lachnoclostridium, Rikenellaceae_RC9_gut_group, Clostridium_sensu_stricto_1
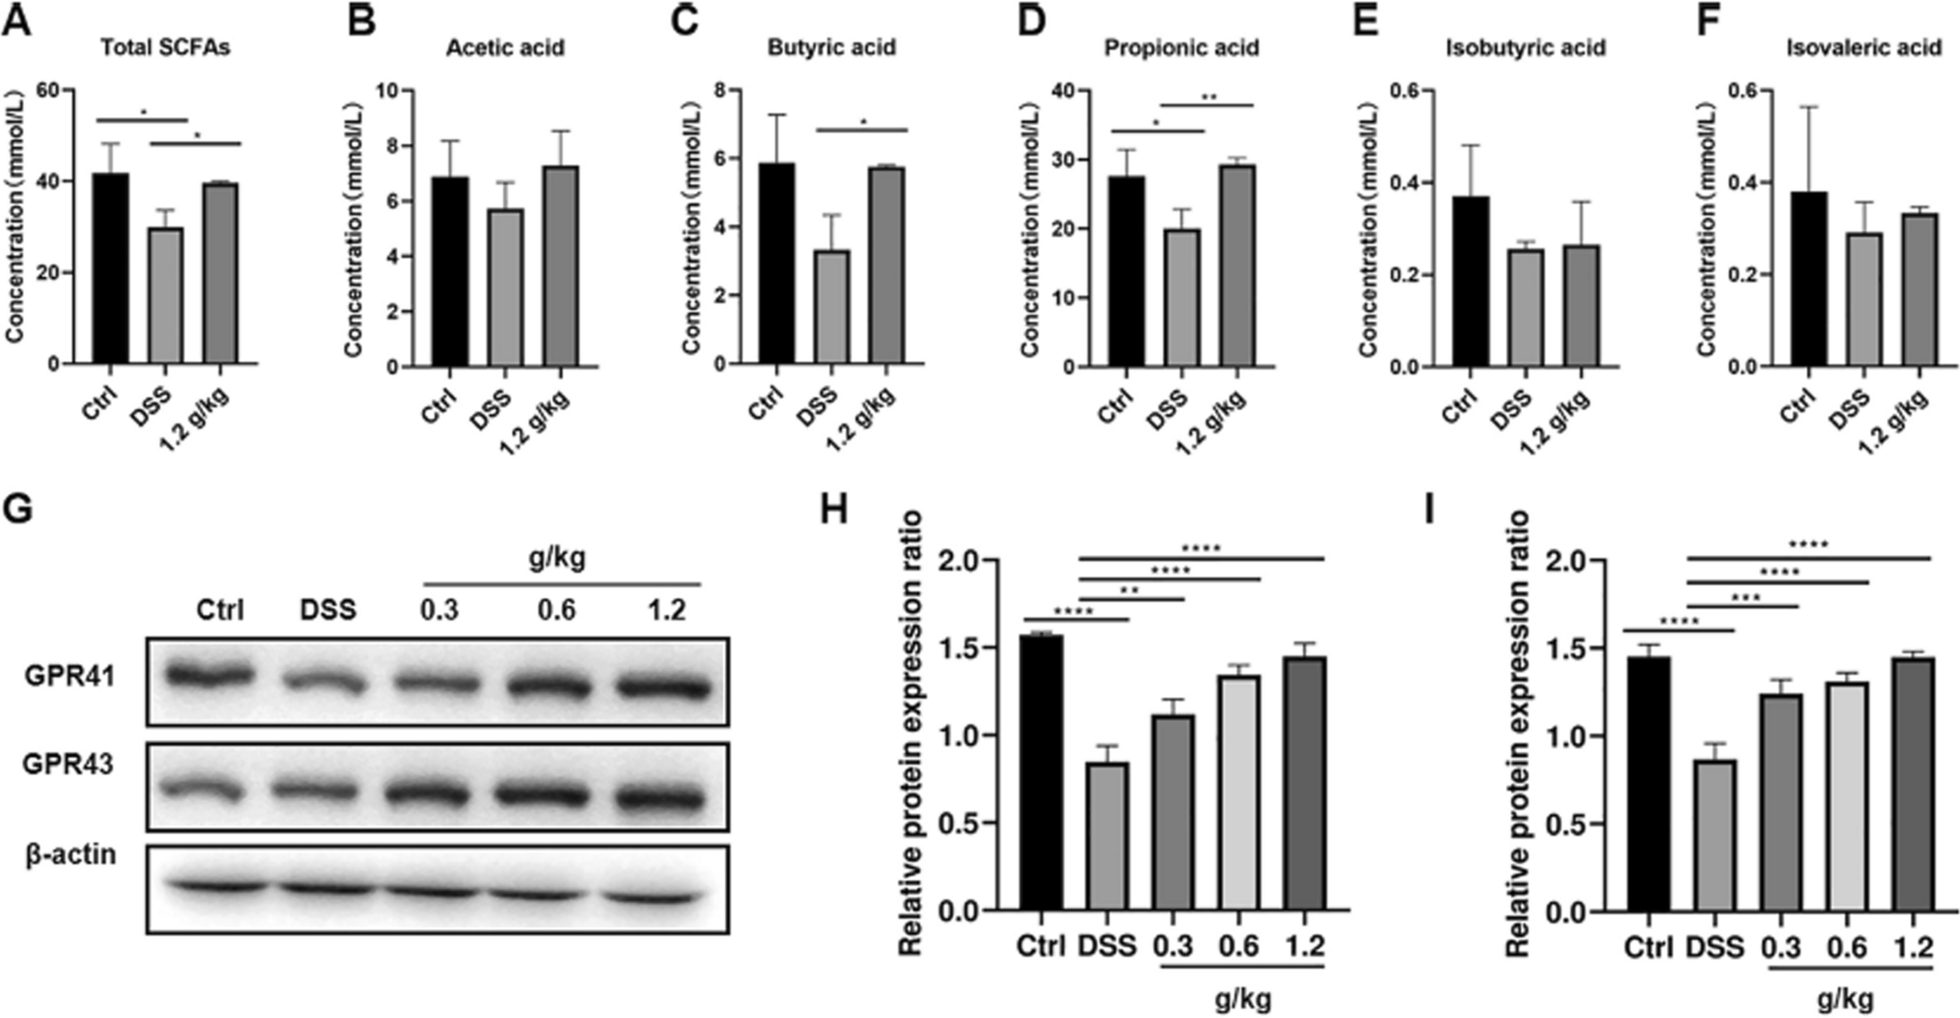
3.4.2 Effects of PKP1 on metabolite SCFAs levels in vitroTo further investigate the regulatory mechanism of PKP1 on gut microbiota [44], the SCFA levels in the diabetic mice gut microbiota were also measured, as depicted in Fig. 8. Consequently, the levels of all four types of SCFAs were significantly reduced in the MD group, while these SCFAs in both the LP group and HP group significantly increased following PKP1 intervention. Especially when PKP1 was added at 1%, the levels of acetic acid, propionic acid, isobutyric acid, and butyric acid were increased by 43.75%, 41.67%, 72.73%, and 278%, respectively, compared with the MD group (Table S1). It was worth noting that the levels of acetic acid and butyric acid increased in a dose-dependent manner. In the structural analysis of gut microbiota in vitro, the relative abundances of Oscillibacter and Lachnoclostridium were reduced, while the relative abundances of Bifidobacterium and Faecalibacterium increased after PKP1 administration. The former two gut bacteria exhibited negative correlations with SCFA levels, whereas the latter two demonstrated positive correlations. Therefore, our findings revealed that PKP1 increased the levels of SCFAs by regulating the gut microbiota composition.
Fig. 8
Comments (0)