
Remember me


The cohort consisted of 70 neuropathologically confirmed MSA donors, of which 43 (61%) were striatum-predominant, 18 (26%) were cerebellum-predominant, and 9 (13%) showed no clear predominant subtype. Clinical and neuropathological characteristics of striatum-predominant and cerebellum-predominant MSA subtypes are summarized in Online Resource 1, part 7.
Fourteen out of 70 donors (20%) were classified as mixed MSA + AD, of which two donors (#13 and #21, see Online Resource 1, part 1) exhibited a Thal Aβ phase of 4, with a corresponding Braak NFT stage of 1. Braak α-syn, MSA-SND, MSA-OPCA, and TDP-LATE stage were similar in pure MSA and mixed MSA + AD cases (Table 1). Age at onset (70 ± 7 vs. 58 ± 8) and age at death (75 ± 7 vs. 64 ± 7) were significantly higher in mixed MSA + AD than in pure MSA donors (p < 0.001) (Table 2). Estimated Hoehn and Yahr scores from the year before death were high (stage 4 or 5) and disease duration was similar (5 ± 2 vs. 6 ± 3) in both groups. Cognitive impairment, reflected by higher CDR scores, was more common in mixed MSA + AD (50% with CDR ≥ 1) than in pure MSA (7% with CDR ≥ 1; p < 0.001) cases. The prevalence of parkinsonism, cerebellar symptoms, autonomic dysfunction, hallucinations, depressed mood, RBD, and levodopa responsiveness did not differ between groups. Pathologically, most donors showed overlapping striatonigral degeneration and olivopontocerebellar changes. Only three individuals had isolated striatonigral degeneration without olivopontocerebellar involvement; these cases all had relatively rapid disease courses (3–4 years), and two deceased from respiratory complications.
Table 1 Neuropathological stages and APOE-ε4 genotype of study cohortTable 2 Clinical features of study cohortReduced diagnostic sensitivity in mixed MSA+AD donors and late−onset MSAThe overall clinical diagnostic sensitivity in this neuropathologically confirmed MSA cohort indicates that 81% of the donors received an MSA diagnosis during life (Fig. 1). A clinical MSA-P diagnosis corresponded with striatum-predominant MSA pathology in 92%, while only 51% of all striatum-predominant MSA cases were classified as MSA-P during life. A clinical MSA-C diagnosis corresponded with cerebellum-predominant MSA pathology in 69% of the cases, but only 50% of cerebellum-predominant MSA donors were clinically recognized as MSA-C. When the clinical MSA subtype was not specified, donors had striatum-predominant (50%), cerebellum-predominant (35%), or mixed striatum = cerebellum (15%) pathology (Table 3).
Fig. 1
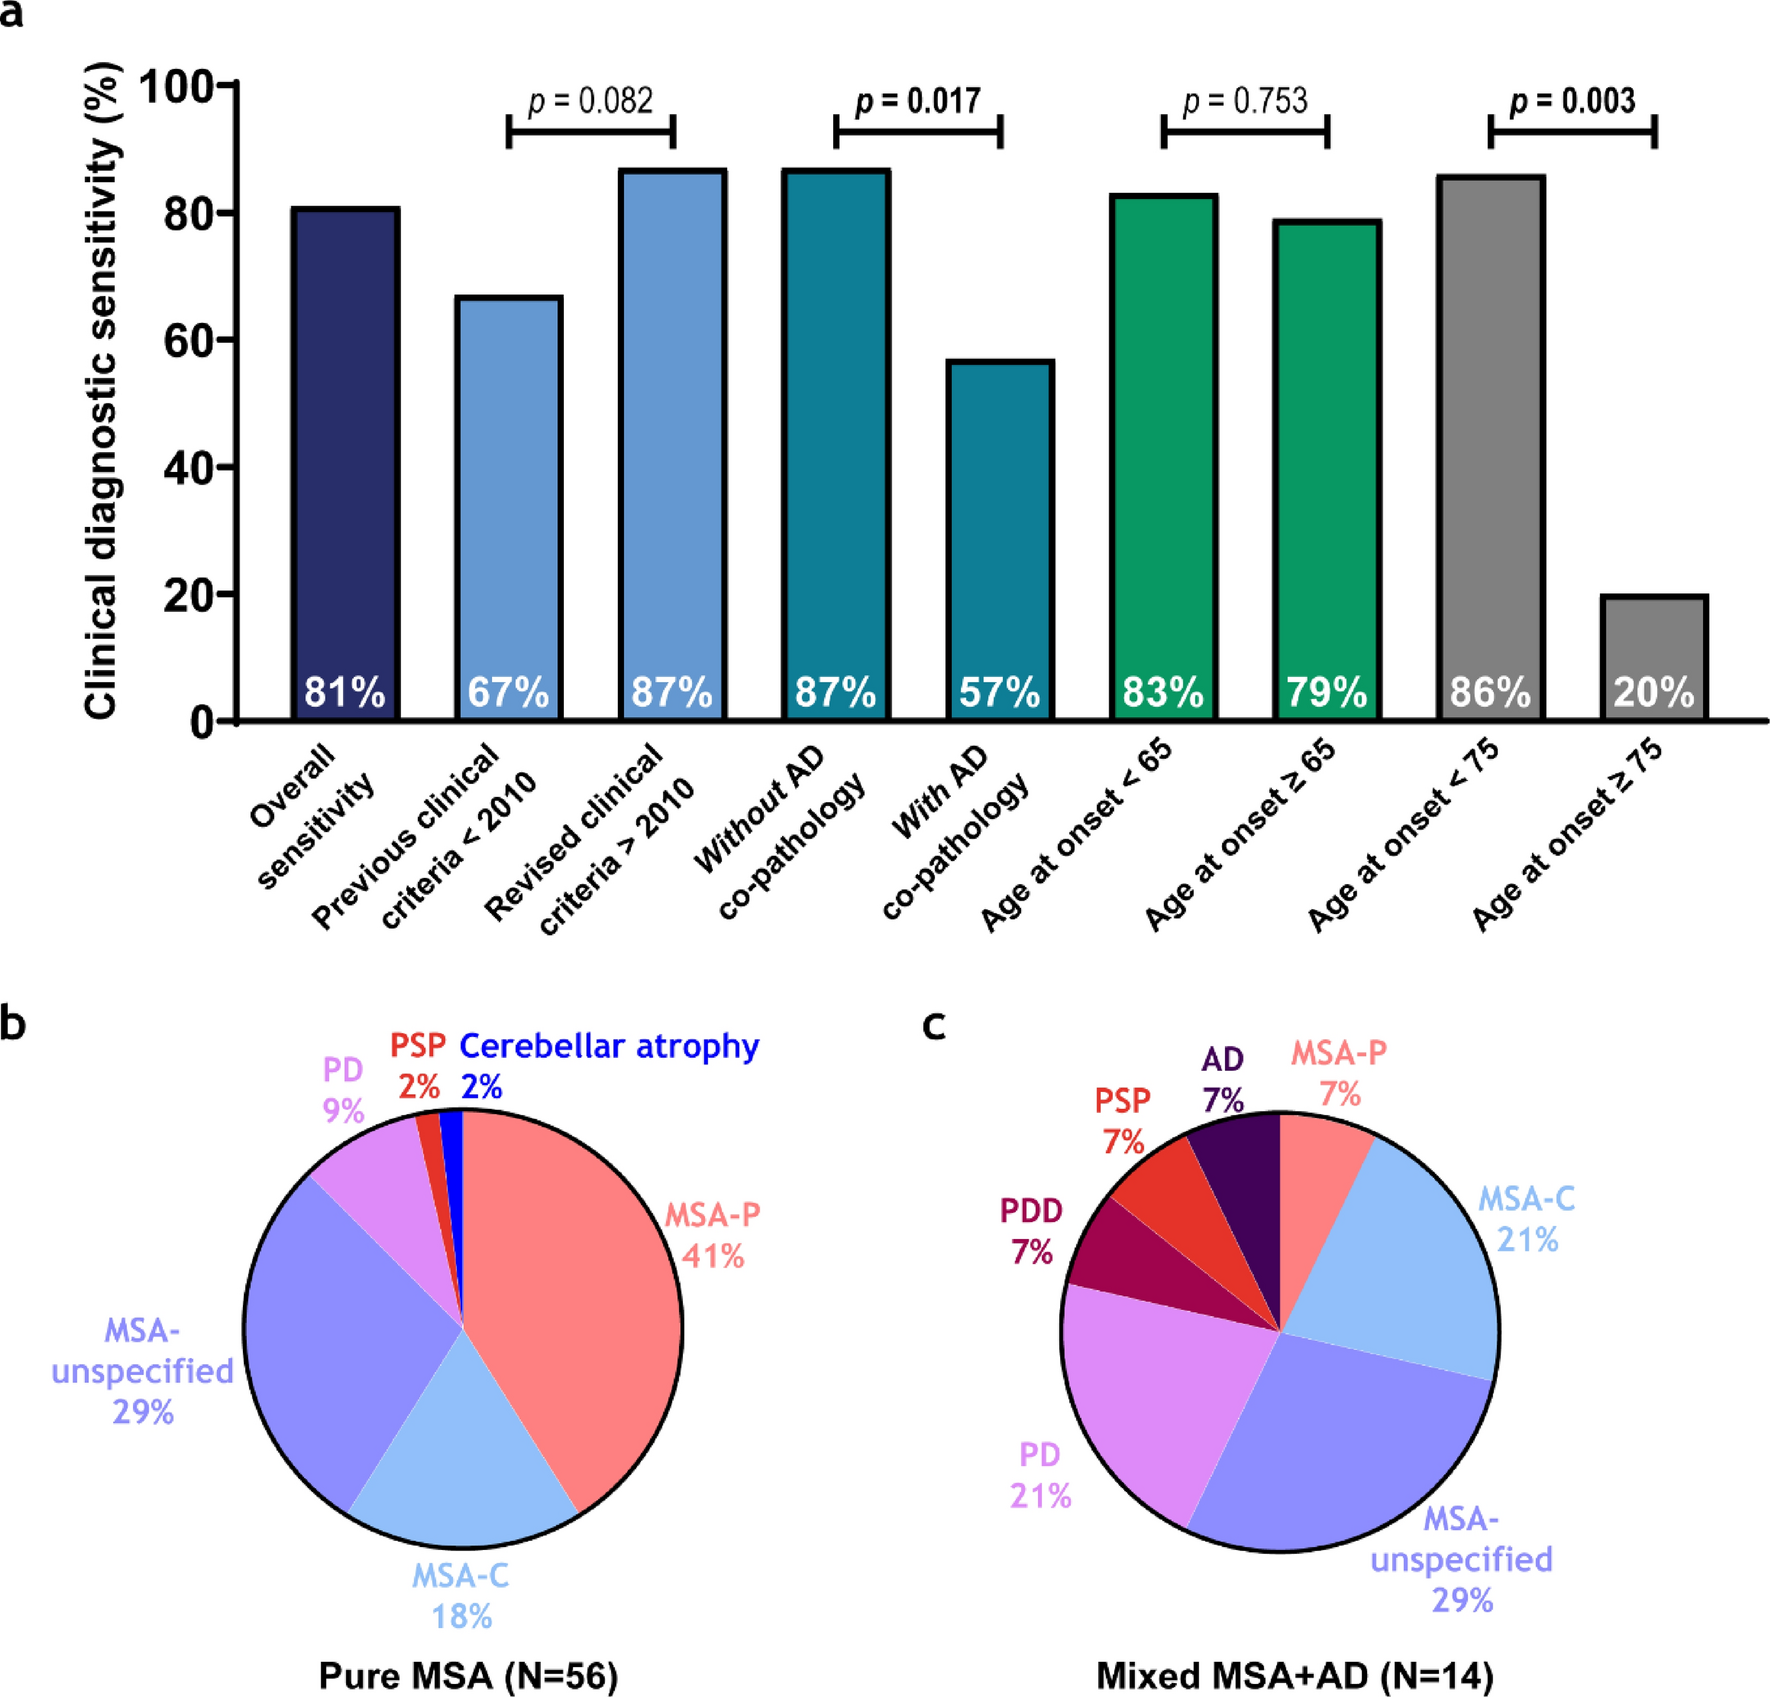
Diagnostic sensitivity is lower in mixed MSA + AD donors and late MSA disease onset. a Diagnostic sensitivity is visualized in a bar chart and represents the percentage of neuropathologically MSA donors that received a clinical antemortem MSA diagnosis. Diagnostic sensitivity is represented in each bar for overall sensitivity, before and after the revised MDS criteria [6], without and with AD co-pathology, for age at onset of MSA < 65 and ≥ 65 years of age, and for age at onset of MSA < 75 and ≥ 75 years of age, respectively. Groups were compared using a Fisher’s exact test for categorical variables. p values represent the differences between bars of the same color, p values in bold survived FDR correction. b,c Pie charts show final clinical antemortem diagnoses in pure MSA (b) and mixed MSA + AD (c)
Table 3 Correspondence between clinical MSA subtype and neuropathological confirmationTo assess potential changes in diagnostic practices over time, clinical diagnoses before and after 2010 were compared, allowing a two-year window for the adoption of revised clinical MSA criteria published in 2008 [6]. Sensitivity increased from 67 to 87% although this difference did not reach statistical significance (p = 0.082) (Fig. 1a). Diagnostic sensitivity was lower in donors with mixed MSA + AD pathology (57%), compared to those with pure MSA pathology (87%; p = 0.017). When we examined associations between diagnostic sensitivity and clinical outcomes, only age at death was significant (r = 0.35, p = 0.012); no associations were found with age at onset, disease duration, CDR score, or APOE-ε4. Among mixed MSA + AD donors, the clinical diagnoses included PD (21%), PDD, PSP, and AD (7% each). In pure MSA, the clinical diagnoses were PD (9%), PSP and cerebellar atrophy (2% each) (Fig. 1b).
A previous study reported reduced diagnostic sensitivity in late‐onset MSA using an age‐at‐onset threshold of 75 years [9]. In our cohort, application of this same cut‐off (n < 75 years = 65 vs. ≥ 75 years = 5) resulted in a decline in sensitivity from 86 to 20% (p = 0.003). To determine whether a more modest increase above the cohort mean onset age (60 years) would similarly affect diagnostic performance, we also evaluated a threshold of 65 years (n < 65 years = 46 vs. ≥ 65 years = 24), which revealed no significant change in sensitivity (p = 0.75) (see Fig. 1a). This data indicates that only very late‐onset disease (≥ 75 years) is associated with a substantial loss of diagnostic accuracy in MSA.
Heterogeneity of proteinopathiesMorphologically, α-syn pathology displayed distinct regional profiles, with prominent GCIs in the EntC, a high diversity of morphological structures in the amygdala, including GCIs, neuronal inclusions and neurites, and a high density of both GCIs and neuronal inclusions in CA2 with moderate density in other CA regions (Fig. 2a-c). In the DG, α-syn pathology was more selective, with ring-shaped neuronal inclusions concentrated in the granule cell layer (Fig. 2d). Interestingly, 8 donors (#2, 4, 9, 14, 21, 51, 61, 68, see Online Resource 1, part 1) showed distinct α-syn pathology shaped like clustered neurites in the amygdala (Fig. 2q-s). In one donor, this type of α-syn pathology in the amygdala was extensive and was also observed in CA3 + 4 (#51) (Fig. 2t). Among these 8 donors, no clear patterns or differences in phenotype regarding age, Braak α-syn, Braak NFT, Thal Aβ, SND, OPCA, TDP-LATE, CAA, CERAD, ARTAG stage, or APOE status were found when compared to donors without this type of α-syn clusters in the amygdala.
Fig. 2
Regional patterns of α-syn, Aβ, and p-tau pathology in limbic regions in MSA. Representative images of α-syn (a-d, q-t), Aβ (e-i), p-tau (j-m), and pTDP-43 (n-p) across the EntC, amygdala, CA, and DG. a α-Syn pathology in the EntC is characterized by prominent GCIs (indicated by ^). b In the amygdala, α-syn pathology is heterogeneous, with a mixture of GCIs (^), neuronal inclusions (*) and α-syn neurites (not in this image). c α-Syn in CA regions, of which CA3 + 4 is depicted here, demonstrating both GCIs (^) and NCIs (*), while DG (d) contains mostly ring-shaped NCIs (*) and some diffuse NCIs ( ~) localized to the granule cell layer. e Aβ pathology is extensive in the EntC, with predominance of diffuse plaques (indicated by ^). f,g Besides diffuse plaques (^), the amygdala shows a high burden of compact ( ~) and classic-cored (*) plaques. In contrast, CA regions, of which CA1 is shown here, exhibit only sparse diffuse plaques (^) (h), and the DG is minimally affected, with a small number of diffuse (^) and some compact plaques (not in this image) surrounding the granule cell layer (i). p-Tau aggregates are mainly observed as threads (indicated by ~) and some NFTs (*) in the EntC (j) and amygdala (k), with relatively less NFTs compared to the other limbic regions. l CA1-4, of which CA3 + 4 is shown here, is characterized by widespread mature NFTs (*) and pretangles (^). m In DG mainly pretangles (^) were observed. n-p Examples of the sparse cytoplasmic pTDP-43 inclusions that were observed in the EntC (n), amygdala (o) and CA1 (p). q-s Examples of the distinct clusters of α-syn neurites that were observed in the amygdala of 8 donors (#2,4,9,14,21,51,61,68; donor #51 is shown in q + r, donor #2 in s) and in CA3 + 4 of 1 donor (donor #51). Scale bar in all images represents 100 µm
Aβ plaques were most pronounced in the EntC and amygdala, manifesting primarily as diffuse plaques in the EntC with an addition of compact and classic-cored plaques in the amygdala (Fig. 2e-g). The CA regions and DG showed limited Aβ pathology, consisting mainly of diffuse and occasionally compact plaques (Fig. 2h, i). p-Tau pathology appeared primarily as threads in both the EntC and the amygdala, with tangles present but less frequently than the thread pathology (Fig. 2j, k). The CA regions showed many tangles, mainly consisting of mature NFTs in CA2 together with pretangles in other CA regions (Fig. 2l). In the DG, mainly pretangles were observed (Fig. 2m). Sparse cytoplasmic pTDP-43 inclusions (< 2 per limbic region) were observed in the EntC, amygdala and CA1-4 (Fig. 2n-p). Differences between pure MSA and mixed MSA + AD donors are not depicted, as α-syn pathology was similar between groups, and Aβ and p-tau pathology, though largely restricted to mixed donors by definition, displayed comparable regional distribution patterns.
Prevalence and regional distribution of pathologiesα-Syn pathology was detected in 100% of all donors in the amygdala, 99% in the EntC, 94% in CA3 + 4, 86% in CA1, 84% in the DG, and 77% in CA2 (Fig. 3a). Aβ pathology in 31% of the donors in the EntC, 28% in the amygdala, 19% in CA1, 14% in the DG, 13% in CA3 + 4, and 5% in CA2. p-Tau in 91% of the donors in the EntC, 90% in the amygdala, 77% in CA1, 67% in CA2, 56% in CA3 + 4, and 47% in the DG. Lastly, pTDP-43 pathology was detected in only 11% of the donors in the amygdala, 3% in CA1, 2% in the EntC, and was absent in CA2, CA3 + 4 and the DG. Due to the low number of pTDP-43 inclusions (maximum 2 per region), this pathology was not further quantified.
Fig. 3
Prevalent neuronal α-syn in the amygdala and DG, diffuse but also compact and classic-cored Aβ plaques in the EntC and amygdala and mostly p-tau threads, NFTs and some pretangles in CA regions. (a) Boxplots show the prevalence (% of donors affected) of α-syn, Aβ, p-tau and pTDP-43 pathology in each brain region. Regional color codes in (a) are used consistently throughout the figure. (b, c, e-i) Bar graphs show mean inclusion densities per mm2 [SD]. (f, n) Violin plots represent ordinal scores for neuritic α-syn (d) and p-tau threads (j). α-Syn inclusion density was largely similar between groups (b-d), except for a higher threads score in the amygdala of mixed MSA + AD donors (d). GCIs, and neurites were most prominent in the amygdala (b, d), and neuronal inclusions in the amygdala and DG (c). By design, mixed MSA + AD donors showed higher Aβ and p-tau pathology across several limbic regions (e-j). Diffuse Aβ plaques predominated, with highest Aβ plaque densities in the EntC and amygdala (e–g). p-tau predominantly consisted of mature NFTs, with highest tangle density in CA2 and CA1 (h-j). Significant differences between pure MSA (P) and mixed MSA + AD (M) are indicated between bars. Regional differences are marked with capped lines. Significance is demonstrated as * p < 0.05, ** p < 0.01, *** p < 0.001, ns = not significant
Inter-rater reliability of pathological burden between assessors was as following for α-syn (ICC2: 0.97, MAE: 0.44), Aβ (ICC2: 0.99, MAE 0.21) and p-tau (ICC2: 0.96, MAE: 0.31). The most prominent findings on the differences in regional distribution of α-syn, Aβ, and p-tau pathology between groups and regions were described below (Fig. 3b-j), and full pairwise comparisons are reported in Online Resource 1, part 8 (groups), and 9 (regions).
Mixed MSA donors showed higher α-syn threads scores in the amygdala (p = 0.012), while total α-syn %area, GCIs and neuronal α-syn did not differ between groups (Fig. 3b-d). GCIs and α-syn neurites were most abundant in the amygdala (vs. EntC, CA1, CA3 + 4 and DG, all p ≤ 0.019 and vs. EntC, CA2, CA3 + 4 and DG, all p ≤ 0.002; respectively), while neuronal α-syn predominated in the DG (vs. EntC, CA1 and CA3 + 4, all p < 0.001). As per definition, Aβ and p-tau burden was higher in mixed MSA + AD donors in multiple regions (Fig. 3e-j). The highest density of diffuse Aβ plaques was observed in the EntC (vs. CA1-4 and DG, p ≤ 0.003), compact Aβ plaques were similarly distributed across regions, and classic-cored Aβ plaques were limited to the EntC, amygdala and CA1. For p-tau, the highest densities of pretangles (vs. EntC, amygdala and CA3 + 4, p ≤ 0.005) and mature NFTs (vs. EntC, amygdala, CA3 + 4 and DG, p ≤ 0.004) were observed in CA2, while most threads were observed in the EntC (vs. CA3 + 4 and DG, both p < 0.001).
Regional vulnerability underlies co−pathology patterns in MSATo explore potential shared mechanisms between proteinopathies in MSA, we examined standardized regression coefficients between neuropathological inclusions, adjusted for age at death and sex (Fig. 4; Online Resource 1, part 10a + b). Since %area of α-syn, Aβ and p-tau showed minimal differences in regional distribution, we examined associations for morphological outcome measures only.
Fig. 4
Neuropathological and clinicopathological associations across limbic brain regions. Bubble plots show standardized effect estimates from linear models assessing associations across regions (EntC, amygdala, CA1, CA2, CA3 + 4 and DG) between neuropathological burden and clinical variables, adjusting for age at death and sex. Pairwise associations between standardized neuropathological burden (a), and associations between clinical variables and neuropathological burden (b). α-Syn pathology was not associated with Aβ or p-tau pathology. In contrast, co-pathologies (Aβ and p-tau) were linked to older age at death, clinical misdiagnoses, and higher CDR scores. Notably, higher CDR scores were associated with neuritic, but not glial, α-syn pathology, suggesting a cognitive contribution of neuronal α-syn burden alongside co-pathology in MSA. Bubble size represents the absolute strength of the correlation, color indicates the direction (red = positive, white = no association, blue = negative). Significance after FDR correction is demonstrated in bold as *p < 0.05, **p < 0.01, and ***p < 0.001
Overall, α-syn pathology, including GCIs, neuronal inclusions and neurites, did not show a strong correlation with co-pathology. Notable exceptions included associations between α-syn threads and both classic-cored Aβ plaques (r ≥ 0.16, p = 0.015) and p-tau threads (r = 0.18, p < 0.001). Additionally, GCI density associated with neuronal α-syn inclusions and neurites (r ≥ 0.26, both p < 0.001). A negative association was observed between compact Aβ plaques and p-tau NFTs (r = -0.20, p < 0.001), while diffuse Aβ plaques were positively associated with p-tau threads (r = 0.11, p = 0.015), and higher Aβ Thal phases associated with p-tau NFTs and threads (r = 0.23, p = 0.009 and r = 0.24, p = 0.029). Lastly, TDP-LATE stage was associated with classic-cored Aβ plaques, p-tau pretangles and NFTs (r ≤ 0.14, p ≤ 0.036) and not with α-syn pathology. See Online Resource 1, part 10a + b for all neuropathological associations.
To examine whether these associations reflect consistent patterns or regional vulnerability, we next conducted region-specific analyses across the six limbic regions (EntC, amygdala, CA1, CA2, CA3 + 4 and DG) [Online Resource 1, part 11]. α-Syn pathology did not associate with Aβ or p-tau pathology in any individual region. However, GCIs remained significantly associated with neuronal α-syn inclusions and neurites, with the strongest associations in CA1 (r = 0.92 and r = 0.54, both p < 0.001). Pronounced regional vulnerability was observed in CA3 + 4, which exhibited the strongest correlations between co-pathologies; diffuse and compact Aβ plaques associated with p-tau pretangles, NFTs and threads in CA3 + 4 (all r ≥ 0.39, p ≤ 0.002).
Cognitive impairment in MSA reflects neuronal α−syn, Aβ, and p−tau pathology burdenTo assess how limbic pathological burden influences clinical presentation, we examined associations between pathological inclusions and clinical outcomes across all regions (Fig. 4; Online Resource 1, part 10c + d). α-Syn GCIs, neuronal inclusions, and neurites were associated with a younger age at onset (r ≥ -0.70, p ≤ 0.021) and a longer disease duration (r ≥ 0.26, p ≤ 0.007), while Aβ and p-tau pathology were not. A higher age at death was associated with diffuse, compact and classic-cored Aβ plaques (all r ≥ 0.23, p ≤ 0.020), as well as p-tau pretangles, NFTs and threads (all r ≥ 0.33, p < 0.001). Higher CDR scores were linked to α-syn neurites (r = 0.24, p = 0.027) and to diffuse and compact Aβ plaques (both r ≥ 0.24, p ≤ 0.015). Furthermore, a higher rate of misdiagnoses was observed in donors with compact Aβ plaques (r = 0.21, p = 0.040) and p-tau pretangles and NFTs (both r ≥ 0.18, p ≤ 0.020). The associations with misdiagnoses remained significant after adjusting for age at onset (all r ≥ 0.20 for all, p ≤ 0.026). Diffuse and classic-cored Aβ plaques were associated with a higher frequency of APOE-ε4 alleles (r ≥ 0.22, p ≤ 0.002), but not with any of the other pathological inclusions. Although hallucinations appeared somewhat more frequently in pure MSA than in MSA + AD, we found no association between hallucinations and neuronal α-syn inclusions in limbic regions (r = –0.00, p = 0.970). The presence of hallucinations was also not associated with the severity of other pathological markers (r < ± 0.13, p > 0.45) and was therefore not visualized in the graph. Lastly, Braak α-syn, MSA-SND, and MSA-OPCA stages were not associated with any of the clinical outcome measures. See Online Resource 1, part 10d for all associations between neuropathological stages and clinical outcomes.
To determine whether the clinicopathological associations reflected general or region-specific clinical vulnerability, we explored associations across limbic regions [see Online Resource 1, part 11]. Pathologies that associated most strongly with both age at onset and disease duration were α-syn GCIs and neuronal inclusions in CA1 (age at onset: both r ≥ -0.51, p < 0.001; disease duration: both r ≥ 0.55, p < 0.001). Pathology correlating most strongly with age at death included p-tau pretangles, NFTs and threads across all regions (all r ≥ 0.34, p ≤ 0.020) and diffuse Aβ plaques in the EntC, amygdala, CA1 and DG (r ≥ 0.32, p ≤ 0.025). Most strongly associated with CDR scores were diffuse and compact Aβ plaques in the EntC (both r ≥ 0.50, p < 0.001), p-tau pretangles in CA3 + 4 (r = 0.43, p = 0.002), and α-syn neuronal inclusions and neurites in the amygdala (r ≥ 0.54, p < 0.001). Pathologies strongly associated with misdiagnoses were p-tau pretangles in CA3 + 4 (r = 0.42, p = 0.002), p-tau NFTs (r = 0.41, p = 0.003) and neuronal α-syn inclusions in the amygdala (r = 0.32, p = 0.025), compact Aβ plaques in CA1 (r = 0.32, p = 0.025) and diffuse Aβ plaques in the DG (r = 0.36, 0.011). Lastly, diffuse and classic-cored Aβ plaques, together with p-tau pretangles and NFTs associated with APOE-ε4 allele frequency in the EntC (all r ≥ 0.31, p ≤ 0.034).
Comments (0)