
Remember me


OVA (grade V and II) was purchased from Sigma-Aldrich, meanwhile, aluminum hydroxide was purchased from the Tianjin Damao Chemical Reagent Factory. Additionally, C-176 was purchased from Selleck Chemicals. A hematoxylin and eosin (HE) staining kit was purchased from Wuhan Service Bio Technology Co., Ltd. The Periodic Acid-Schiff (PAS) staining kit, as well as MDA and SOD assay kits, along with rabbit IgG were purchased from Beyotime Biotech Inc. Mouse enzyme-linked immunosorbent assay (ELISA) kits were purchased from Quanzhou Ruixin Biotechnology Co., Ltd. The immunohistochemistry kit was purchased from Fuzhou Maixin Biotech Co., Ltd. The quantitative polymerase chain reaction (qPCR) reverse transcription kit and qPCR kit were purchased from Nanjing Vazyme Biotech Co., Ltd. The qPCR primers were purchased from Hunan Accurate Biology Co., Ltd. Rabbit anti-STING antibody was purchased from Cell Signaling Technology. Rabbit anti- ACSL4 (acyl-CoA synthetase long-chain family member 4) and GPX4 antibodies were purchased from Abcam. Rabbit anti-β-actin antibody was purchased from Proteintech Group, Inc. Mouse anti-ACSL4 antibody and protein A/G agarose beads were purchased from Santa Cruz.
Experimental AnimalsSPF-grade C57BL/6 J mice (6–8 weeks old, female, body weight 17–19 g, specific pathogen-free) were purchased from Beijing Huafukang, and housed in the barrier system of the Experimental Animal Center at China Medical University (12-h light/dark cycle, temperature 22 ± 2 °C, humidity 55 ± 5%, with ad libitum access to fresh water, food, and bedding). All animal experiments were conducted in accordance with the regulations of the National Animal Protection Law of China and approved by the Animal Ethics and Use Committee of China Medical University (No. 2024PS023K).
Establishment and Intervention of the OVA-Sensitized Asthma ModelAfter 1 week of acclimatization, the mice were randomly assigned to three groups: the control group (NS, n = 8), the OVA-sensitized asthma group (OVA, n = 8), and the OVA-sensitized asthma model combined with the STING inhibitor group (OVA + C-176, n = 8).
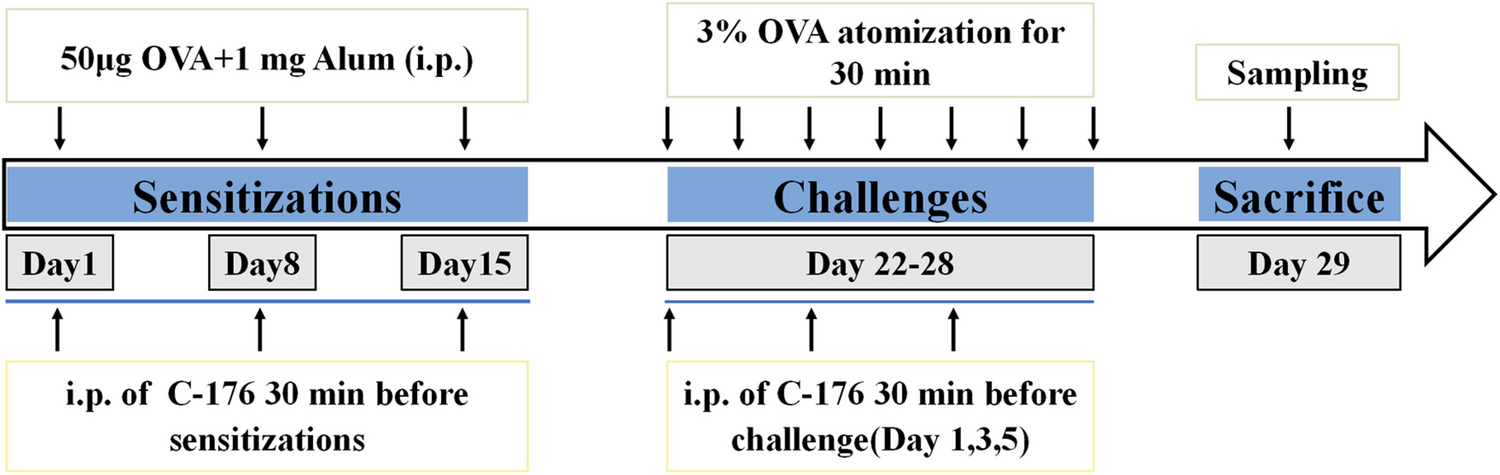
As illustrated in Fig. 1, mice in the OVA group were intraperitoneally injected with the sensitizing solution (containing 50 μg of grade V OVA and 1 mg of aluminum hydroxide dissolved in 0.1 mL of saline) on days 1, 8, and 15 (sensitization phase). From days 22 to 28 (challenge phase), the mice were subjected to daily 30-min (min) aerosolized inhalation of 3% grade II OVA solution [26]. In the OVA + C-176 group, the same treatment as in the OVA group was applied, with the additional intervention of C-176 solution (1.34 mg/mL, 0.2 mL) administered intraperitoneally 30 min before each sensitization injection. During the challenge phase, C-176 was administered intraperitoneally at the same dosage on days 22, 24, and 26, 30 min prior to aerosol inhalation. Following the administration, mice were carefully monitored for adverse reactions. In the control group, saline was substituted for the sensitizing solution and C-176 was administered at the corresponding time points. Blood serum, bronchoalveolar lavage fluid (BALF), and lung tissue samples were collected within 24 h following the final challenge for subsequent analysis.
Fig. 1
The flow chart for preparing an ovalbumin-sensitized asthma mouse model
BALF Collection and Cell CountingBALF was collected by slowly injecting 1 mL of saline into the lungs using a 1 mL syringe. The lungs were observed to exhibit swelling and a whitish coloration. After allowing saline to remain in the lungs for 10 s (s), it was gradually withdrawn. This process was repeated thrice, ensuring a recovery rate of at least 80%. After centrifugation (4°C, 1500 rpm for 10 min), the supernatant was discarded, and the cells were resuspended in ice-cold saline twice until no significant cell clumps were visible. Cells were counted using a hemocytometer under a microscope.
ELISA AssayELISA kits were employed to assess the levels of IgE, IL-4, IL-13, and interferon-gamma (IFN-γ) in mouse serum. Furthermore, the ELISA kits and serum samples were allowed to equilibrate at room temperature before use. Standard, sample, blank, and zero-value wells were prepared, with 50 μL of the corresponding solution added to each well, followed by the addition of 100 μL of horseradish peroxidase (HRP)-conjugated detection antibody. The plates were then sealed and incubated at 37 °C in the dark for 1 h. After washing, 100 μL of freshly prepared substrate solution was added to each well, and the plate was incubated at 37 °C in the dark for 15 min. Finally, 50 μL of stop solution was added to terminate the reaction, and the optical density (OD) was observed at 450 nm.
HE StainingMouse lung tissue was fixed in 4% paraformaldehyde, embedded in paraffin wax, and sectioned into 3.5 μm-thick slices. The sections were then baked overnight at 60°C. Following that sections were deparaffinized and stained with HE. After dehydration and clearing, the sections were mounted and imaged. Inflammatory cell infiltration around the airways and blood vessels in lung tissue was evaluated to determine the inflammation score, as previously described [27]. To prevent sampling bias, three lung sections from each mouse were systematically selected for analysis.
PAS StainingSections (3.5 μm thick) were deparaffinized and rehydrated. According to the PAS staining kit instructions, sections were initially treated with periodic acid for 10 min, followed by incubation with Schiff’s reagent at 37 °C for 45 min, and counterstained with hematoxylin for nuclear staining for 30 s. After each step, the sections were washed thrice with phosphate-buffered saline (PBS) for 5 min. The sections were dehydrated, cleared, mounted, and imaged. PAS-stained glycogen-positive areas were quantified using the ImageJ software to calculate the percentage of positive staining. To prevent sampling bias, three lung sections from each mouse were systematically selected for analysis.
Immunohistochemistry StainingSections (3.5 μm thick) were deparaffinized and rehydrated, followed by antigen retrieval using citrate buffer (pH 6.0) at 37 °C for 7 min 30 s. The sections were incubated sequentially with endogenous peroxidase blocking solution (40 min), non-specific staining blocking solution (40 min), primary antibodies (STING: 1/400, ACSL4:1/200, GPX4:1/200) at 4 °C for 17 h, biotinylated IgG polymer (30 min), and streptavidin-HRP conjugate (30 min). After each incubation step, the sections were washed thrice with PBS for 5 min. The reaction was developed using 3,3′-diaminobenzidine (optimal development time: 1–3 min), followed by hematoxylin counterstaining. After dehydration and clearing, the sections were mounted and imaged. The positive area of target protein expression was quantified using the ImageJ software. To prevent sampling bias, three lung sections from each mouse were systematically selected for analysis.
qRT-PCRTotal ribonucleic acid (RNA) was extracted from the lung tissue using a TRIzol reagent, and its concentration was determined. Complementary DNA (cDNA) was synthesized through reverse transcription. Additionally, qRT-PCR was also performed. The total reaction volume was 20 μL, consisting of 10 μL of 2 × qPCR Master Mix, 0.4 μL of forward primer (10 μM), 0.4 μL of reverse primer (10 μM), 7.2 μL of DEPC-treated water, and 2 μL of cDNA template. The reaction was conducted using a quantitative PCR instrument, and the results were analyzed using the 2-∆∆Ct method with β-actin serving as the internal control gene. The primer sequences used were as follows: STING (mouse, F—AGGAGGAGGTTACCATGAATG, R – ATACCACTGATGAGGAGTCTTG), β-actin (mouse, F—CATCCGTAAAGACCTCTATGCCAAC, R – ATGGAGCCACCGATCCACA).
Western Blot (WB)Total protein was extracted from lung tissue using radioimmunoprecipitation assay (RIPA) buffer, and protein concentration and denaturation were determined. For each lane, 20 μg of protein was loaded, and they were separated using 10% or 12.5% SDS-PAGE gels, depending on the molecular weight of the target protein. After electrophoresis, the proteins were transferred onto a polyvinylidene fluoride membrane, which was blocked for 2 h. The membrane was incubated with primary antibodies (STING: 1/1000, ACSL4:1/25000, GPX4:1/5000, and β-actin: 1/5000) at 4 °C for 14 h, followed by incubation with secondary antibody (1/7500) for 2 h. Between each incubation step, the membrane was washed thrice for 10 min with TBST. Protein bands were visualized using chemiluminescence and band intensities were quantified using ImageJ software. β-actin was utilized as the internal control protein to de-correct the grey values.
MDA DetectionFresh lung tissue samples were obtained and homogenized in RIPA buffer, followed by centrifugation to obtain supernatant for analysis. The protein concentration was then determined. The MDA working solution and standards were prepared in advance according to the manufacturer’s instructions. Standard, sample, and blank control wells were prepared, and 100 μL of the corresponding solution followed by 200 μL of the MDA working solution was added to each well. The mixture was initially incubated in a 100 °C metal bath for 15 min and then cooled to room temperature in a water bath. After centrifugation, 200 μL of the supernatant was transferred to a 96-well plate, and the OD value was measured at 532 nm, with 450 nm used as the reference wavelength. MDA levels were calculated based on the MDA content and protein concentration of the sample and expressed as per unit of protein weight.
Total SOD DetectionFresh lung tissue samples were collected and homogenized in SOD sample preparation buffer, and centrifuged to obtain samples for analysis. The protein concentration was then determined. The WST-8/enzyme working and reaction initiation solutions were prepared according to the manufacturer’s instructions. In a 96-well plate, the samples and WST-8/enzyme working solution were added sequentially, followed by the addition of the reaction initiation solution. After thorough mixing, the plates were incubated at 37 °C for 30 min. The OD was measured at 450 nm, with 650 nm used as the reference wavelength. The inhibition percentage and SOD enzyme activity units were calculated, and the activity was expressed per unit weight of protein based on the protein concentration of the sample.
Immunofluorescence StainingSections (3.5 μm) were deparaffinized, rehydrated, and then subjected to antigen retrieval in antigen retrieval solution at 37 °C for 7 min 30 s. The sections were incubated sequentially with Triton (30 min), 5% bovine serum albumin (37°C for 2 h), primary (STING and ACSL4 were co-incubated at 4 °C for 17 h), and secondary antibodies (2 h), as well as 4’,6-diamidino-2-phenylindole (5 min). After each incubation step, the sections were washed thrice for 5 min each with PBS and kept in the dark. Finally, sections were mounted and imaged immediately. The positive area of target protein expression was quantified using ImageJ software. Co-localization analysis was also performed. The following primary antibodies were used: STING (anti-rabbit, 1/400) and ACSL4 (anti-mouse, 1:100).
Co-Immunoprecipitation (Co-IP) DetectionFresh lung tissue samples were collected, homogenized in IP lysis buffer containing a protease inhibitor cocktail, and incubated on ice for 30 min to allow lysis. The samples were then centrifuged and the supernatant was collected for protein concentration determination. The samples were then divided into two groups. One portion (IP group) was incubated with IgG, anti-STING antibody, or anti-ACSL4 antibody with gentle rotation at 4 °C for 16 h. The remaining portion (input group) was processed for protein denaturation. Subsequently, the IP group was incubated with agarose beads with gentle rotation at 4 °C for 4 h. After centrifugation, the supernatant was discarded, and the agarose bead-antibody-antigen complex was washed. The proteins were then denatured and both the IP and input groups were subjected to WB analysis.
Statistical AnalysisAll data in this study were expressed as means ± standard deviation, and data analysis and graphing were performed using GraphPad Prism 9.0. For comparisons between two groups, if the data followed a normal distribution, an unpaired t-test was used. However, if the data followed an abnormal distribution, the Mann–Whitney U test was applied. For comparisons between multiple groups, a one-way analysis of variance was employed if the data were normally distributed with equal variances; otherwise, nonparametric tests were performed. P < 0.05 was considered statistically significant.
Comments (0)